Identification of possible natural compounds as potential inhibitors against Plasmodium M1 alanyl aminopeptidase
A thesis submitted in partial fulfillment of the requirements for the degree of Master of Science in Bioinformatics
at
RHODES UNIVERSITY, SOUTH AFRICA
Department of Biochemistry and Microbiology Faculty of Science
by
Omar Samir Abdel Ghaffar Soliman
2018
Abstract
Malaria is a major tropical health problem with a 29% mortality rate among people of all ages; it also affects 35% of the children. Despite the decrease in mortality rate in recent years, malaria still results in around 2000 deaths per day. Malaria is caused by Plasmodium parasites and is transmitted to humans via the bites from infected female Anopheles mosquitoes during blood meals. There are five different Plasmodium species that can cause human malaria, which include Plasmodium falciparum, Plasmodium vivax, Plasmodium malariae, Plasmodium ovale and Plasmodium knowlesi. Among these five species, the most pathogenic ones are Plasmodium falciparum and Plasmodium vivax. Malaria is usually hard to diagnose because the symptoms are not exclusive to malaria and very similar to flu, e.g., fever, muscle pain, and chills, which lead to the misdiagnosis of malaria cases. Malaria is lethal if not treated because it can cause severe complications in the respiratory tract, liver, metabolic acidosis, and hypoglycemia. The malaria parasite life cycle includes two types of hosts, i.e., a human host and female Anopheles mosquito host. Malaria continuously develops resistance to the available drugs, which is one of the major challenges in disease control. This situation confirms the need to develop new drugs that target virulence factors of malaria. The malarial parasite has three main life cycle stages, which include the host liver stage, host blood stage and vector stage. In the blood stage, parasites degrade hemoglobin to amino acids, which is important as these parasites cannot produce their own amino acids. Different proteases are involved in this hemoglobin degradation process. M1 alanyl aminopeptidase is one of these proteases involved at the end of hemoglobin degradation. This study focused on M1 alanyl aminopeptidase as a potential drug target. M1 alanyl aminopeptidase consists of four domains: N-terminal domain, catalytic domain, middle domain and C-terminal domain. The catalytic domain remains conserved among different Plasmodium species. Inhibition of this enzyme might prevent Plasmodium growth as it can’t produce its own amino acids. In this study, sequence analysis was carried out in both human and Plasmodium M1 alanyl aminopeptidase to identify conserved and divergent regions between them. 3D protein models of the M1 alanyl aminopeptidase from Plasmodium species were built and validated. Then the generated models were used for virtual screening against 623 compounds retrieved from the South African Natural Compounds Database (SANCDB, https://sancdb.rubi.ru.ac.za/). Virtual screening was done using blind and targeted docking methods. Docking was used to identify compounds with selective high binding affinity to the active site of the parasite protein. In this study, one
SANCDB compound was selected for each protein: SANC00531 was selected against P.
falciparum M1 alanyl aminopeptidase, SANC00469 against P. knowlesi, SANC00660 against P.
vivax, SANC00144 against P. ovale and SANC00109 against P. malariae. It was found that Plamsodium M1 alanyl aminopeptidase can be used as a potential drug target as it showed selective binding against different inhibitor compounds. This result will be investigated in future work though molecular dynamic analysis to investigate the stability of protein-ligand complexes.
Declaration
I declare that this thesis is my own, unaided work, unless otherwise stated. It is being submitted for the degree of Master of science at Rhodes University. It has not been submitted before for any degree or examination in any other university.
Signature………
Date………
Dedication
This thesis is dedicated to the loving memory of Prof. Ahmed Shokry
For always encouraging and motivating me to believe in myself and science
Acknowledgements
I would first like to thank Prof. Özlem Tastan Bishop. The door to Prof. Özlem’s office was always open whenever I ran into a problem or had a question about my research or writing. She directs and advises me always in the right the direction. My sincere gratitude and appreciation goes to her for always supporting me.
I would like also to express my sincere gratitude to my advisor Dr. Vuyani Moses for the continuous support of my master study and research, for his patience, motivation, encouragement and explanation. His guidance helped me in all the time of research and writing of this thesis.
Furthermore, I would like to express my appreciation to all RUBi family for the continuous discussions and for the sleepless nights we were working together before deadlines. I am deeply especially grateful to Mr. Magambo Philip Kimuda, Mr. Olivier Sheik Amamuddy, Mr. Bakary N'tji Diallo, Dr. Natasha Sanabria and Afrah Khairallah.
Last but not the least, I would like to thank my family: My father Prof. Samir Abd El Ghaffar, my mother Prof. Elham El sayed and my wife Rofaida Saad. With their support, encouragement, sacrifice and prayer, this thesis has become possible.
Table of Contents
Chapter 1 - Literature Review ... 1
1.1 Introduction ... 1
1.2 Signs and Symptoms ... 1
1.3 Malaria life cycle ... 1
1.3.1 Liver stage ... 2
1.3.2 Intra-erythrocyte stage (Blood stage) ... 2
1.3.3 Mosquito stage ... 5
1.4 Peptidases ... 6
1.4.1 Metallopeptidases ... 7
1.4.2 Exo-aminopeptidases ... 7
1.5 Malaria diagnosis ... 12
1.6 Malaria treatment ... 13
1.7 Antimalarial drug resistance ... 14
1.8 Malaria vaccine ... 15
1.9 Problem statement and hypothesis ... 16
1.10 Aim and objectives ... 16
Chapter 2 – Sequence Analysis ... 17
2.1 Introduction ... 17
2.1.1 Motif analysis ... 17
2.1.1.1 Multiple Em for Motif Elicitation suite ... 18
2.1.1.2 Pfam ... 20
2.1.2 Sequence alignments ... 20
2.1.2.1 Pairwise sequence alignment ... 21
2.1.2.2 Multiple sequence alignment ... 22
2.1.2.3 Phylogenetic analysis ... 22
2.2 Methods ... 24
2.2.1 Sequence retrieval ... 24
2.2.2 Motif analysis ... 24
2.2.2.1 Pfam ... 24
2.2.2.2 Multiple Em for Motif Elicitation suite ... 24
2.2.3 Sequence alignment ... 25
2.2.4 Phylogenetic analysis ... 25
2.3 Result and Discussion ... 26
2.3.1 Sequence retrieval ... 26
2.3.2 Motif analysis ... 26
2.3.2.1 Pfam ... 26
2.3.2.2 Multiple Em for Motif Elicitation suite ... 28
2.3.3 Multiple sequence alignment ... 30
2.3.4 Phylogenetic tree ... 32
2.4 Conclusion ... 34
Chapter 3 - Homology Modelling ... 35
3.1 Introduction ... 35
3.1.1 Template identification ... 35
3.1.2 Sequence alignment ... 36
3.1.3 Model building ... 37
3.1.4 Structural refinement ... 37
3.1.5 Model validation ... 38
3.2 Methodology ... 38
3.2.1 Template identification ... 38
3.2.2 Sequence alignment ... 39
3.2.3 Model building and refinement ... 39
3.2.4 Model evaluation ... 39
3.3 Result and Discussion ... 40
3.3.1 Template identification ... 40
3.3.2- Sequence alignment... 46
3.3.3- Model Building ... 50
3.3.4- Model Evaluation ... 52
3.4 Conclusion ... 61
Chapter 4 - Virtual Screening ... 63
4.1 Introduction ... 63
4.1.1 Computation docking ... 63
4.1.2 Virtual screening ... 63
4.1.3 Structural based virtual screening ... 64
4.2 Methodology ... 66
4.2.1 Target and ligand preparation ... 66
4.2.2 Grid box calculation and parameter file generation ... 66
4.2.3 Molecular docking ... 67
4.2.4 Docking validation ... 67
4.2.5 Docking analysis ... 67
4.3 Result and Discussion ... 68
4.3.1 Grid box calculation ... 69
4.3.2 Docking validation ... 69
4.3.3 Docking analysis ... 71
4.4 Conclusion ... 92
Chapter 5 - Summary and future prespectives ... 93
References ... 95
List of Figures
Figure 1-1: Malaria asexual cycle.. ... 4
Figure 1-2: Malaria sexual cycle. ... 5
Figure 1-3: Mosquito stage. ... 6
Figure 1-4: Hemoglobin digestion. ... 9
Figure 2-1: Example of sequence logo.. ... 18
Figure 2-2: Summary of Multiple Em for Motif Elicitation suite feature and suggested workflow ... 19
Figure 2-3: Global and local alignment. ... 21
Figure 2-4: Iterative alignment method steps ... 22
Figure 2-5: Multiple Em for Motif Elicitation heatmap. ... 29
Figure 2-6: MUSCLE alignment result. ... 30
Figure 2-7: T – Coffee expresso alignment result. ... 31
Figure 2-8: Conserved active site residues. ... 32
Figure 2-9: Molecular phylogenetic analysis ... 33
Figure 3-1: Summary of target Plasmodium sequences with the best 10 possible templates.. 43
Figure 3-2: wwPDB validation representing the overall quality ... 44
Figure 3-3: Graphical representation of 3D-1D averaged scores per residue number. ... 45
Figure 3-4: QMEAN validation result. ... 45
Figure 3-5: Alignment between template (PDB ID: 3Q43) and Plasmodium vivax ... 47
Figure 3-6: Template-target alignment generated by 3D-coffee. ... 49
Figure 3-7: Top three model for each run superimposed with the original template. ... 51
Figure 3-8: Verify 3D result for the top selected three models for each Plasmodium species. ... 54
Figure 3-9: QMEAN analysis result. ... 59
Figure 3-10: The procheck result shows Ramachandran plot for top selected models... 60
Figure 3-11: ANOLEA result for the active site region. ... 61
Figure 4-1: Human structure grid box ... 69
Figure 4-2: Plasmodium falciparum structure grid box ... 69
Figure 4-3: Ligand-Target 2D interaction created by LigPlot for Plasmodium falciparum .... 70
Figure 4-4: Ligand-Target 2D interaction created by LigPlot for human target. ... 70
Figure 4-5: Heatmap for all docked compounds against M1 alanyl aminopeptidase of human and Plasmodium species. ... 71
Figure 4-6: Protein-ligand complex. ... 73
Figure 4-7: M1 Alanyl aminopeptidase human structure and all ligand complex ... 74
Figure 4-8: Heatmap for ligands. ... 74
Figure 4-9: Graphical representation of Xscore result ... 76
Figure 4-10: Graphical representation of number of bonds interaction. ... 78
Figure 4-11: Graphic representation shows the interactions between Ligand SANC0531 and M1 alanyl aminopeptidase of Plasmodium falciparum protein. ... 80
Figure 4-12: Graphic representation shows the interactions between Ligand SANC0552 and M1 alanyl aminopeptidase of Plasmodium falciparum protein. ... 81
Figure 4-13: Graphical representation created by LigPlot for SANC00531 and M1 alanyl aminopeptidase of Plasmodium falciparum protein. ... 82
Figure 4-14: Graphic representation shows the interactions between Ligand SANC0469 and M1 alanyl aminopeptidase of Plasmodium knowlesi protein. ... 85
Figure 4-15: Graphic representation shows the interactions between Ligand SANC0144 and M1 alanyl aminopeptidase of Plasmodium ovale protein. ... 86
Figure 4-16: Graphic representation shows the interactions between Ligand SANC0660 and M1 alanyl aminopeptidase of Plasmodium vivax protein. ... 87 Figure 4-17: Graphic representation shows the interactions between Ligand SANC0109 and M1 alanyl aminopeptidase of Plasmodium malaraie protein. ... 88 Figure 4-18: Graphical representation created by LigPlot for SANC00531 and M1 alanyl aminopeptidase of Homo sapiens protein.. ... 89 Figure 4-19: Graphical representation created by LigPlot for SANC00469 and M1 alanyl aminopeptidase of Homo sapiens protein. ... 90 Figure 4-20: Graphical representation created by LigPlot for SANC00660 and M1 alanyl aminopeptidase of Homo sapiens protein. ... 90 Figure 4-21: Graphical representation created by LigPlot for SANC00144 and M1 alanyl aminopeptidase of Homo sapiens protein. ... 91 Figure 4-22: Graphical representation created by LigPlot for SANC00109 and M1 alanyl aminopeptidase of Homo sapiens protein. ... 91
List of Tables
Table 1-1: Summary of needed time for complete maturation of gametocytes ... 6
Table 1-2: Proteases clans and families and sub-families based on catalytic type ... 10
Table 1-3: Summary of MA metallopeptidase enzymes (adapted from MEROPS database) . 11 Table 2-1: Summary of M1 alanyl aminopeptidase Plasmodium falciparum sequence and its orthologues retrieved sequences. ... 26
Table 2-2: Summary of Pfam result shows the start and end position of founded domains.... 27
Table 2-3: BIC scores of evolutionary models generated by MEGA model selection tool. ... 32
Table 3-1: Summary of Plasmodium species and their corresponding accession number ... 39
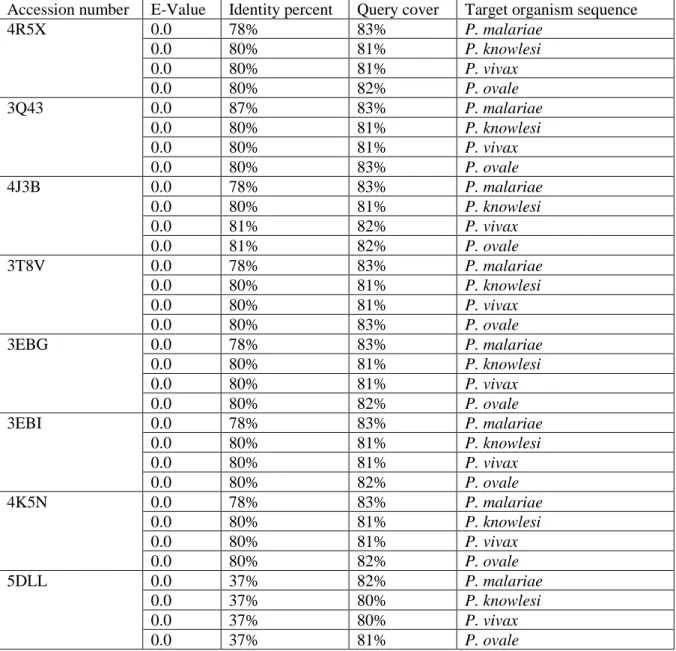
Table 3-2: Summary of templates retrieved from BLAST with e-value = 0 ... 41
Table 3-3: Possible templates without unaligned tails ... 41
Table 3-4: Summary of the best template for each sequence retrieved from HHpred ... 44
Table 3-5: Summary of DOPE-Z score and RMS score of best three models for each run. ... 50
Table 3-6: PROCHECK local quality assessments scores. ... 52
Table 3-7: Verify 3D quality assessment score for each model. ... 54
Table 3-8: Top selected model with the corresponding Plasmodium species. ... 55
Table 4-1: Number of selected ligands in ligand selection steps for each target organism. .... 75
Table 4-2: Summary of eliminated ligands represent the number of unfavorable bond ... 77
Table 4-3: The tabulated result of Lipinski test for best ten ligands against M1 alanyl aminopeptidase of Plasmodium falciparum... 79
Table 4-4: The tabulated result of Lipinski test for best ten ligands against M1 alanyl aminopeptidase of Plasmodium knowlesi. ... 83
Table 4-5: Tabulated result of Lipinski test for best ten ligands against M1 alanyl aminopeptidase of Plasmodium ovale. ... 83
Table 4-6: Tabulated result of Lipinski test for best ten ligands against M1 alanyl aminopeptidase of Plasmodium vivax. ... 83
Table 4-7: Tabulated result of Lipinski test for best ten ligands against M1 alanyl aminopeptidase of Plasmodium malaraie ... 84
List of abbreviations
3D 3 dimensional
BLAST Basic Local Alignment Search Tool
NCBI National Centre For Biotechnology Information MSA Multiple Sequence Alignment
DOPE Discrete Optimized Protein Energy HMM Hidden Markov Model
MAFFT Multiple Alignment Using Fast Fourier Transform MUSCLE Multiple Sequence Comparison By Log-Expectation PDB Protein Data Bank
PSI-BLAST Position Specific Iterated Blast
PROMALS3D Profile Multiple Alignment With Predicted Local Structures And 3D Constraints
SANCDB South African Natural Compound Database
WHO World Health Organization
Chapter 1 - Literature Review
1.1 Introduction
Human malaria infection can be caused by any of the 5 different parasite species that belong to the Plasmodium species. These parasites include Plasmodium falciparum, Plasmodium vivax, Plasmodium malariae, Plasmodium ovale and Plasmodium knowlesi. The parasite is transmitted to the human body through the bite of an infected female Anopheles mosquito. The female Anopheles mosquito’s saliva contains the parasite which is transmitted to human blood when the mosquito bites the human. The parasite matures and reproduces in the human liver before it infects and destroys red blood cells. The most pathogenic parasites in the Plasmodium genus are the P. falciparum and P. vivax species [1].
Around 1 million people are killed each year by malaria and in 2002, 515 million (range 300- 600 million) were attributed to episodes of clinical P. falciparum. 90% of malaria cases and deaths occur in sub-Saharan Africa, but malaria is also a public health problem in South America and South East Asia [2]. P. falciparum is responsible for most deaths in humans, however, other malaria-causing parasites such as P. vivax, P. ovale, and P. malariae do cause a milder form of the disease [3].
1.2 Signs and Symptoms
Malaria symptoms usually appear after 10 – 15 days following the infective mosquito bite. The malaria symptoms can be delayed by using the appropriate antimalarial drugs [4]. The first symptoms are flu-like symptoms which make it difficult to diagnose malaria. These symptoms include: headaches, fever, chills, and vomiting. It is very important to treat malaria within 24 hours or it can progress to severe illness, which could lead to death [5]. The symptoms can develop into severe anemia, cause respiratory distress, cerebral complications, hypoglycemia, and glomerulonephritis [6].
1.3 Malaria life cycle
Malaria has a complex life cycle involving two different hosts, the first one being a female Anopheles mosquito while the second is the human host [4]. In general, it involves three main stages. Firstly, there is a human liver stage, followed by a human blood cell stagewhich finally ends in the mosquito stages. Malaria infection begins with a bite from an infected female Anopheles mosquito that transmits sporozoites to vertebrate host (e.g: human host). Once they enter the host, they travel through blood vessels and infect hepatocytes where the parasite grows and reproduces asexually to produce merozoites to infect red blood cells, as shown in
Figure 1-1. Some of this merozoites develop into a sexual form that arev transmitted later to another mosquito during mosquito blood feeding as shown in Figure 1-2 [7].
1.3.1 Liver stage
During Anopheles mosquito bite, parasite sporozoites are transmitted to the human dermis. A portion of sporozoites penetrates blood vessels by using gliding motility, which depends on the Trap-like protein (TLP) [8]. Then they invade hepatocytes by using a moving junction- independent process via cell traversal (CT) and a moving junction-dependent process, thus creating parasitophorous vacuoles (PVs). CT starts with the breakdown of hepatocyte cell membranes to move through the cell cytoplasm using proteins such as the Perforin-Like Protein 1 (PLP1), the sporozoite microneme protein essential for traversal (SPECT) [7], phospholipase (PL) and the gamete egress and sporozoite traversal protein (GEST). To avoid degradation by lysosomes, sporozoites use pH sensing and PLP1 [8].
To invade host hepatocytes, the surface of sporozoites are coated by a key protein called circumsporozoite protein (CSP),which consist of a type I thrombospondin repeat (TSR) and a highly repetitive region. CSP binds with heparin sulfate proteoglycans (HSPGs), which are located on the hepatocyte surface. These activate CSP and remove the N-terminus to expose the TSR domain. Sporozoites also contains important organelles for hepatocyte invasion, such as micronemes and rhoptries. In order to form the PV microneme, proteins P52 and P36 interact with each other and with the hepatocyte Ephrin A2 receptor (EphA2). Additionally, the hepatocyte receptor CD81 plays an important role in PV formation [9]. Once a sporozoite successfully infects a hepatocyte, it resides within the PV. The sporozoite remains in the liver stage from 2 – 10 days. The result of this stage is the development and release of up to 40000 merozoites per hepatocyte cell into the bloodstream in the form of merosomes, which are vesicles filled with parasites [8].
1.3.2 Intra-erythrocyte stage (Blood stage)
After infecting liver hepatocytes for 2 – 10 days, the merozoites are released into the bloodstream to infect erythrocytes via ligand-receptor interactions. For P. falciparum, basigin, red blood cell antigen, and P. falciparum reticulocyte binding protein homologue 5 (PFRh5) interact to form a complex. This complex consists of PfRh5, PfRh5-interacting protein (PfRipr) and Cysteine-rich protective antigen (CyRPA), which bind the basigin of erythrocyte cell. This leads to the invasion of this erythrocyte[10]. For P. vivax it requires the presence of the Duffy blood group antigen Fya or Fyb. P. vivax cannot infect a host with the Duffy negative FyFy
The parasite has two alternative methods of reproduction, namely asexual (Figure 1-1) and sexual (Figure 1-2) multiplication. An asexual cycle takes between 24 hours to 72 hours depending on the parasite species whereby P. knowlesi takes 24 hours, P. falciparum and P.
vivax take 48 hours, and P. malariae takes 72 hours [11]. Most Plasmodium species take 48 hours to complete the sexual cycle while in P. falciparum it usually takes 10-12 days to complete a full cycle [12].
Each released merozoite invades an erythrocyte and begins the asexual cycle, which consumes the erythrocyte’s contents [12]. Malaria cannot produce its own amino and acids and thus it needs to degrade erythrocyte hemoglobin. The degradation takes place in the parasite digestive vacuole at pH 5.2 and occurs during the blood stage [13]. Inside this vacuole, a massive proteolytic pathway degrades hemoglobin into amino acids [14]. Each asexual cycle produces 16-32 new merozoites, which invade new erythrocytes. As a result, the parasite population is enlarged by a factor of 6 to 20 times per cycle. The Plasmodium parasite selectively invades erythrocytes, for example young erythrocytes are usually infected by P. vivax [9].
The asexual cycle consists of ring stage, a trophozoite stage, and a schizont stage. The first stage that is established after entering the erythrocyte is the ring stage. This stage is characterized by a ring-like shape under the microscope. Then they enter the trophozoite stage, in which surface antigens are expressed, during which high metabolic activity is observed. The last step is the schizont stage, which produces around 16-32 merozoites through cell division to result in the rupture of the erythrocyte andin the invasion of new erythrocytes. These stages are classified under the asexual blood stage [15].
Figure 1-1: The malaria parasite asexual cycle. Merozoite invasion of erythrocyte cells and the asexual cycle result in the production of 16-32 merozoites, which invade new healthy erythrocytes to initiate the second wave of erythrocyte invasion [8].
The resulting merozoites cannot be transmitted to a mosquito; thus a small portion of merozoites - usually less than 10% - go through with sexual reproduction (gametocytogenesis) and develop into sexual form (gametocytes) of the parasite. This results in a male and female gametocyte, which can be transmitted to a female mosquito during a blood meals. The duration of a gametocyte of P. vivax after releasing merozoites from hepatocytes takes around one week.
However, in P. falciparum the precise time of developing gametocyte is not fixed and is unclear as it depends on many factors. For example, if the parasite is exposed to an antimalarial drug, it will force the gametocyte to develop and survive. The same could happen if the human host is dying due to denaturation of red blood cells. At the same time, it could be affected with reproductive restraint such that the precise time of developing gametocyte is generally not clear and varies from one case to another and from one species to another [15].
Figure 1-2: Malaria parasite sexual cycle. The sexual cycle of Plasmodium parasite which takes place in erythrocyte cell and results in the production of sexual ring then male and female gametocytes. After maturation, they transmit to another mosquito during a blood meal [8].
1.3.3 Mosquito stage
During the Plasmodial life cycle, the parasite undergoes one sexual reproduction, which takes place only in the mosquito stage. Ingestion of male and female gametocytes activates the gametocytes in the mosquito midgut [16]. This activation is caused by the temperature drop, pH change and xanthurenic acid. Thus, the gametocytes mature and develop into gametes. Male gametes form the octoploid nucleus so that it goes through three fast DNA replication events.
Additionally, male gametes go through exflagellation, which results in the formation of eight flagella. The time needed to complete the maturation process differs from one Plasmodium species to another, as shown in Table 1-1. After completing the maturation step for both male (microgametes) and female gametes (macrogametes), the male gamete fertilizes female gamete to form a fertilized female gamete which will develop into an ookinete, as shown in Figure 1- 3. Ookinetes go through the mosquito’s midgut wall (epithelial cell wall) and form oocysts [15].
Each oocyst contains thousands of sporozoites. The sporozoite develops inside an oocyst until its rupture, resulting in the release of sporozoites into the body cavity. The sporozoites travel and migrate to the mosquito’s salivary gland where they wait for the mosquito to take the next
blood meal. During this blood meal, they are transmitted to another human host and start the liver stage infection [15].
Figure 1-3: The mosquito stage, in which most of the steps take place inside mosquito midgut, to result in the production sporozoites. In the end, sporozoites migrate to the salivary gland where they stay until the next mosquito blood meal [17].
Table 1-1: Summary of needed time for complete maturation of gametocytes [15]
Plasmodium species Time needed (days)
Plasmodium falciparum 8:10
P. malariae 6:8
P. vivax 3:4
P. ovale 3:4
1.4 Peptidases
According to the MEROPS database [18], there are different families of protease enzymes include Aspartic peptidases, Cysteine peptidases, Glutamic peptidases, Metallopeptidases, Asparagine peptidases, Mixed peptidases, Serine peptidases, Threonine peptidases and peptidase of unknown catalytic type (See Table 1-2). Each one of these families is identified
by a single letter representing the type of reaction of the protease enzyme and a unique number.
For example, M1 belongs to metallopeptidase family [19].
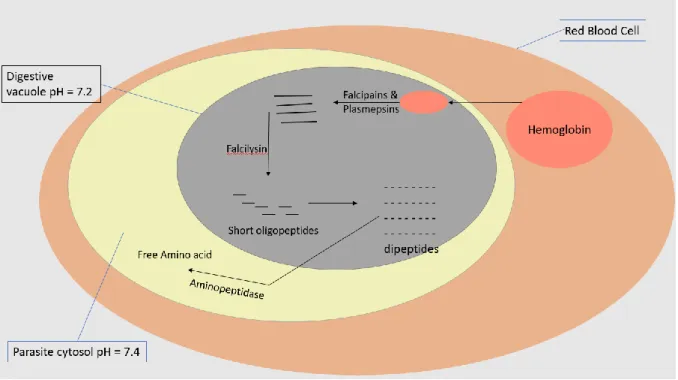
Malaria peptidases have two main functions. These are invasion and rupture of erythrocytes, and hemoglobin degradation. Hemoglobin degradation involves different proteases such as aspartic proteases, falcilysin, plasmepsins, cysteine proteases, metalloproteases, dipeptidyl aminopeptidase 1 (DPAP1) and falcipains [20].
The first cleavage occurs between Phe at position 33 and Leu at position 34. Then falcipains and plasmepsins degrade the resulting molecule into small peptides. The enzymes DPAP1 and falcilysin degrade the small peptides into shorter oligopeptides or dipeptides which are transported to the parasite cytosol where they will be degraded into free amino acids by neutral aminopeptidase [14]
1.4.1 Metallopeptidases
Metallopeptidases are a set of homologous peptidases which need metal a ion for their catalytic mechanism. This metal is usually Zinc (Zn2+), but could be Copper (Cu2+) or Cobalt (Co2+).
Usually, three amino acid coordinate the metal ion in its position in the protein [19]. As shown in Table 1-2 and 1-3, there are over 50 metallopeptidase families and subfamilies, making them the largest peptidase enzyme family. Based on the cleavage site metallopeptidase are classified as end-opeptidase EC 3.4.21-25 and exo-peptidase EC 3.4.11-19 [21].
1.4.2 Exo-aminopeptidases
Exo-aminopeptidases can eliminate amino acids from N-termini of peptides. In Plasmodium parasites, in addition to providing free amino acids, they also have a role in re-invasion of erythrocytes [22]. Plasmodium parasites use nine different exo-aminopeptidases. Four of these enzymes are methionine aminopeptidases. The other enzymes are alanyl aminopeptidase, aspartic aminopeptidase, leucine aminopeptidase, prolyl aminopeptidase and post prolyl aminopeptidase. Exo-aminopeptidases have different functions depending on the catalytic activity of the enzyme. For example, they have the activity to remove the N-terminal methionine, which is the activity of methionine aminopeptidases. On the other hand, alanyl aminopeptidase and leucine aminopeptidase can digest dipeptides into free amino acids, which is very important for the parasite to grow. Inhibition of these enzymes can thus stop protein biosynthesis and as a result, inhibit the Plasmodium parasite growth [14].
M1 Aminopeptidases (EC 3.4.11) are enzymes that catalyze peptide bonds between amino acids from the amino terminal of proteins or polypeptide chains. M1 Aminopeptidase belongs to the metzincins clan, which are zinc-dependent metallopeptidases [23]. There are more than 10000 protein sequences that belong to the M1 aminopeptidase family and 25 PDB structures.
M1 Alanyl aminopeptidase (EC 3.4.11.2) (PfM1-AAP) depend on single catalytic zinc ion, which is coordinated by two histidines and one glutamate. The optimum pH for the activity of this enzyme is 7.4. P. falciparum M1 Alanyl aminopeptidase has been detected in an asexual cycle of the erythrocyte stage during the trophozoite and schizont step, which makes it an ideal antimalarial drug target. There are some studies that have shown that Bestatin or quinolone- based inhibitors could be used to inhibit the activity of this enzyme. McGrown et al. [22] have reported the crystal structure of the empty form of this enzyme with PDB ID 3EBG [22].
A single gene encodes M1 Alanyl aminopeptidase which consists of 1095 amino acid arranged into 4 domains. These domains comprise the N-terminal, catalytic domain, middle domain and C-terminal domain. The enzyme shares ~70% identity across different Plasmodium species.
The active region of M1 Alanyl aminopeptidase is conserved and the most divergent region is located at the N-terminal extension. The 3D structure shows that it contains 26 α-helices and 26 β-sheets. Five β-sheets and eight α-helices form the catalytic domain. The active site is located between β-sheet number 18 and α-helices number 2, 3 and 5. Putative substrate entry could be used to access the active site [24].
Due to the similarity between M1 and M17 aminopeptidases, a drug can be designed to potentially target both enzymes. Drinkwater et al. [25] developed (1H-pyrazole-1- yl)phenyl)(amino)methyl) phosphonic acid which can bind within the S1 socket of the active site. However, the molecular dynamic (MD) simulation performed for this enzyme with the drug did not take into account the correct geometry of the metal active site [25].
Human aminopeptidase homologs play an important role after protein hydrolysis by gastric and pancreatic proteases, whereby they digest the generated peptides to release an N-terminal amino acid [26].
Figure 1-4: Hemoglobin digestion to release free amino acid in the erythrocyte stage during the sexual cycle of the Plasmodium parasite.
Table 1-2: Protease clans,families and sub-families, based on catalytic type (adapted from MEROPS) [19]
Catalytic type Clan Family Sub-family
Aspartic peptidases AA, AC, AD, AE and AF
A1, A2, A3, A5, A8, A9, A11, A22, A24, A25, A26, A28, A31, A32, A36 and A37
A1A, A1B, A2A, A2B, A2C, A2D, A3A, A3B, A11A, A11B, A22A, A22B, A24A, A28A and A28B
Cysteine peptidases CA, CD, CE, CF, CL, CM, CN, CO, CP and CQ
C1:C28, C30, C31, C32, C33, C36, C37, C40, C41, C42, C44, C45, C46, C47, C48, C50, C51, C53, C54, C56, C57, C58, C59, C60, C62:C80, C82, C83, C84, C85, C86, C87, C89, C93, C95, C96, C97, C98, C99, C100, C101, C102, C104, C105, C107, C108, C110, C111, C113, C115 and C117
C1A, C1B, C2A, C3A, C3B, C3C, C3D, C3E, C3F, C3G, C3H, C11A, C11B, C14A, C14B, C16A, C16B, C58A, C58B, C60A, C60B, C82A, C85A and C85B
Mixed peptidases PA, PB, PC, PD and PE
C3, C4, C24, C26, C30, C37, C46, C56, C62, C74, C99, C107, S1, S3, S6, S7, S29, S30, S31, S32, S39, S46, S55, S64, S65, S75, C44, P1 and P2
P2A and P2B
Serine peptidases SB, SC, SE, SF, SH, SJ, SK, SO, SP, SR, SS and ST
S8, S53, S9, S10, S15, S28, S33, S37, S11, S12, S13, S24, S26, S21, S73, S77, S78, S80, S16, S50, S69, S14, S41, S49, S74, S59, S60, S66, S54, S48, S62, S68, S71, S72, S79 and S81
S1A, S1B, S1C, S1D, S1E, S1F, S8A, S8B, S9A, S9B, S9C, S9D, S26A, S26B, S26C, S39A, S39B, S41A, S41B, S49A, S49B and S49C
Metallopeptidases MA, MC, MD ME, MF, MG, MH, MJ, MM, MN, MO, MP, MQ, MS and MT
M1:M13, M26, M27, M30, M32, M34, M35, M36, M41, M43, M48, M49, M54, M56, M57, M60, M61, M64, M66, M72, M76, M78, M80, M84, M85, M90, M91, M93, M95, M97, M98, M14, M86, M99, M15, M75 and M81
M3A, M3B, M9A, M9B, M10A, M10B, M10C, M12A, M12B, M14A, M14B, M14C, M14D, M15A, M15B, M15C, M15D, M16A, M16B, M16C, M20A, M20B, M20C, M20D, M20F, M23A, M23B, M24A, M24B, M28A, M28B and M28C.
Threonine peptidases T1, T2, T3, T5, T7, and T8 T1A and T1B
Peptidase of unknown catalytic type
U32, U40, U49, U56, U57, U62, U69, U72, U73 and U74
Table 1-3: Summary of MA metallopeptidase enzymes (adapted from MEROPS database )[19]
Clan Family Sub-family Example (Organism name)
MA M1 aminopeptidase N (Homo sapiens)
M2 angiotensin-converting enzyme peptidase unit 1 (Homo sapiens) M3 M3A thimet oligopeptidase (Rattus norvegicus)
M3B oligopeptidase F (Lactococcus lactis) M4 thermolysin (Bacillus thermoproteolyticus) M5 mycolysin (Streptomyces cacaoi)
M6 immune inhibitor A peptidase (Bacillus thuringiensis) M7 snapalysin (Streptomyces lividans)
M8 leishmanolysin (Leishmania major)
M9 M9A bacterial collagenase V (Vibrio alginolyticus) M9B bacterial collagenase H (Clostridium histolyticum) M10 M10A matrix metallopeptidase-1 (Homo sapiens)
M10B serralysin (Serratia marcescens) M10C fragilysin (Bacteroides fragilis)
M11 gametolysin (Chlamydomonas reinhardtii) M12 M12A astacin (Astacus astacus)
M12B adamalysin (Crotalus adamanteus) M13 neprilysin (Homo sapiens)
M26 IgA1-specific metallopeptidase (Streptococcus sanguinis) M27 tentoxilysin (Clostridium tetani)
M30 hyicolysin (Staphylococcus hyicus)
M32 carboxypeptidase Taq (Thermus aquaticus) M34 anthrax lethal factor (Bacillus anthracis) M35 deuterolysin (Aspergillus flavus)
M36 fungalysin (Aspergillus fumigatus) M41 FtsH peptidase (Escherichia coli) M43 M43A cytophagalysin (Cytophaga sp.)
M43B pappalysin-1 (Homo sapiens)
M49 dipeptidyl-peptidase III (Rattus norvegicus)
M54 archaelysin (Methanocaldococcus jannaschii) M56 BlaR1 peptidase (Staphylococcus aureus) M57 prtB g.p. (Myxococcus xanthus)
M60 enhancin (Lymantria dispar nucleopolyhedrovirus) M61 glycyl aminopeptidase (Sphingomonas capsulata) M64 IgA peptidase (Clostridium ramosum)
M66 StcE peptidase (Escherichia coli)
M72 peptidyl-Asp metallopeptidase (Pseudomonas aeruginosa) M76 Atp23 peptidase (Homo sapiens)
M78 ImmA peptidase (Bacillus subtilis)
M80 Wss1 peptidase (Saccharomyces cerevisiae) M84 MpriBi peptidase (Bacillus intermedius) M85 NleC peptidase (Escherichia coli) M90 MtfA peptidase (Escherichia coli) M91 NleD peptidase (Escherichia coli)
M93 BACCAC_01431 g.p. and similar (Bacteroides caccae) M95 selecase (Methanocaldococcus jannaschii)
1.5 Malaria diagnosis
It is important to diagnose malaria early to reduce the disease symptoms and prevent the complications which may lead to death. Different tools from different commercial kits are now available for accurate diagnosis of malaria in a short period of time. It is also important to identify the correct Plasmodium species as the choice of treatment options depends on the Plasmodium species [21].
Light microscopy could be used to diagnose malaria by obtaining well-stained thick and thin films, whereby the thick film is used to improve diagnosis sensitivity while the thin film is better for species identification. The sample should be prepared for examination with light microscope immediately after collection. This should be done to minimize deformation of parasite and erythrocytes [27].
Rapid diagnostic tests (RDTs) can be used to detect Plasmodium parasites by using monoclonal
microscopy diagnosis when high-quality microscope diagnosis cannot be done. The advantage of using RDTs includes simplicity, ease-of-understanding and interpretation; they do not require electricity and generate rapid results. Usually, it takes 15 minutes to get the result [28].
There are different Plasmodium parasite antigens available for use in RDTs, which include histidine-rich protein, parasite lactate dehydrogenase, and Plasmodium aldolase. Based on the antigen used, the RDTs can detect single species - usually P. falciparum or P. vivax. Other RDTs can detect all malaria parasites. Now in the market, there are more than 200 RDTs specific to malaria (the complete list of those RDTs can be found on http://www.who.int/malaria/news/2016/rdt-procurement-criteria/en/) [27].
The Polymerase chain reaction PCR has been used to detect Plasmodium species by targeting the 18s rRNA [27] and by using Nested PCR it is possible to distinguish between different Plasmodium species with high sensitivity and specificity [29].
It is recommended to use RDTs or PCR to diagnose malaria because the accuracy of diagnosis by microscopy depends on the level of the parasite in a blood sample. Moreover, now there is a wide range of commercially-available RDTs that offer higher accuracy and faster results, but they cannot detect how many parasites are in the host.
1.6 Malaria treatment
Antimalarial drugs have different goals, including (1) targeting the asexual cycle of the erythrocyte stage, (2) the prevention of recurrent infections and (3) the prevention of parasite transmission. The choice of a particular antimalarial drug is largely dependent on the Plasmodium species concerned. For example, P. vivax requires special treatment strategies because it can form dormant hypnozoites. Another factor to consider is the stage of infection - if it is complicated or severe, then a different treatment approach is required as opposed to early-diagnosed malaria. Hence no single drug can accomplish all goals while achieving antimalarial drug resistance. A solution is to use a combination of the different antimalarial drugs to achieve complete elimination of the Plasmodium parasite from the body. Drugs targeting the asexual cycle are called blood schizonticidal drugs, while those targeting the sexual cycle are called gametocytocidal [30].
There are three main groups of antimalarial drugs which include quinolines, antifolates, and artemisinin derivatives. Quinoline derivatives usually accumulate in the plasmodial digestive vacuole and prevent degradation of hemoglobin. Examples of quinoline derivative drugs
include chloroquine, quinine, mefloquine, and primaquine. The only drug that belongs to the quinoline derivatives but has a different mode of action is atovaquone, which interacts with the respiratory pathway of the parasite to inhibit parasite growth. Antifolate derivatives inhibit folate biosynthesis by different ways, including the inhibition of dihydropteroate synthetase or dihydrofolate reductase. Examples of antifolate derivative drugs are sulfadoxine and proguanil [31]. Artemisinin derivatives depend upon the production of carbon-centered free radicals.
Artemisinin is toxic to malaria parasites because it targets hemoglobin molecule [32]. In addition to the previous main three antimalarial drug categories, there are antibiotics and other new antimalarial drugs. These include for example clindamycin, which inhibits the protein synthetic pathway [33].
Due to increasing levels of malarial parasite resistance to sulfadoxine/pyrimethamine and chloroquine, a combination of different antimalarial drugs with different modes of action is currently used, however there is still a high need for new drugs with new targets. World Health Organization (WHO) recommends artemisinin combination therapies as treatment for chloroquine-resistant Plasmodium parasites and uncomplicated malaria. In the case of severe malaria the recommended treatment includes a combination of artesunate, artemether, and quinine [30].
1.7 Antimalarial drug resistance
Aminoquinoline chloroquine was one of the favorable antimalarial drugs due to its efficacy and low side effects. However, since 1957 the Plasmodium parasite has started to develop resistance to this drug, and now the resistance has reached so many areas in the world that chloroquine is only effective in Central America [34]. In South East-Asia P. falciparum has started to develop resistance to the last available treatment which is artemisinin [35]. Another antimalarial drug, amodiaquine, which was more efficient than chloroquine has been used as an alternative where the parasite has already developed resistance to chloroquine. However, the Plasmodium parasite has later developed resistance to this drug as reported in Tanzania and Africa [36]. Currently artesunate-mefloquine is used as first-line treatment. To decrease the chance of developing resistance to this drug, WHO recommends using this drug with a combination of any other drug having a different mode of action. However, the failure rate for this combination is less than 10%, which raises global health concerns because the Plasmodium parasite that develops resistance to this combination could lead to a global outbreak[34].
Most drug resistance comes from a genetic mutation. It begins with a genetic mutation that gives the parasite the ability to survive in the presence of the drug. Then the resistant parasite multiplies and grows to lead to a parasite population resistant to the drug. These genetic mutations could be single point mutations or occur most commonly as multiple mutations. A complication happens when cross-resistance occurs. Cross-resistance means that if the parasite becomes resistant to a specific drug, it also becomes resistant to all drugs of the same chemical family or to those having the same mode of action, for example resistance against both halofantrine and mefloquine. Another factor that can lead to drug resistance is the drug half- life. As its half-life increases, the chance of developing drug resistance increases as the parasite encounters lower concentrations that are not enough to kill them, thus giving time for drug resistance to develop [34].
There are several reported mutations associated with antimalarial drug resistance. For example, mutations in P. falciparum chloroquine resistance transporter (Pfcrt) have been associated with chloroquine resistance. The main mutation occurs in position 76 in which lysine changes to threonine; other mutations in the same protein include C72S, M74I, N75E, A220S, Q271E, N326S, I356T, and R371I. Those mutations are associated with the main mutation to give resistance to chloroquine [31].
1.8 Malaria vaccine
To control malaria, different vaccines have been developed to eliminate malaria and protect healthy humans. Based on the Plasmodium parasite life cycle stages, malaria vaccines can be divided into three main groups: pre-erythrocyte, erythrocyte, and other vaccines. In pre- erythrocytes, the goal is to prevent sporozoite from invading hepatocytes. This can be achieved with the help of both T-cells and the humoral response. Pre-erythrocyte vaccines target the circumsporozoite protein (CSP). The CSP antigen prevents sporozoites from invading hepatocytes. Due to its low immunogenicity, the vaccine RTS,S was developed. RTS,S was developed by PATH Malaria Vaccine Initiative (MVI) and GlaxoSmithKline (GSK) and is also commercially known as Mosquirix. RTS,S consists of hepatitis B surface antigen fused with CSP and a liposome-based adjuvant. RTS,S has reduced the number of infected children by almost 50% [37].
In the erythrocyte malaria vaccine, the goal is to prevent the merozoites from invading erythrocytes, and to prevent death and disease without complete prevention of infection. The targets are antigens expressed on the merozoites’ surface or on that of infected erythrocytes.
These include the merozoite surface protein, glutamate-rich proteins and the apical membrane antigen 1 [37], [38].
1.9 Problem statement and hypothesis
It is important to develop new antimalarial drugs for alternative malaria targets due to the declining efficacy of available antimalarial drugs, as well as the development of drug resistance. The erythrocyte stage is mainly responsible for the symptoms of malaria, and it is the main source of amino acids for the Plasmodium parasite. Therefore, the erythrocyte stage has become the most targeted stage for antimalarial drug design. During this stage, especially during the asexual cycle, Plasmodium parasites use different proteases to degrade erythrocyte hemoglobin. About 65% to 75% of erythrocyte hemoglobin is digested, which results in the release of free amino acids. These proteases include aspartic proteases, falcilysin, plasmepsins, cysteine proteases, metalloproteases, dipeptidyl aminopeptidase 1 (DPAP1), falcipains and exo-aminopeptidases. One of the exo-aminopeptidases used by Plasmodium parasite is M1 Alanyl aminopeptidase. M1 Alanyl aminopeptidase is a zinc-dependent protease involved in the terminal stage of hemoglobin degradation and in the release of amino acids.
Since the Plasmodium parasite cannot synthesize its own amino acids, inhibition of this enzyme has the potential to block Plasmodium parasite growth. M1 Alanyl aminopeptidase shares high sequence identity among different Plasmodium species, which makes it possible to use the same drug against different Plasmodium species.
1.10 Aim and objectives
The main aim of this study was to use structural bioinformatics tools to identify potential inhibitors against M1 alanyl aminopeptidase. To achieve this, homology modelling of P.
falciparum M1 alanyl aminopeptidase and its homologs from other Plasmodium species was performed. To identify potential inhibitors, compounds from the South African National Compounds Database (SANCDB) and selected compounds from the ZINC and PubChem databaseswere screened in silico against these proteins. . Finally, top selected ligands were evaluated to ensure they selectively bind to the M1 alanyl aminopeptidase from Plasmodium species.
Chapter 2 – Sequence Analysis
Plasmodium M1 alanyl aminopeptidase could be considered a possible drug target against malaria. M1 alanyl aminopeptidase is present in different species including Homo sapiens and plays an essential role in the degradation of peptides, resulting in the release of free amino acids. Due to the presence of a human homolog, we need to analyze Plasmodium M1 alanyl aminopeptidase as well in order to highlight the difference between them. This chapter focuses on the analysis of the H. sapiens M1 alanyl aminopeptidase and its homologs in Plasmodium species, including P. vivax, P. knowlesi, P. ovale, P. malriae, and P. falciparum. These analyses include motif analysis, multiple sequence alignment and phylogenetic tree generation. The purpose of these analyses is to identify sequence and structural differences between the Plasmodium M1 alanyl aminopeptidase and human homologs, which may help in improving the specificity of the identified compounds against the Plasmodium M1 alanyl aminopeptidase protein.
2.1 Introduction
Sequence analysis is important to understand sequence features, conserved regions, motifs associated with functions, homology, sequence diversity between similar sequences and is an important part of structural analysis. Sequence analysis entails various techniques, such as motif analysis, multiple sequence analysis and phylogenetic analysis.
2.1.1 Motif Analysis
Motifs are short sequences with conserved patterns among different homologous sequences and through the evolution. Sequence motifs vary from DNA to amino acid short sequences depending on the sequence. Sequence motif lengths range from 3 letters to 50 letters depends on the motif type [39]. Motifs can be an indicator of a protein binding site and interaction domains, such as restriction enzyme binding sites, or transcription factor binding sites, regulatory regions on DNA, termination sites or active sites. Motifs can fall into two categories:
they can be structural motifs or sequence motifs. A structural motif located in the exon region of a gene will also be in the encoded amino acid sequence [40], while a sequence motif would only be found in the intron region of a gene. All structural motifs are sequence motifs, but not all sequence motifs are structural motifs. Based on the toll used in motif analysis, motifs could be showed as sequence logo Figure 2-1. A sequence logo is a representation of a conserved region across analyzed sequences, in which the letter height corresponds to the amino acid conservation[40].
Figure 2-1: Example of a sequence logo. It shows the frequency of occurrence of each amino acid in the analyzed sequences on Y-axis against the amino acid letter, shown on the X-axis.
Currently, there are different motif analysis tools. Some are specialized in motif analysis only while others do additional sequence analysis. Examples include the Multiple Em for Motif Elicitation (MEME) [41] tool, the Regulatory Sequence Analysis Tools (RSAT) [42] and the Protein Family Database (Pfam) [43].
2.1.1.1 Multiple EM for Motif Elicitation suite
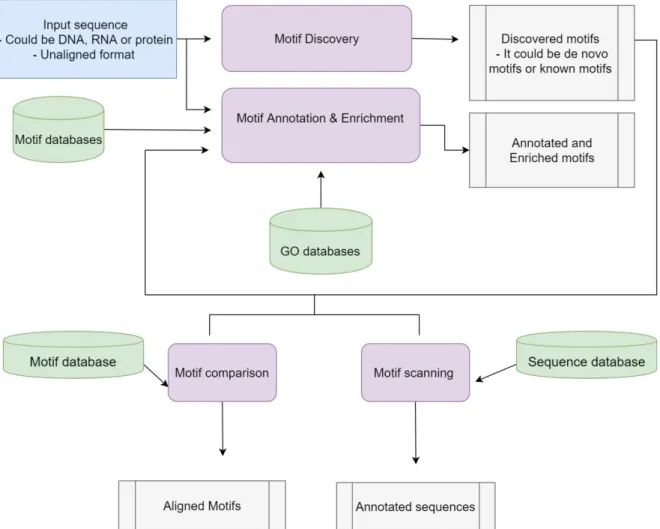
MEME is a toolkit that can be used either via its web server interface or by installing it locally for use as a command line tool. This software contains different tools covering different motif analysis types, including discovery and searching of motifs, comparing discovered motifs with known motifs and correlating previously known functions with discovered motifs [41].
For motif discovery, the user should input different sequences in unaligned (ungapped) format.
These sequences should share some sequence similarity, for example, all the sequences should be orthologous, or they could have similar domains. Then MEME searches for motifs using different algorithms including the expectation maximization algorithm, the maximum likelihood and greedy search [44].
The ideal input sequence length should be less than 1000 bp, which means it is inefficient at analyzing large data sets. Both repetitive DNA elements and low information segments should be eliminated before submitting the sequences to motif analysis. It is easier and better to carry out motif analysis with protein sequences than with DNA sequences. This is because the protein alphabet consists of 20 amino acids while the DNA alphabet consists of 4 nucleic acids, which gives more significant results for motifs discovered from proteins. The same criterion applies to protein sequences as it should be free from low complexity regions. The MEME guide suggests using the SEG program to remove low complexity regions from protein sequences and the RepeatMasker program with DNA sequences [44].
As some motifs may contain insertions and deletions, the MEME suite includes a gapped local alignment of motifs (GLAM2) tool to discover gapped motifs [45]. It is highly recommended
to do an ungapped motif analysis after a gapped motif analysis and compare the results to avoid false positives[41].
Depending on whether you are working with DNA or protein sequences, there are different ways to analyze the motif results, as shown in Figure 2-2. It includes comparing the resulting motifs against known ones, such as known regulatory motifs, identifying corresponding GO (Gene Ontology) annotations and identifying additional motif occurrence for the desired motifs. Unfortunately comparing the resulting motifs with known ones is available for DNA motifs only [46].
The MEME suite became online in 1996, and has now become an essential tool for motif analysis, offering 13 different tools with different features including motif discovery and enrichment, and database comparison [46].
Figure 2-2: Summary of the MEME suite features and a suggested workflow with the output of each analysis.
For motif discovery, there are four different algorithms. The first and oldest one is MEME, which performs basic motif discovery from both DNA and protein sequences. The MEME algorithm is limited by being poor at finding short DNA motifs. The second algorithm is
implemented by the discriminative regular expression motif elicitation (DREME) tool, which was developed to produce more sensitive motifs, especially in the case of short motifs, as opposed to MEME [47]. Both MEME and DREME cannot discover ungapped motifs; to overcome this limitation GLAM2 developed. The last tool, termedMEME-chip, was developed to overcome the length limitation as a means to discover motifs from whole genome sequences.
MEME, DREME and GLAM2 can only do motif discovery, while MEME-chip performs enrichment and comparative analyses as well as motif discovery, also giving a full report in comparison to the other tools [39].
2.1.1.2 Pfam
The first developed Pfam database was released in 1997 [48]. Currently, Pfam 31.0 was released on March 8, 2017, with 16712 protein families and 604 clans. Pfam is a multiple sequence alignment and a hidden Markov model representation of different protein families. It uses clans to organize its data, in which all related sequences are grouped as clans based on sequence similarity, sequence structure and profile. Pfam also takes advantage of protein domains in order to infer possible protein function. Initially a seed alignment is created for each protein family. This seed alignment used to train a hidden Markov model profile using the HMMER software. Clan quality heavily depends on seed quality. This model is then used to search against a large dataset to identify all possible homologous sequences [49]. Pfam can be used to identify the protein family of an input sequence by searching Pfam stored models, which help in identification of protein sequences and homologs sequences [50].
2.1.2 Sequence alignments
Sequence alignments are used to compare two or more nucleic acid or amino acid sequences to identify a conserved region in the sequences that may correspond to a function or an evolutionary relationship. Based on the number of aligned sequences, the alignment can be a pairwise alignment or a multiple sequence alignment [51]. Both approaches are performed using global alignment or local alignment. In global alignment, the aim is to create an end-to- -end alignment, which includes the entire length of the sequences being aligned. Local alignments, on the other hand, aim to identify the most similar regions between aligned sequences as shown in Figure 2-3.
Figure 2-3: Global and local alignment. It shows the difference between a global alignment and a local alignment. In a global alignment, the entire first sequence aligned with the entire second sequence (end-to-end alignment), while in local alignment only includes the most similar parts [52].
2.1.2.1 Pairwise sequence alignment
A fundamental objective of bioinformatic analysis is used to find the best match between two sequences. There are many different methods that have been developed to perform pairwise alignment. The most common methods consist of dot matrices, dynamic programming and the word method [53]. Dynamic programming is very accurate but requires high computational power because it calculates all possible alignments between the query sequence to choose the one with the highest alignment score. This approach is highly impractical for very large genomic sequences [54].
The pairwise alignment algorithm uses comparison matrices to evaluate the significance of any match or mismatch. These matrices define a score for every possible match; the algorithm uses these scores to find the best total score for the alignment between aligned sequences. In DNA or RNA sequence alignment, the most common scoring matrix is the identity matrix. For protein sequence alignment, the most common matrices are the point (or percent) accepted matrix (PAM) [55] and block substitution matrix (BLOSUM) [56]. The identity matrix is very simple - it gives a value of one for a positive match and zero for a mismatch. The simplicity of this matrix lowers the computational cost needed for alignment calculation while at the same time it does not provide weights for insertions and deletions for the aligned sequences [53].
PAM matrices measure the likelihood of a mutation that occurs between homologous sequences, in which one amino acid changes to another specific amino acid during evolution.
As a result, PAM matrices are based on the mutational model. BLOSUM matrices measure amino acid conservation and substitution probabilities in protein families (blocks) which are based on a starburst model. Therefore PAM matrices are very useful in evolutionary studies
while BLOSUM matrices are mainly used to find conserved domains. It is better to choose BLOSUM for local alignment [57].
2.1.2.2 Multiple sequence alignment (MSA)
A multiple sequence alignment (MSA) is an extension of pairwise alignments whereby three or more query sequences are aligned. An MSA is very important for evolution studies and phylogenetic tree construction. It improves the accuracy of the identified conserved residues and increases the ability to correctly identify insertions and deletions. MSA is important in many bioinformatics applications including secondary structure prediction, homology modelling, motif finding and phylogenetic analysis [54].
MSA is mainly performed using heuristic methods or exhaustive methods. The exhaustive methods like dynamic programming for MSA are highly impractical. Heuristic alignment methods have two common methods for MSA. These comprise the progressive alignment and iterative alignment Figure 2-4. Progressive alignments are usually fast but the accuracy is not guaranteed. In progressive alignment, errors that occur in any step of the algorithm are retained and carried over to the final step. The alignment starts by aligning the most similar sequences together, then the algorithm adds more sequences to this alignment until all query sequences are aligned [58]. The iterative method starts with a low-quality alignment then the algorithm iterates and improves the alignment until no improvement can be made to the alignment. The main idea of the iterative method is to continuously modify the alignment until an optimal alignment is produced [59].
Figure 2-4: Steps for the iterative alignment method [60].
2.1.2.3 Phylogenetic analysis
Phylogenetic analysis is the representation of the evolutionary relationship between various species in the form of a branched diagram. The possible evolutionary relationship are
tree could be a species tree or a gene tree. A species tree represents the evolutionary relationships between species or groups of the population while a gene tree measures the phylogenetic relationships between a group of homologous genes. Phylogenetic trees can be rooted or unrooted. A rooted phylogenetic tree is branched from a unique node that represents a common ancestor while in the unrooted tree there is no single common ancestor [62].
While a phylogenetic tree can be useful in understanding the history of evolutionary events, it can be biased if the input data is noisy or not accurate. Another limitation is using a small input set. For example, the construction of a species tree based on sequence similarity between conserved genes (ex: housekeeping genes) could be limited. This due to the fact that this tree is based on a single gene which may not reflect the complete organism genome [63]. The more genes used in the analysis, the more reliable the resulting phylogenetic tree. Using a small set of input genes results in a phylogenetic tree that requires further validation through techniques such as bootstrapping and the use of an outgroup [64]. An outgroup is group of distantly related sequences in a set of input genes. This outgroup acts as negative control which should appear near the root [64]. Bootstrapping includes pre-defined iterations meant to increase the confidence of the phylogenetic tree. In each iteration, the input MSA is randomly permuted then the phylogenetic tree is calculated. In the end, each branch of the final tree is labeled with a number. This number represents how many times the branch was recovered across all the iterations [65]. Different algorithms could be used to construct a phylogenetic tree. These include the Unweighted Pair Group Method with Arithmetic Mean (UPGMA), Neighbor- joining (NJ), Maximum parsimony (MP) and Maximum-likelihood (ML). UPGMA is based on a distance matrix calculated from an MSA and a constant evolution rate [66]. NJ is bottom- up clustering method suitable for large datasets since the algorithm is fast; however, accuracy is not guaranteed [66]. MP tries to produce a phylogenetic tree that minimizes the number of steps needed to reflect the variation between the sequences and the common ancestral sequence [67]. ML is based on a statistical approach and is very optimal for small input data of distantly- related sequences. However ML is not the best choice for large input data because it is computationally expensive [68].
2.2 Methods
2.2.1 Sequence retrieval
The M1 P. falciparum alanyl aminopeptidase sequence (accession number XP_001349846.1) was retrieved from the National Centre for Biotechnology Information (NCBI) using the NCBI global cross search tool. The retrieved sequence was submitted to pBLAST [69] (protein Basic Local Alignment Search Tool) to retrieve M1 alanyl aminopeptidase from other Plasmodium species including P.vivax, P. knowlesi, P. ovale, P. malriae, P. gaboni, P. reichenowi and P.
coatenyi (the accession number for each species is shown in Table 2-1) using default BLAST parameters and restricting the organism search to Plasmodium species. The Ensembl genome browser [70] was used to retrieve a human sequence of M1 alanyl aminopeptidase (accession number NP_001141.2). The Ensembl orthologs finder was used to retrieve mammalian homologs. Bacterial homologs of the M1 P. falciparum alanyl aminopeptidase sequence were retrieved from UniProtKB [71] using UniRef [72] data available from the M1 P. falciparum alanyl aminopeptidase record found in the UniProtKB. At the end, 18 sequence were retrieved (shown in Table 2-1)
2.2.2 Motif analysis 2.2.2.1 Pfam
In order to investigate the relationship between human protein and Plasmodium sp. Homologs, the HMMER tool [73] was used to search for protein families and domains in all retrieved
sequences. HMMER was accessed through
https://www.ebi.ac.uk/Tools/hmmer/search/hmmscan, and a FASTA-formatted file containing all the retrieved sequences was submitted to the HMMER tool using default parameters.
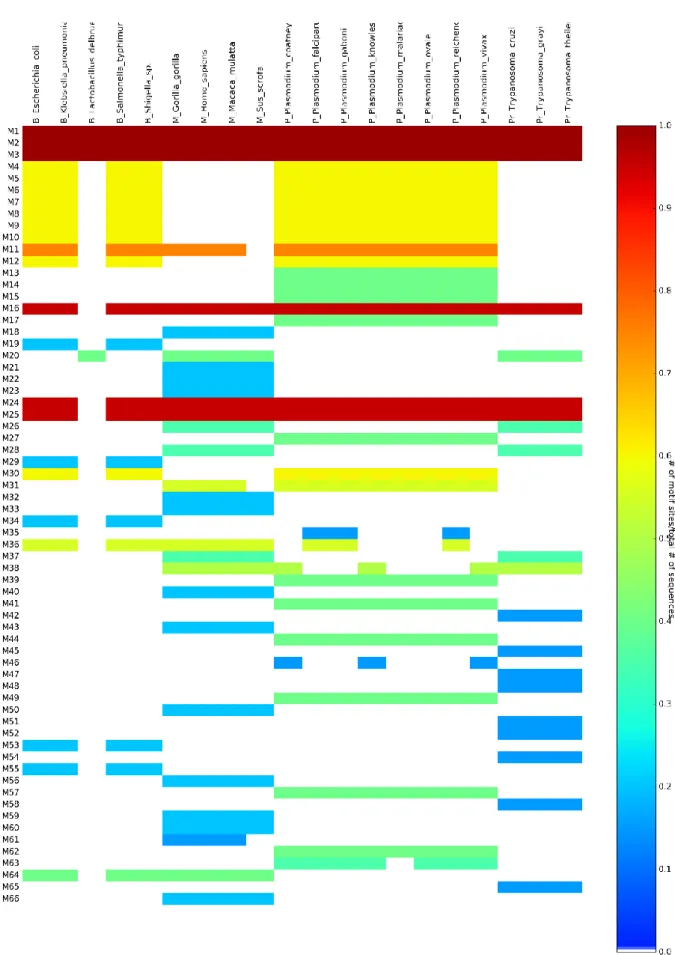
2.2.2.2 MEME suite
A locally-installed version of the MEME suite was used to discover motifs in all retrieved sequences. MEME version 4.12.0 was downloaded from the MEME official site and installed locally, after which a FASTA-formatted file containing all retrieved sequences was submitted to the MEME tool using default parameters. The generated files were submitted to the MAST tool [74]. The motif width was set to 6 as minimum and 50 as the maximum value. Moreover, repeated motifs were set to be skipped and 10000 was used as the maximum number of discovered motifs.
2.2.3 Sequence alignment
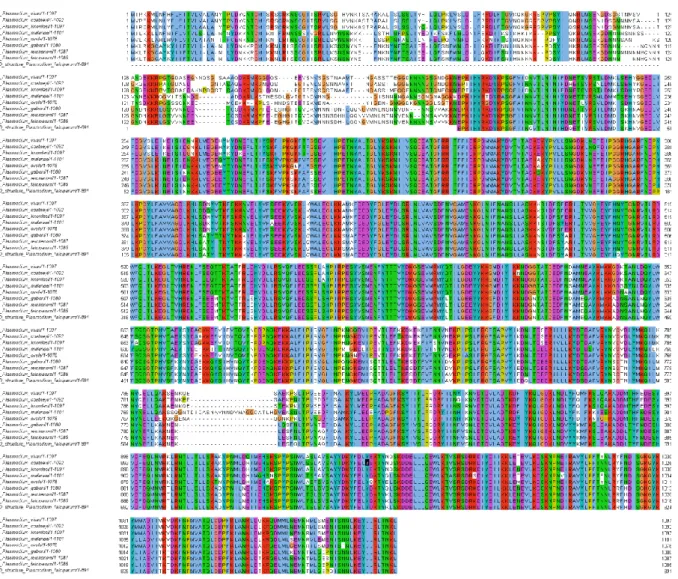
MSA was performed using MAFFT [75] for all retrieved sequences. MAFFT was accessed through the MAFFT online web server hosted on EBI servers https://www.ebi.ac.uk/Tools/msa/mafft/ and a FASTA file containing all sequences was submitted using MAFFT default parameters. A separate MSA for all Plasmodium species sequences was also created. Structural MSA was performed using T-Coffee expresso, which can be accessed through http://tcoffee.crg.cat/apps/tcoffee/do:expresso. A FASTA file containing all sequences and a 3D structure sequence of Plasmodium M1 alanyl aminopeptidase (PDB ID: 3Q43) were submitted using default parameters.
2.2.4 Phylogenetic analysis
MEGA 7 [76] was used to generate a phylogenetic tree representing the evolutionary relationships between Plasmodium sequences and their homologous sequences. The T-Coffee expresso alignment result was used as input to generate the phylogenetic tree using the Neighbor-joining algorithm. All gaps were eliminated and 1000 bootstrap iterations were used to increase the phylogenetic tree confidence. The evolutionary model was measured and selected based on the best BIC (Bayesian Information Criterion) score obtained using the MEGA goodness of fit test. The selected model was the “Le Gascuel” (LG) statistical model.
2.3 Result and Discussion
2.3.1 Sequence retrieval
Different Plasmodium species and homologs sequences were retrieved from different databases (NCBI, UniProtKB, and Ensembl). The retrieved sequences were confirmed using other databases, including PlasmoDB. The retrieved data was checked and compared against available data. All the retrieved sequences were submitted to BLAST to measure the percentage similarity between P. falciparum (XP_001349846) and all other retrieved sequences.
Table 2-1: Summary of M1 alanyl aminopeptidase P. falciparum sequence and its retrieved orthologs.
Name Length
(aa)
Accession number
Query Cover
Identity percentage
P. malariae 1100 SBS90191 100% 72%
Plasmodium gaboni 1080 XP_018639924.1 100% 97%
Plasmodium reichenowi 1087 CDO65912 100% 99%
P. knowlesi 1097 XP_002262014.1 99% 71%
P. ovale 1078 SBT47239 100% 73%
P.
![Table 1-1: Summary of needed time for complete maturation of gametocytes [15]](https://thumb-ap.123doks.com/thumbv2/pubpdfnet/12225580.0/19.892.113.788.732.921/table-summary-needed-time-complete-maturation-gametocytes-15.webp)
![Table 1-3: Summary of MA metallopeptidase enzymes (adapted from MEROPS database )[19]](https://thumb-ap.123doks.com/thumbv2/pubpdfnet/12225580.0/24.892.109.801.128.1141/table-summary-ma-metallopeptidase-enzymes-adapted-merops-database.webp)