Impact of p2/NC Cleavage Site Polymorphisms on HIV-1 Subtype C Viral Fitness
by
Serron Wilson
Submitted in fulfilment of the requirements for the degree of Master of Medical Science in Molecular Virology
School of Laboratory Medicine and Medical Sciences
University of KwaZulu Natal
2012
Preface
The experimental work described in this dissertation was carried out in the Hasso Plattner Research Laboratory of the HIV Pathogenesis Programme at the Doris Duke Medical Research Institute, Nelson R. Mandela School of Medicine, University of KwaZulu-Natal, Durban, from February 2010 to March 2012 under the supervision of Dr Michelle Lucille Gordon.
These studies represent original work by the author and have not otherwise been submitted in any form for any degree or diploma to any other University. Where use has been made of the work of others, it is duly acknowledged in the text.
Signed: __________________________________ Date: ______________________
Serron Wilson (Candidate)
Signed: __________________________________ Date: ______________________
Dr Michelle Lucille Gordon (Supervisor)
Plagiarism declaration:
I, Serron Wilson, declare that:
i. The research reported in this dissertation, except where otherwise indicated, is my original work.
ii. This dissertation has not been submitted for any degree or examination at any other university.
iii. This dissertation does not contain other persons’ data, pictures, graphs or other information, unless specifically acknowledged as being sourced from other persons.
iv. This dissertation does not contain other persons’ writing, unless specifically acknowledged as being sourced from other researchers. Where other written sources have been quoted, then:
a. their words have been re-written but the general information attributed to them has been referenced;
b. Where their exact words have been used, their writing has been placed inside quotation marks, and referenced.
v. Where I have reproduced a publication of which I am an author, co-author or editor, I have indicated in detail which part of the publication was actually written by myself alone and have fully referenced such publications.
vi. This dissertation does not contain text, graphics or tables copied and pasted from the Internet, unless specifically acknowledged, and the source being detailed in the dissertation and in the Reference sections.
Signed: __________________________________ Date: ______________________
Serron Wilson (Candidate)
Signed: __________________________________ Date: ______________________
Dr Michelle Lucille Gordon (Supervisor)
Ethical Approval
Full ethical approval, was obtained for this study from the Biomedical Research Ethics Committee of the Nelson R. Mandela School of Medicine, University of KwaZulu-Natal (ref: BF 068/08).
Presentations
Part of this work was presented as a poster at the 5th SA AIDS Conference, held in Durban, South Africa from the 7th-10th of June 2011. The poster was titled ‘3D modelling of HIV-1 subtype C Gag p2/NC cleavage site polymorphisms’.
This work was also presented at Keystone Symposia’s 2012 Meeting on HIV Vaccines, held in Keystone, Colorado, USA from the 21st-26th March, 2012. The poster was titled
‘Variation at p2/NC cleavage site has no effect on subtype C viral fitness’.
Acknowledgements
I would like to thank and acknowledge Dr Michelle Gordon for her contribution to this study, for her assistance in the conception and design of this project and the writing of this dissertation, none of which would have been possible without her.
I would like to thank Professor Thumbi Ndung’u for his wise advice, guidance and knowledge, which have been gratefully received.
I would like to thank Dr Julie Prado for her contribution to this work, specifically with regard to the western blotting assays.
I am extremely grateful to Dr Jaclyn Wright for her assistance in the technical matters of this project, specifically the replication capacity assays, and also for her contributions of plasmids, primers and numerous other materials used this study.
I would like to thank the HIV Pathogenesis Programme and the National Research Foundation for financial assistance.
My sincerest heartfelt gratitude goes to all my family.
Abstract
Subtype C accounts for the majority of HIV infections and in South Africa, is the dominant subtype. The Gag cleavage sites of subtype C viruses show a high degree of natural variation compared to subtype B and group M sequences, with the p2/NC site having the highest degree of variation among all cleavage sites and between all subtypes. This study therefore aimed to determine the functional effect of this variation on viral fitness. A library of drug naïve subtype C sequences were screened using computational analysis to predict binding affinity between HIV protease and the Gag substrate at the p2/NC site.
Ligands with high predicted affinity had hydrophobic cleavage sites with substantial diversity at positions P5-P3. Lower ranking ligands were mostly similar to the consensus subtype C. Three ligands were selected for fitness assays from each the high ranking and low ranking groups. Chimeric viruses expressing selected cleavage sites were generated by site directed mutagenesis. Replication capacity assays of these viruses showed moderate differences in fitness but failed to demonstrate a correlation with computational estimates of binding affinity. Enzymes assays were performed to further investigate substrate preferences and the binding mechanism of protease. To this end, recombinantly expressed HIV-1 protease was tested against a range of substrates the matching the p2/NC cleavage sites used in the replication capacity assay. Results of the enzyme assay did not correlate with either the computation studies or the replication capacity assay results, suggesting a sequence independent binding and recognition mechanism of HIV-1 protease. Taken together the results suggest that processing of Gag is determined by tertiary folding of the polyprotein and not amino acid sequence at the cleavage site.
Table of Contents
Preface i
Declaration ii
Ethical Approval iii
Presentations iii
Acknowledgements iv
Abstract v Table of Contents vi List of Figures x List of Tables xii
Abbreviations and Acronyms xiii CHAPTER 1: LITERATURE REVIEW 1.1 INTRODUCTION ... 1
1.1.1 History of HIV and AIDS ... 2
1.1.2 Current figures and statistics ... 2
1.2 HUMAN IMMUNODEFICIENCY VIRUS ... 4
1.2.1 Origin of the virus ... 4
1.2.2 Clinical course of infection ... 6
1.2.3 Genome arrangement ... 8
1.2.4 Physical structure ... 8
1.2.5 Life cycle ... 9
1.2.6 Proteolytic cleavage of HIV-1 Gag ...12
HIV Protease ...14
1.3 HIV DIVERSITY ...17
1.3.1 Strains, groups, subtypes, and circulation recombinant forms ...18
Geographical Distribution of Subtypes...19
1.3.2 Subtype C ...21
1.3.3 Variability in subtype C ...22
1.4 EFFECT OF VARIATION IN GAG ...23
1.4.1 Viral fitness ...23
Fitness assays ...25
1.4.2 Protease inhibitors ...28
Computational Methods ...29
1.5 PROJECT RATIONALE ...32
1.5.1 Aims and Objectives ...32
CHAPTER 2: COMPUTATIONAL STUDIES 2.1 INTRODUCTION ...34
2.1.1 Aims and objectives for computational studies ...36
2.2 METHODS AND MATERIALS ...36
2.2.1 Sequence data ...36
2.2.2 Generation of peptide ligand structures ...37
2.2.3 Protease structure ...37
2.2.4 Docking ...38
2.3 RESULTS ...39
2.3.1 Sequence Data Characteristics ...39
2.3.2 Docking ...42
2.3.2.1 Scoring results ...42
2.3.2.2 Peptide sequences patterns ...42
2.4 DISCUSSION ...44
CHAPTER 3: FITNESS ASSAYS 3.1 INTRODUCTION ...48
3.2 MATERIALS AND METHODS ...49
3.2.1 Site directed mutagenesis ...49
3.2.1.1 Primer design ...50
3.2.1.2 Mutagenesis reaction ...54
3.2.1.3 Transformation of the XL-Gold ultra-competent cells ...56
3.2.1.4 Screening of mutants ...56
3.2.2 Generation of chimeric viruses ...59
3.2.2.1 Gag-Protease amplification by PCR ...60
3.2.2.2 pNL4-3ΔGag-Pro plasmid digestion ...61
3.2.2.3 Co-transfection by electroporation...61
3.2.2.4 Flow Cytometry ...62
3.2.3 Viral Replication assay ...62
3.2.3.1 Infectivity calculations ...62
3.2.3.2 Replication Capacity Assay ...63
3.2.3.3 Analysis ...64
3.2.4 Western blotting cleavage assay ...64
3.2.4.1 Sample preparation ...64
3.2.4.2 Western Blotting ...65
3.2.4.3 Analysis of blots ...66
3.3 RESULTS ...66
3.3.1 Replication capacity of chimeric HIV variants ...66
3.3.2 Gag Cleavage ...69
3.4 DISCUSSION ...72
CHAPTER 4: ENZYME ASSAYS 4.1 INTRODUCTION ...76
4.2 MATERIALS AND METHODS ...77
4.2.1 Recombinant expression of HIV protease from SK254 TOPO clone ...77
4.2.1.1 Amplification of PR gene ...80
4.2.1.2 Cloning into pCR® TOPO 2.1 vector ...82
4.2.1.3 Subcloning into pMAL-p5x and -c5x ...84
4.2.1.4 Expression of PR ...86
4.2.2 Enzyme assay ...89
4.2.2.1 Oligonucleotide design ...91
4.2.2.2 Cloning Protease recognition sequence inserts into the pGloSensorTM-10F Linear vector ...93
4.2.2.3 Production of GloSensorTM [protease site] Protein by cell free transcription and translation ...95
4.2.2.4 Protease Digestion ...96
4.2.2.5 Luminescence detection ...97
4.2.2.6 Enzyme activity analysis ...98
4.3 RESULTS ...99
4.3.1. Expression of HIV Protease ...99
4.3.2 Enzyme assay ...99
4.4 DISCUSSION ... 102
CHAPTER 5: DISCUSSION AND CONCLUSIONS...104
Appendix A...106
Appendix B...107
REFERENCES ... 109
List of Figures
Figure 1.1 Global HIV prevalence and distribution...3
Figure 1.2 Phylogeny of the SIV and HIV env locus...6
Figure 1.3 Clinical course of HIV Infection...7
Figure 1.4 Genetic organisation of HIV-1...8
Figure 1.5 Physical structure of HIV Virion...9
Figure 1.6 Life cycle of Human immunodeficiency virus...11
Figure 1.7 Physical maturation of HIV virion...12
Figure 1.8 Gag and Gag-Pol polyprotein precursors...12
Figure 1.9 Order of Gag cleavage...14
Figure 1.10 Crystal structure of HIV-1 subtype C protease...16
Figure 1.11 Geographical distribution of HIV subtypes...19
Figure 2.1 Amino acid sequence alignment of 2R5Q protease used in docking experiments...38
Figure 3.1 Molecular features of SK254 TOPO clone...51
Figure 3.2 Replication kinetics of mutant viruses...68
Figure 3.3 Representative western blot analyses of cell lysates...70
Figure 3.4 Immunoblot analysis of p55/p24 viral protein ratio in CEM-GXR25 cell lysate...72
Figure 3.5 Structural comparison of amino acids arginine and lysine...74
Figure 4.1 Molecular features of pMAL-c5x and –p5x...78
Figure 4.2 Arrangements of primers used to amplify of HIV protease gene from SK254 TOPO...81
Figure 4.3 Modulation of firefly luciferase with polypeptide linker...90
Figure 4.4 pGloSensor™-10F linear vector map and sequence reference points...91 Figure 4.5 Immunoblot analysis of pMAL-c5x expression...99 Figure 4.6 Effect of PR activity on GloSensorTM Protein substrates...101
List of Tables
Table 1.1 Consensus sequences for 5 Gag cleavage sites of HIV-1 subtype C...16
Table 2.1 Countries of sequence origin...39
Table 2.2 Frequency of Subtype C p2/NC cleavage site sequences in Los Alamos public database, showing the 6 most common sequences...40
Table 2.3 Amino acid polymorphisms observed at Gag p2/NC cleavage site in HIV-1 subtype C...41
Table 2.4 Representative docking results for peptide ligands...43
Table 2.5 Amino acid peptide sequences of the p2/NC cleavage from representative sequences for top and bottom ranked ligand groups...44
Table 3.1 Mutagenesis strategy for generation of 6 mutant viruses...55
Table 3.2 Replication capacities and associated p2/NC amino acid sequences...68
Table 4.1 Statistical differences in fold difference between PR substrates...101
Abbreviations and Acronyms
CS - Cleavage site
DMSO - Dimethyl sulfoxide DNA - Deoxyribonucleic acid
DTT - Dithiothreitol
E. coil - Escherichia coli
EDTA - Ethylenediaminetetraacetic acid GFP - Green Fluorescent Protein gp120 - Glycoprotein 120
gp41 - Glycoprotein 41
HIV - Human Immunodeficiency Virus
IPTG - Isopropyl β-D-1-thiogalactopyranoside NDOH - National Department of Health
NFV – Nelfinavir
PBMC - Peripheral blood mononuclear cell PCR - Polymerase chain reaction
PI - Protease Inhibitor
PR - Protease
RNA - Ribonucleic Acid RNAse H - Ribonuclease H
RPM - Revolutions per minute
RT - Reverse Transcriptase
SDM - Site directed mutagenesis
SDS PAGE - Sodium dodecyl sulphate polyacrylamide gel electrophoresis
TBE - Tris-Borate-EDTA TBS - Tris Buffered Saline
UV - Ultraviolet
X-Gal - 5-bromo-4-chloro-3-indolyl-β-D-galactopyranoside
CHAPTER 1
LITERATURE REVIEW
1.1 INTRODUCTION
Acquired Immune Deficiency Syndrome (AIDS) is the defining public health crisis of our time. Since its discovery in the early 1980’s AIDS has contributed to the deaths of approximately 30 million people, with about 33.3 million people worldwide living with HIV (UNAIDS, 2011). The causative agent of AIDS, the Human Immunodeficiency Virus (HIV), is a retrovirus which is passed between individuals by sexual transmission and contaminated bodily fluids such as blood products. Currently, most infections are due to heterosexual transmission; however this varies with geographical location. The sharing of used needles between intravenous drug users (IDUs) is also a major source of transmission, especially in Eastern Europe and central Asia (Simon et al., 2006). While the disease was first identified in North America, today the vast majority of infections are found in sub-Saharan Africa, with approximately 22.5 million infected individuals (UNAIDS, 2011). This accounts for 68% of all infections worldwide. This places a heavy burden on some of the world’s weakest economies and health systems.
The development of antiretroviral (ARV) therapy to treat HIV/AIDS has been the only effective approach to HIV. ARV has been able to slow disease progression significantly and decrease associated morbidities and mortality (Simon et al., 2006). However, while all efforts are being made yet no cure or vaccine is available at present. This greatly hampers efforts to prevent the further spread of the disease
1.1.1 History of HIV and AIDS
A report published by the Atlanta based Centre for Disease Control (CDC) in 1981 described the incidence of rare opportunistic infections amongst a small number of homosexual men. The main symptom of the disease was a severely compromised immune system, leading to death from otherwise uncommon infections. Initially it was thought this disease was isolated to homosexuals. This was proven false when similar symptoms began to appear in non-homosexuals. High risk groups included intravenous drug users, haemophiliacs and Haitian immigrants (Goedert and Gallo, 1985).
In 1983 Dr Luc Montagnier and Dr Francois Barre-Sinoussi from the Pasteur Institute in France isolated a retrovirus which they suggested was the cause of AIDS. The virus was named lymphadenopathy-associated virus (LAV) (Barre-Sinoussi et al., 1983). Soon after, Dr Robert Gallo of the National Cancer Institute isolated a virus named HTLV-III (Gallo et al., 1984). It soon became apparent that LAV and HTLV-III were the same virus.
Therefore in 1986 the virus was renamed Human Immunodeficiency Virus (HIV) by the International Committee on Taxonomy of Viruses (Case, 1986). Evidence emerged over the course of the next few years to suggest transmission of the virus was due to sexual contact and contaminated blood products (Goedert and Gallo, 1985).
1.1.2 Current figures and statistics
In 2010 there was an estimated 34 million people in the world living with HIV, approximately 2.7 million new infections occurred and 1.8 million AIDS related deaths were reported (UNAIDS, 2011). Roughly a quarter of all new HIV-1 infections are found in individuals under 25 years old, with females having 3 to 6 times higher infection rates than males in the same age group (Simon et al., 2006). Approximately 85% of HIV-1 infections
are as a result of heterosexual transmission, however, outside sub-saharan Africa, an estimated third of all infections are a result of injecting drug use, most of which are in eastern Europe and central and southeast Asia (Simon et al., 2006, WHO, 2009).
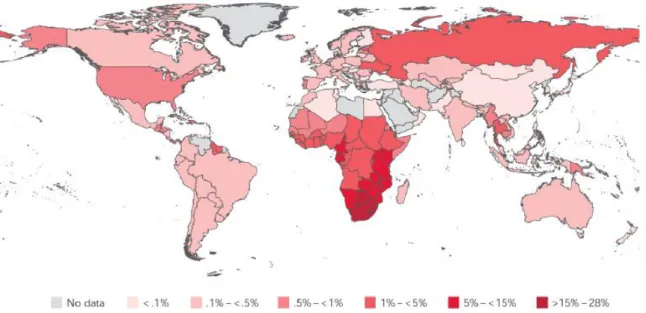
There is a disproportionately high HIV burden in developing nations, such as South American and African countries, India and other eastern nations. First world countries such as the USA, the United Kingdom and other European nations have much lower HIV incidence. Global distribution of HIV infection at the end of 2009 can be seen in Figure 1.1 (UNAIDS, 2011).
Figure 1.1 Global HIV prevalence and distribution. Sub-Saharan Africa reports the highest prevalence of infected individuals. The adult population of South Africa (15-49 years of age) has between 15 -28% prevalence rate. Taken from WHO/UNAIDS 2010 Global report (2011).
The HIV burden is greatest in the southern regions of Africa, with South Africa having the highest prevalence in the world. Current estimates are that 5.5 million people in South
Africa are living with HIV (NDOH, 2012), which equates to roughly 11% of the population.
Since 2004 the government of South Africa has employed a policy of free HIV treatment for those who meet the criteria (NDOH, 2004), which has substantially decreased mortality and morbidity associated with the disease. Consequently, the health care system and the economy of South African have been placed under an intense burden.
ARV therapy for such large numbers is enormously expensive thus is not the ideal solution. In 2011 the Global Fund spent US$ 1.9 billion supporting 3.5 million patients on ARV therapy in low and middle income countries (Stover et al., 2011). Due to an ever increasing number of HIV infections, this cost will grow substantially; and as such the prevention of new infections is of the utmost importance. However, despite well established and effective methods of HIV prevention, new infections have not substantially reduced (UNAIDS, 2011). For these reasons, the ideal strategy to tackle this disease is the development of a safe and effective vaccine. However, attempts to design such a vaccine have been not yet been successful
1.2 HUMAN IMMUNODEFICIENCY VIRUS
1.2.1 Origin of the virus
HIV is from the Lentivirus genus of the Retroviridae family. It is believed to have originated from simian immunodeficiency virus (SIV) during a cross-species transmission event in West Africa early in the 20th century (Hemelaar et al., 2011). SIV is a family of over 40 lentiviruses with high sequence homology to HIV and can infect a range of non-human primates, including the African green monkeys, mandrills, sooty mangabeys, red-capped mangabeys, and numerous others (Silvestri et al., 2007). Non-natural hosts of SIV (i.e.
those infected via a cross-species transmission events) include the rhesus macaque, pig-
tailed macaques and chimpanzees (Pandrea and Apetrei, 2010). Natural hosts experience a non-pathogenic, non-progressive infection. In contrast, infection of non-natural hosts results in disease outcomes similar to HIV infection in humans (Clements and Zink, 1996).
Transmission from primates to humans is thought to have occurred through the hunting and butchering of infected primates (Hemelaar, 2011). This is common practice in certain parts of Africa has to date permitted transmission of at least 2 other simian viruses to human hosts, namely the foamy virus and Primate /Human T-lymphotropic virus, making transmission of SIV to humans via this mechanism quite probable (McCutchan, 2006).
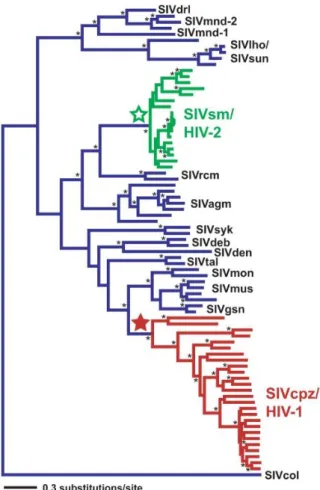
Multiple transmission events have occurred, each with different outcomes and each giving rise to different strains of HIV (VandeWoude and Apetrei, 2006). The virus which infects the common chimpanzee, SIVcpz, is considered the origin of HIV-1 and while HIV-2 is thought to have originated from SIVsmm, which infects the sooty mangabeys (McCutchan, 2006, Silvestri et al., 2007). The phylogenetic relationship between SIV and HIV can be seen in Figure 1.2.
Figure 1.2 Phylogeny of the SIV and HIV env locus. Green indicates lineages SIVsm/HIV-2 lineages and red indicates SIVcpz/HIV-1 lineages. Stars represent most recent common ancestor.
All other SIV lineages are blue. Taken from Wertheim and Worobey (2009).
1.2.2 Clinical course of infection
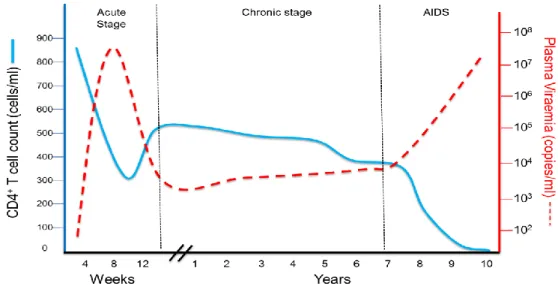
Primary HIV infection, also known as the acute phase of infection, lasts roughly 2- 4 weeks (Pope and Haase, 2003). During this phase rapid uncontrolled viral replication results in very high plasma viral load, in the range of 107 – 108 RNA copies per ml of plasma, and is accompanied by an initial loss of CD4+ T cells in the peripheral blood and a mass depletion of CD4+ T cells in the gut-associated lymphoid tissue (GALT) (Simon et al., 2006).
Usually, after about 4 weeks of infection, cellular immune responses to HIV are generated and are partially able to control the viral replication (Pope and Haase, 2003). This results in a rise of the CD4+ T cell count accompanied by a reduction of plasma viral load. The viral ‘set point’ is classified as the level at which the viral load stabilises. Set points vary greatly among different individuals and are predictive of disease progression (Dykes and Demeter, 2007).This period is known as the chronic phase and may last several years, especially if the infected individual is on ARV therapy.
Therapy is able to reduce the viral load to undetectable levels (below 50 copies per mL plasma) and rescue the CD4+ T cell plasma count. However despite years of therapy, CD4+ cell levels in the GALT never recover (Simon et al., 2006). A gradual increase of plasma viral load together with decline in CD4+ T cell count is inevitable resulting in the final stage of the disease, AIDS (Figure 1.3).
Figure 1.3 Clinical course of HIV Infection. Blue line = CD4+ T cell count, dotted red line = viral load. During acute infection plasma viral load rises sharply while CD4+ T cell count drops. During chronic infection, plasma viral load drops and peripheral blood CD4+ T cells rise. The final stage of the disease, AIDS, control of viral load is lost and CD4+ T cell counts fall sharply. Adapted from Simon et al (2006).
1.2.3 Genome arrangement
HIV is expressed as 9 genes, flanked by 5’ and 3’ long terminal repeats (LTR) (Figure 1.4). All known lentiviruses are exogenous and contain gag, pol and env as the structural and enzymatic genes. Between lentiviruses the number of accessory genes can vary, but vif (virus infectivity factor) and rev (regulator of virus gene expression) are constant inclusions in the lentiviral genome (VandeWoude and Apetrei, 2006). Addition accessory genes in HIV are vpr, vpu, tat, and nef. The main structural proteins capsid, matrix and nucleocapsid are encoded in the gag gene. The enzymatic components of the virus such as reverse transcriptase, integrase and protease are expressed in the pol gene, while the env gene codes for the surface envelope glycoprotein. Regulatory genes rev and tat control transcription and translation of viral genes and RNA transport. Production of infectious virus particles is regulated by vif and vpu, while vpr and nef are involved in disease manifestations (Clements and Zink, 1996).
Figure 1.4 Genetic organisation of HIV-1. Long terminal repeats (LTR) flank the 9 HIV genes at both the 5’ and 3‘ ends. Gag, pol and env are the main structural genes. Accessory genes rev and tat regulate transcription and translation. Vpu and vif ensure virion production while nef and vpr are involved in disease manifestation. Taken from Wensing et al (2010).
1.2.4 Physical structure
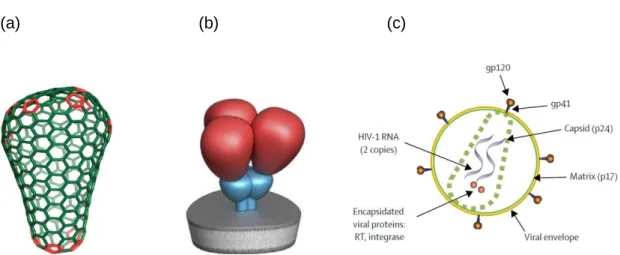
Retroviruses are unique among virus families as they possess a diploid RNA genome (Kieken et al., 2002). This RNA is found inside the conical core of the virion (Figure 1.5a).
The core is composed of the Gag proteins p24 (capsid), p17 (matrix), and p7 (nucleocapsid). The 55kDa (or p55) Gag polyprotein is processed via cleavage to form these products. The viral core is surrounded by a viral envelope which is derived from the host cell membrane. On the surface of the virion is the highly glycosylated envelope spike.
Three heterodimers composed of the trans-membrane gp41 glycoprotein and the surface glycoprotein gp120 make up the envelope molecule (Figure 1.5b) (White et al., 2011). The envelope glycoprotein interacts with receptors on the surface of the host cell, allowing viral entry. The CD4 cell surface marker is the main target of the envelope glycoprotein, with the chemokine receptors CCR5 or CXCR4 acting as co-receptors. Cells not expressing the CD4 receptor cannot be infected by the virus. The mature virus particle is approximately 100 nm in diameter (Clements and Zink, 1996).
(a) (b) (c)
Figure 1.5 Physical structure of HIV Virion (a). Conical nature of virion core, taken from Ganser- Pornillos et al. (2008). (b) Schematic view of trimeric HIV envelope glycoprotein, taken from White et al. (2011). (c) diagrammatic view of single HIV virion, taken from Simon et al (2006) .
1.2.5 Life cycle
The HIV life cycle (Figure 1.6) begins with the binding of the envelope glycoprotein to the primary receptor, the CD4 molecule on the surface of the host cell. This molecule is found
on cells of the immune system, such as helper T cells, monocytes/macrophages and dendritic cells, to name a few. Binding of the envelope spike to the CD4 receptor triggers a conformational change in gp120, exposing the co-receptor binding site in the glycoprotein. The cell surface co-receptors used by the virus may be either CCR5 or CXCR4, both members of the chemokine receptor family. The CCR5 receptor is found on macrophages and dendritic cells, and CXCR4 is found on T cells. Depending on the co- receptor usage, the virus stain is known as either M-tropic or T-tropic.
Binding of the envelope glycoprotein to the co-receptor is followed by fusion of the viral and host cell membrane. The viral core enters the cytoplasm and uncoats, releasing the diploid viral RNA genome. The virion associated reverse transcriptase begins transcribing the viral RNA into double stranded complementary DNA (cDNA). The cDNA is then transported to the nucleus where it is integrated into the host genome by HIV integrase.
Genomic (unspliced) and messenger (spliced) RNA is generated by transcription of this cDNA. The mRNA is transported to the cytoplasm where translation of the viral proteins occurs. The gag and pol genes are translated as immature poly-protein precursors, which require further processing. The gag gene is expressed as Gag (p55). A (-1) ribosomal frame shift mechanism occurs near the C terminus of the gag gene causing pol to be expressed as a GagPol ‘fusion’ protein (Pettit et al., 1994, Clements and Zink, 1996).
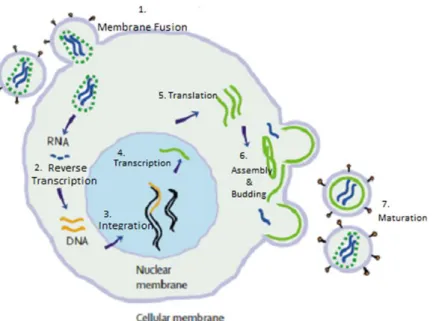
Figure 1.6 Life cycle of Human immunodeficiency virus. (1) Envelope surface glycoprotein binds to the CD4 host cell receptor. Virus and host membrane fuse, the viral genome and enzymes enter the cell. (2) Viral RNA is transcribed into DNA by HIV Reverse Transcriptase. (3) This is integrated into the host genome by HIV Integrase. (4 & 5) The viral genes are transcribed and translated by the host cell machinery. (6) Viral proteins accumulate at the cell surface, where assembly begins and immature virions bud off. (7) Maturation occurs when HIV Protease processes the Gag polyprotein precursor into its functional forms. Adapted from Simon et al (2006).
The Gag and Gag-Pol gene products collect at the cell surface, where viral assembling begins and immature virus particles bud off from the infected cell. The immature virion is essentially a layer of unprocessed Gag molecules coating the inside of the virion membrane. These particles are not infectious until the characteristic viral core has formed (Figure 1.7). This is mediated by the HIV aspartyl protease, which cleaves the Gag and Gag-Pol precursors into their functional forms (Monini et al., 2004).
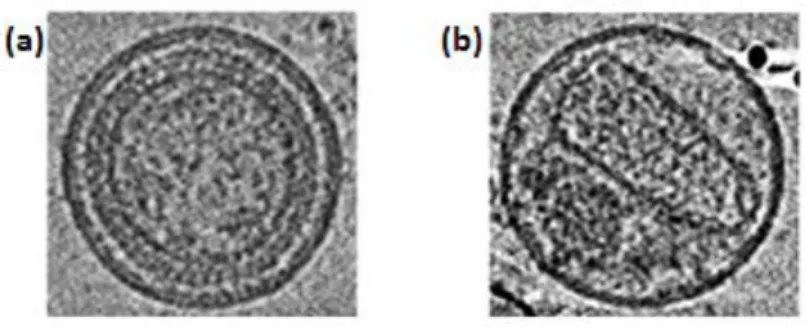
Figure 1.7 Physical maturation of HIV virion. Post budding processing of the Gag polyprotein precursor by HIV Protease induces an irreversible conformation change resulting in a morphologically distinct fully mature infectious virion. (a) The immature virion before cleavage by PR. (b) The mature virion post cleavage .Taken from (Ganser-Pornillos et al., 2008).
1.2.6 Proteolytic cleavage of HIV-1 Gag
Gag and Gag-Pol are cleaved in a strictly sequential manner at well-defined sites by the viral protease. Processing of the Gag-Pol precursor yields the enzymes of the virus, namely HIV protease (PR), reverse transcriptase (RT) and integrase, as well as the Gag structural proteins (Pettit et al., 1994). The Gag precursor (p55) is cleaved by PR into 6 peptides, namely matrix (MA or p17), capsid (CA or p24), nucleocapsid (NC or p7), and three smaller peptides, p6, p1 and p2 (Figure 1.8) (Holguin et al., 2005, Ganser-Pornillos et al., 2008).
(a) (b)
Figure 1.8 Gag and Gag-Pol polyprotein precursors. (a) The Gag polypeptide precursor, comprising of matrix (MA), capsid (CA), p2, nucleocapsid (NC), p1 and p6. (b) The Gag-Pol polyprotein, comprising of Gag proteins plus transframe protein (TFP), protease (PR), reverse transcriptase (RTp51), RNase H (RTp66) and integrase. Translation of Gag-Pol occurs as a function of a (-1) frame shift mechanism at the C term of Gag. Taken from (Wensing et al., 2010).
MA forms the inner layer of the virus, between the plasma layer derived from the host cell and the capsid of viral material. CA protein forms the conical capsid which contains the genetic material and enzymes. This structure is the portion of the virus which is injected into the host cell upon infection (Ganser-Pornillos et al., 2008). NC associates with the viral RNA inside the capsid. This protein is responsible for the recognition and binding of RNA. Its chemical composition is generally basic and highly conserved. NC also has a characteristic Zinc Finger motif, and acts largely as a facilitator of RT and integrase function (Ho et al., 2008, Thomas and Gorelick, 2008). The small peptides p2, p1 and p6, all co-ordinate membrane binding and Gag-Gag lattice formation.
There are three stages of cleavage during Gag processing. First, the site between the p2 and NC peptides (p2/NC) is cleaved. This is followed by essentially simultaneous cleavage at the MA/CA and p1/p6 site. The final step in processing of Gag is the removal of the small spacer peptides p2 and p1 from CA and NC, respectively (De Oliveira et al., 2003) (Figure 1.9). This final step has the slowest rate and hence is known as the rate determining step. The highest cleavage rate is at the p2/NC cleavage site (Wensing et al., 2010).
In addition to the 5 site in Gag, PR also has to cleave at 6 sites in Gag-Pol and 1 in Nef, giving a total of 12 sites. These sites show very little sequence homology, hence there is a great deal of uncertainty regarding the mechanism by which PR recognises the cleavage sites. Pettit and colleagues (1994) suggested three possible factors which may determine the order of cleavage of the precursor: (1) amino acid sequence (2) three dimensional shape of the peptide at the cleavage site or (3) the accessibility of the cleavage site to protease.
Figure 1.9 Order of Gag cleavage. The first site of cleavage in Gag is between p2 and NC. This is followed by cleavage at the MA/CA site and the p1/p6 site. The final cleavage step is the removal of the small spacer peptides p2 from CA and p1 from NC.
While amino acid sequence is considered to play a role in determining proteolytic cleavage, due to the limited cleavage site sequence identity between PR substrates this seems unlikely to be the case for Gag cleavage. A few studies suggest that the 3 dimensional shape of the site determines cleavage (Nalam et al., 2010, Özen et al., 2012). Other studies have found the accessibility of the cleavage site to protease plays the more significant role in determining the location and succession of cleavage (Perez et al., 2010).
HIV Protease
PR is a member of the aspartic protease family. This enzyme is a symmetrical homodimer consisting of 2 identical subunits of 99 amino acids. Each subunit contributes one aspartic acid residue to the active site, which is found at the dimer interface, at the centre of the
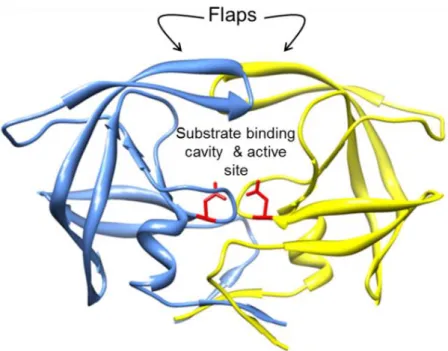
enzyme. The catalytic triad of the enzyme consists of the residues Asp-Thr-Gly, conserved across all aspartic proteases (Brik and Wong, 2002), indicating a conserved mechanism for this group of proteases. Pepstatin is a natural inhibitor which selectively inhibits aspartic proteases; and is able to inhibit PR. Each subunit contains an extended beta sheet glycine rich loop, known as the flap (Figure 1.10), which constitutes part of the substrate binding cavity. During substrate binding the flaps open slightly to allow the substrate into the active site region and subsequently close, tightening around the substrate (Pietrucci et al., 2009). The substrate is held in the cavity through hydrogen bonding and Van der Wals interactions (Perez et al., 2010).
The physical parameters and governing principles which control cleavage site specificity are poorly understood. In total there are 5 cleavage sites in Gag (Table 1.1). These sites share little sequence similarity and are seemingly unrelated but are cleaved with high fidelity with regard to location and sequence of cleavage. Despite the fact that the enzyme is symmetrical, the substrates it recognises are asymmetrical around the position of cleavage both in terms of the size and charge of the residues (Prabu-Jeyabalan et al., 2002).
Figure 1.10 Crystal structure of HIV-1 subtype C protease (protein database ID: 2R5Q).
Domain A = blue, domain b = yellow, active sites aspartic acid residues are coloured in red and rendered as sticks. Molecular graphics generated with the UCSF Chimera package (http://www.cgl.ucsf.edu/chimera) (Pettersen et al., 2004).
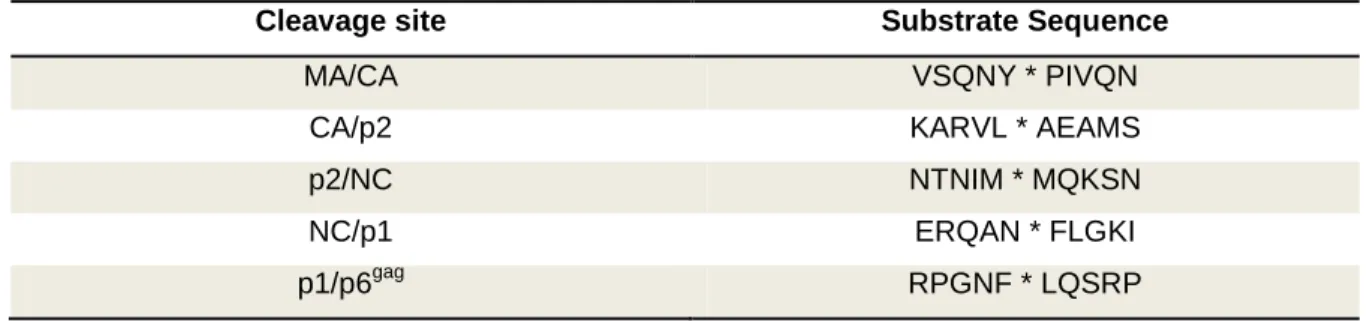
Table 1.1 Consensus sequences for 5 Gag cleavage sites of HIV-1 subtype C.
Cleavage site Substrate Sequence
MA/CA VSQNY * PIVQN
CA/p2 KARVL * AEAMS
p2/NC NTNIM * MQKSN
NC/p1 ERQAN * FLGKI
p1/p6gag RPGNF * LQSRP
* denotes precise position of cleavage. Adapted from De Oliveira et al (2003).
Given that PR activity is essential for the production of infectious virions and continued replication, this enzyme is a prime target for therapy. Protease inhibitors have proven an effective method of treatment, yet resistance to these drugs may arise rapidly (Wensing et
al., 2010). This is in part due to the high viral replication rate and error prone nature of RT.
These characteristics of HIV also prevent the development of an effective vaccine and are one of the main causes of extensive HIV diversity.
1.3 HIV DIVERSITY
HIV is characterised by extensive sequence diversity. Since the cross-species transmission events, HIV has diversified in the human population resulting in significant divergence among HIV strains (Wertheim and Worobey, 2009). Multiple cross-species transmission events are however only responsible for a small degree of the HIV diversity since these transmission events have been rare despite frequent contact between humans and SIV infected monkeys. Of 10 documented cases, only one has given rise to the current pandemic seen today (VandeWoude and Apetrei, 2006).
In an infected individual the virus exists as a swarm of related but non-identical variants.
The group of viruses is known as the ‘quasi-species’. Up to 10% viral diversity can exist in this quasi-species. Within a particular subtype 20% difference can occur. Roughly 25%
difference in amino acid sequence of the envelope protein exists between the various subtypes of group M (Perrin et al., 2003).
Three main factors are responsible for the extensive HIV diversity; firstly, the replication rate of the virus is exceptionally high; up to 1010 virions may be produced daily in an infected individual. Second, reverse transcriptase is highly error prone, incorporating about one error per genome per replication round. Lastly, recombination occurs at a frequency of 7 to 30 cross-over events per replication round and is a major force behind
diversity (McCutchan, 2006). Host immune pressure and antiretroviral drugs also contribute to viral diversity (Perrin et al., 2003).
1.3.1 Strains, groups, subtypes, and circulation recombinant forms
There are many different strains of HIV. The first distinction is between HIV-1 and HIV-2, each from a separate cross species transmission event from primates to humans. These two strains are genetically distinct and have largely differing disease outcomes. HIV-2 is localised to West Africa (the Democratic Republic of Congo) and has not spread much outside this region. This strain appears to have a lower transmission capacity and is less pathogenic than HIV-1 (McCutchan, 2006). Two groups of HIV-2 exist – groups A and B, supposedly each from a different transmission event. HIV-1 is pathogenic and found on every continent. This strain can be further classified into three groups; group M (for Main), group N (for Non-M group) and group O (for Outliers). The current pandemic is caused by group M viruses. Group N and O infections have a reduced pathogenesis compared to group M viruses. Group O is rare and accounts for a very small portion of infections in Cameroon, appearing infrequently beyond the borders. Only a very small number of group N infections have been identified (McCutchan, 2006).
Group M viruses can be further divided into 9 subtypes (or clades); A- D, F-H, J and K.
Circulating recombinant forms (CRF) develop as a results of recombination of two different strains within one infected individual (Perrin et al., 2003). CRF01_AE is an example of a recombinant between subtypes A and E. Subtypes tend to be geographically oriented (Figure 1.11). In the USA 96% of infections are subtype B infections while in South Africa 98% of infections are subtype C (Hemelaar et al., 2011).
Most strains, subtypes and CRFs are present in central Africa, while on other continents there are generally only one or two predominant subtypes. This lends support to the hypothesis that HIV first arouse in Africa and was subsequently spread to other continents by a few individuals (Perrin et al., 2003).
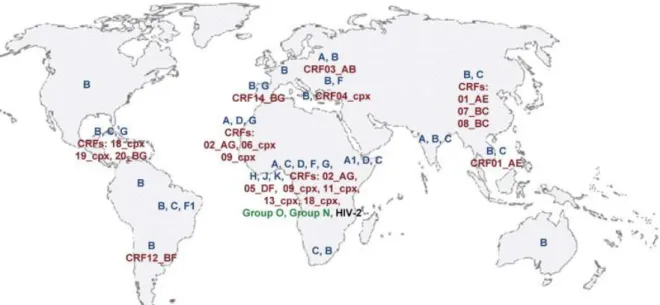
Figure 1.11 Geographical distribution of HIV subtypes. Most strains, subtypes and circulating recombinant forms (CRF) are found in central Africa, the geographic origin of the disease. Subtype B is widespread but subtype C is responsible for the highest total number of infections. Key: Blue=
subtypes of group M. Red= Circulation recombinant forms (CRFs), cpx = complex CRF of more than 2 subtypes. Taken from Ramirez et al (2008).
Geographical Distribution of Subtypes
Subtype A is found mainly in East Africa and former Soviet Republics. This is the second most common subtype, accounting for 12 % of infections globally (McCutchan, 2006, Hemelaar et al., 2006, WHO, 2009). Subtype B is widespread but dominates in Australia, Western Europe and North America and accounts for approximately 11% of infections worldwide (Holguín et al., 2006). This clade is also found in other locations but generally is present as a minority. Subtype C is the dominant HIV subtype in the world, accounting for about 48% of all infections with especially high incidence rates in Southern African and
India (McCutchan, 2006, Hemelaar et al., 2006, WHO, 2009, Walter et al., 2009, Lihana et al., 2012). Subtype D is concentrated in East Africa and accounts for only 2% of infections worldwide (McCutchan, 2006, Hemelaar et al., 2006). Subtype E exists only as part of CRF01_AE. Most likely the original subtype E was present early in the epidemic. A recombination event then occurred with subtype A forming CRF01_AE. Subtype E subsequently became extinct. A pure strain E has not been isolated. Subtype F is found mainly in South America (Brazil) and also central Africa (Ramirez et al., 2008). Subtype G accounts for 5% of infections and is found in Nigeria (Charurat et al., 2012). Subtypes H, J and K are found almost exclusively in west and central Africa (Hemelaar et al., 2011).
Together with subtype F, these subtypes account for less than 1 % of infections (Hemelaar et al., 2006). Circulating recombinant forms account for about 20% of infections (Hemelaar et al., 2006). In South-East Asia CRF01_AE is the major strain (McCutchan, 2006, Bandaranayake et al., 2010). This strain is mostly subtype A with a subtype E envelope sequence. CRF02_AG accounts for 8 % of infections worldwide and is found in West Africa (McCutchan, 2006, WHO, 2009, Esbjornsson et al., 2011, Charurat et al., 2012).
There are several proposed reasons for the unequal distribution of subtypes. These include social behaviour and genetic factors of the affected population. For example, immune responses are related to Human Leukocyte Antigen (HLA), which is the most polymorphic of all human genes and varies across populations (McCutchan, 2006). This may contribute to geographical concentration of a particular subtype (Perrin et al., 2003).
There is also evidence that subtypes can behave differently when challenged immunologically and therapeutically. An example of this is found with subtype C.
1.3.2 Subtype C
Since its discovery during the late 1980’s in Ethiopia (Bessong, 2008), subtype C has spread rapidly to sub-Saharan Africa, Brazil, China and India, mainly through heterosexual contact. A possible explanation may be particular social and sexual practises or founder effects of the population. However, this cannot be true for certain regions of China and Brazil, where this subtype has over-taken previously dominant subtypes (De Oliveira et al., 2003, Gordon et al., 2003). There is also strong evidence to suggest that subtype C was introduced into southern Africa after clades A and D (Walter et al., 2009). Furthermore, data from India indicates that the introduction of HIV to the population occurred at one or very few events. Therefore the overwhelming dominance of subtype C in India (90-95%) compared to the other subtypes present in the country (A and B together account for 5-10%) cannot be attributed to repeated re-introduction of this subtype (Rodriguez et al., 2009). This data suggests that subtype C has viral characteristics which provide it with enhanced capacity to proliferate, increased viral fitness or higher transmission capacity.
Subtype C has several distinct genomic features, including (1) a prematurely truncated rev open reading frame, (2) an extra NF kappa B binding site in the long terminal repeat, and (3) an enlarged Vpu protein (Ndung'u et al., 2001, Gordon et al., 2003). Subtype C PR also displays higher enzyme activity than protease from other subtypes and distinct signature sequences that distinguishes it other subtypes (Velazquez-Campoy et al., 2001). In addition, this subtype displays a fairly high level of variability. Several of the naturally occurring polymorphisms in subtype C are considered drug resistance mutations in subtype B and have been found to have a role in reduced susceptibility to therapy (Malet et al., 2007, Nijhuis et al., 2007b, Bessong, 2008, Ho et al., 2008, Jinnopat et al., 2009)
1.3.3 Variability in subtype C
The degree of variability differs depending on the subtype and the region of the genome.
Certain regions of the genome are conserved across the subtypes as they are essential for function, for example, the CD4 binding site (Alexandre et al., 2011). Sequence variation of the CD4 binding site may destroy its function. Conversely, other regions can be extremely variable across the clades. This may exist to aid the virus in evading the immune response. For example the env gene is especially variable, as loops on the surface of the protein mutate rapidly to evade antibody response (Walker et al., 2005).
Another factor known to induce sequence variation is antiretroviral therapy. Drug resistance mutations which arise during ARV therapy allow the virus to continue replicating despite the presence of the drug (Wensing et al., 2010).
The gag gene is relatively conserved in the structural domains despite limited sequence conservation at the primary amino acid level (Ganser-Pornillos et al., 2008). However, Gag cleavage sites are diverse within subtypes and between subtypes in drug naïve individuals, representing natural polymorphism (De Oliveira et al., 2003, Nijhuis et al., 2008). Subtype C Gag cleavage sites display significantly more diversity than cleavage sites of other subtypes. This variation could arise as a result of mutations, selected for under ARV pressure, or could be present as natural polymorphisms (Bally et al., 2000, Verheyen et al., 2009).
A 2003 study found that the degree of amino acid sequence diversity at Gag cleavage sites depended on the HIV subtype and the particular cleavage site (De Oliveira et al., 2003). In general, polymorphisms were more common in subtype C than B. At all
cleavage sites the variability of subtype B was lower than subtype C viruses. Subtype C cleavage site diversity was similar to that observed for the entire group M, which encompassed the remaining 8 subtypes. The authors found that each subtype has distinct signature sequences at the cleavage sites. Three cleavage sites (MA/CA, CA/p2, and NC/p1) were relatively well conserved over time within subtypes B, C and group M, while the p1/p6gagsiteshowed moderate variation. The p2/NC cleavage site exhibited the most variability overall, across the entire M group with a mean percentage distance of 39.2%.
The same site in subtype B was considerably less variable with a mean percentage distance of 18.7 %. In subtype C this site had a mean percentage difference of 42.4%, the highest of all cleavage sites within all subtypes (De Oliveira et al., 2003). Other studies have also found this cleavage site extensively variable in therapy naïve individuals (Barrie et al., 1996, Goodenow et al., 2002, Ho et al., 2009).
Cleavage at the p2/NC site occurs between amino acid positions 377 and 378 of the Gag polyprotein in the model strain HXB2. As mentioned before, this is the first site of cleavage in Gag. This site also has the highest cleavage rate. In the De Oliveira study, positions P5, P4 and P3 of the cleavage site were found to be highly variable (De Oliveira et al., 2003) (see appendix A for nomenclature of peptide cleavage sites).
1.4 EFFECT OF VARIATION IN GAG
1.4.1 Viral fitness
Genetic variability contributes to differences in viral fitness (Goodenow et al., 2002).
Fitness is an evolutionary term used to describe the ability of an organism to reproduce and adapt to its environment and may be defined as a variants ability to contribute to successive generations by producing infectious progeny. The ability to escape from drug
or host immune pressure therefore are factors which contribute to fitness (Dykes and Demeter, 2007, Rodriguez et al., 2009). Replication capacity (RC) is also part of the fitness dynamic. This term is used to describe the rate of viral replication. A viral strain with a high RC will produce more virions in a set time than a strain with a lower RC.
Therefore RC is often used as a surrogate marker for viral fitness. It has been suggested that variants with lower replication capacity may be less pathogenic (Dykes and Demeter, 2007).
While genetic diversity is advantageous for continued viral evolution, some variation can elicit a fitness cost. This occurs when essential protein interactions are abrogated. Drug resistance mutations improve fitness by allowing the virus to grow in the presence of the drug but generally coincide with a decrease in RC. The decrease in RC is generally modest (2 to 10 fold) compared to the increase in resistance (>100 fold). Hence resistant viruses will almost always be selected for even at the cost of a decrease in RC (Clavel and Mammano, 2010).
An example of this can be found with Gag. Variation in this protein has been shown to have a significant effect on RC (Nijhuis et al., 2007a, Ho et al., 2008, Parry et al., 2009, Wright et al., 2010). Certain mutations in Gag CS has been shown to improve RC (Cote et al., 2001, Dykes and Demeter, 2007, Dam et al., 2009, Clavel and Mammano, 2010, van Maarseveen et al., 2012). Generally these are considered compensatory mutations which rescue RC after resistance mutations in PR. Mutations at the p2/NC cleavage site have been shown to improve RC after PI resistance has developed (Koch et al., 2006 , Ho et al., 2008). Differences in fitness have been attributed to changes in cleavage efficiency.
One proposed mechanism is the altered amino acid creates an alternative contact with the
enzyme in a domain which is not usually occupied by the substrate (Clavel and Mammano, 2010).
Fitness assays
Several varieties of fitness assays have been developed in order to measure viral RC.
Generally though, fitness is determined by an in vitro tissue culture assay, where either the percentage of infected cells or a product of viral metabolism is measured. The degree to which this measure correlates with viral fitness in an infected individual is not known, but it has been suggested that viral replication capacity may be predictive of progression to AIDS (Miura et al., 2009, Rodriguez et al., 2009). Such assays are referred to as replication fitness assays, however, it is recognised that these assays do not fully represent selective forces impacting viral fitness. An excellent and thorough review by Dykes and Demeter (2007) discussed common features, advantages and disadvantages of various fitness assays, and is summarised below.
A general feature of all RC assays is the comparison of a reference strain to a test strain, either a laboratory generated site directed mutant, or a viral strain isolated from an infected individual (Padiglione et al., 2010). Additional features of RC assays may be further classified based on 5 aspects: (1) parallel infections versus competitive growth assays (2) single or multiple cycles (3) clinical isolates versus recombinant virus assays (4) direct or indirect methods of detection and finally (5) the use of T-cell lines or primary human cells.
Parallel infections versus competitive growth assays
The first aspect is parallel infections versus competition growth assay. Competitive growth assays have the advantage of being able to detect subtle differences between viral variants. An additional benefit is the elimination of differences in culture conditions.
However, such assays can be technically challenging and require prior knowledge of viral sequences. Viral recombination is another concern with this type of assay, and results may be difficult to quantify (Brockman et al., 2006).
Single or multiple cycles
Single cycle assays typically involve the deletion of the envelope gene from the viral genome. Such viruses cannot produce infectious progeny therefore infection is limited to a single round. The advantage of this type of assay is shorter time frames. Multiple cycle assays are more sensitive as differences in replication fitness can be amplified over several rounds of infection (Brockman et al., 2006).
Clinical isolates versus recombinant virus assays
Assays using whole virus or clinical specimens are performed using intact virus culture derived directly from patient samples. These assays have the advantage of being a more accurate measure of viral fitness in a patient, but detection methods are limited to measuring viral genes or gene products. A recombinant virus assay is usually performed by cloning a gene of interest into a HIV vector encoding the remaining viral genes. This type of assay is suitable for determining the effect of a particular gene or gene segment or individual mutation, since background variation is controlled (Brockman et al., 2006).
Additional advantages are that modification of the recombinant virus to express a reporter
gene is less complicated and that the isolation of infectious virus from patient samples is not required. The disadvantage of a recombinant virus assay is that possible effects of other viral genes are not accounted for (Dykes and Demeter, 2007).
Detection Methods
Direct methods of measuring viral growth include p24 ELISA (Martinez-Picado et al., 2006) or reverse transcriptase (RT) activity (Brockman et al., 2006). For growth competition assays, allele-specific real time PCR, heteroduplex tracking assays (Quinones-Mateu et al., 2000) and sequencing of bulk PCR product can be used to determine the dominant strain. While these measurements provide a quantitative measure of HIV particles, a qualitative determination of viral infectivity is not assessed (Ball et al., 2003). Indirect measurements of viral growth are performed using a reporter gene, such as luciferase (Habu et al., 2005) or green fluorescent protein (GFP) (Gervaix et al., 1997).
These methods offer high sensitivity and the ability to quantify infection, however variants cannot be distinguished, and therefore growth competition assays are not possible.
Target cells
Target cells of the infection may vary between T-cell lines and primary human cells (referred to as peripheral blood mononuclear cells- PBMCs). The type of cells used in the assay may influence the quantified value of fitness for a particular strain. Differences in viral RC between T-cell lines and PBMCs could be due to differences in the number of cell surface receptors (i.e. CD4, CXCR4 or CCR5), cell growth and metabolism, or cell activation status (Brockman et al., 2006). PMBCs have been used for fitness assays (Padiglione et al., 2010) yet have a few issues related to their use. For example, PBMCs have lower concentrations of nucleotides than T-cell lines and experience difficulty in
remaining in culture for extended periods of time. PMBCs also require stimulation to become susceptible to infection, therefore permissiveness to HIV infection may change over time following activation (Campbell et al., 2003). Cell lines have the advantage of less cell to cell variability than primary human cells and can be engineered to contain a reported gene.
1.4.2 Protease inhibitors
PR inhibitors (PIs) are some of the most important drugs used for ARV therapy.
Understanding the effect of CS variation on proteolytic processing is therefore important for the design of new PIs. This class of drugs prevents viral maturation by inhibiting PR from processing the immature polyproteins. PIs mimic the natural substrate, binding in the active site of the enzyme. The drug becomes fixed in the substrate binding cleft as it cannot be cleaved by the enzyme (Nalam et al., 2010, Wensing et al., 2010). This prevents the enzyme from acting on any other substrate.
Mutations in PR allow the enzyme to continue functioning in the presence of the drug.
These mutations alter the shape of the substrate binding cleft, resulting in the enzyme having a higher affinity for the natural substrate than for the inhibitor. Interestingly, mutations in Gag CS are also able to contribute strongly and directly to PI resistance (Doyon et al., 1996, Zhang et al., 1997, Feher et al., 2002, Nijhuis et al., 2007b, Dam et al., 2009, Clavel and Mammano, 2010). While these mutations are relatively common, on their own they are only able to cause low level resistance (Verheyen et al., 2009).
Maximisation of the Van De Waals contacts is the proposed mechanism by which CS mutations contribute to PI resistance.
Computational Methods
HIV-1 PR is an attractive target for computer based drug design due to an abundance of structural information and as such, computational methods have been used extensively to study PR-inhibitor interactions (Jenwitheesuk and Samudrala, 2003, Pèpe et al., 2008, Verkhivker, 2009, Khedkar et al., 2010, Genoni et al., 2010, Nalam et al., 2010). These methods have become powerful tools to investigate interactions on a molecular scale.
Researchers have used several methods for computational analysis, including molecular dynamics (Genoni et al., 2010, Perez et al., 2010, Soares et al., 2010), computational proteomics (Verkhivker, 2009) and molecular docking (Khedkar et al., 2010, Jayakanthan et al., 2010).
Molecular dynamics may be described as computational simulations, and are used to predict the physical motions of atoms and molecules. Molecules are allowed to interact for a given time; trajectories of the molecules are then determined using Newton’s equations of motion. This method is often used in material science and modelling of biological molecules (Kirchmair et al., 2011). Computational proteomics may be defined as the study of protein behaviour, for example where a protein may be found in a biological sample, relative levels of expression, post-translational modification and interactions with other proteins (Colinge and Bennett, 2007). Molecular docking aims to predict the structure of a protein receptor-ligand complex and the resulting binding energies based on the 3D atomic structure of the two molecules. Consequently, molecular docking is often used in the pharmaceutical industry for purposes of drug discovery and design (Sousa et al., 2006).
In general, the purpose of drug discovery is to identify and develop small drug molecules which bind more strongly to the target protein than the natural substrate, thereby inhibiting the target biochemical reaction. Usually, drugs are discovered by in vitro high-throughput screening methods which test many compounds against a given target protein. This approach is expensive and time consuming. Simulated molecular docking studies can be used when the 3-dimensional structure of the target protein is known. Large databases of potential drugs /ligands can be screened virtually. Promising candidates are then tested by in vitro laboratory methods. This approach is much faster and cheaper.
During computational docking, structures can either be treated as rigid or flexible bodies.
The main advantage of treating the structures as flexible is that is enables a search without the bias introduced by the initial model (Jenwitheesuk and Samudrala, 2003).
Ligand conformation may change significantly; therefore incorporating flexibility into the ligand model is important. However the number of possible conformations increases exponentially when flexibility is taken into account, and therefore a large amount of computing power is required to complete such calculations. Complex algorithms have therefore been designed to tackle these issues, usually incorporated into software packages. There are many commercial and non-commercial docking software packages.
Examples include AutoDock, Dock 6.0, GOLD and Molegro.
AutoDock was designed in collaboration with UCLA institute for Genomics and Proteomics. This is a script driven Linux program used to dock flexible ligands into protein structures and then predict the binding energy of the bound conformations of ligands with macromolecule targets. This program used a grid-based method to evaluate the binding energy of a particular ligand conformation. A probe atom is placed at every point in a grid embedded in the protein, and an energy value is calculated. This set of energy values
allows for rapid evaluation of the energy of a conformation for which an atom in the ligand coincides with the identical atom in the grid. The interaction energy between the probe atom and the target macromolecule are then calculated. Scoring is based on thermodynamics models where intramolecular energies are evaluated (Morris et al., 2009). A similar program is DOCK 6.0, which was designed in collaboration with the University of California San Francisco. It is also a script driven program for use in a Linux based system that uses a grid based scoring function (Ewing et al., 2001).The advantage of these types of program is that they allow the users freedom to determine every parameter. However, a limitation with these programs is that the user must have an appropriate knowledge of the use of script based programs.
For users lacking experience in command line driven docking, software packaged with a user friendly Graphical User Interface are available. GOLD is an example of docking program which uses a search interface. It is a product of collaborations between the University of Sheffield and GlaxoSmithKline. This program is used for calculating the docking modes of small molecules in protein binding sites. The program is provided as part of the GOLD Suite, a package of programs for the visualisation and manipulation of structures. The parameters of the genetic algorithmm used by GOLD are optimised for virtual screening applications (Jones et al., 1995). Molegro Virtual Docker is yet another docking program with a user friendly interface. This program uses the MolDock search algorithm to find the most likely conformation of a ligand in a macromolecular target and then to predict the binding energies (Thomsen and Christensen, 2006). This software provides a docking wizard to assist the user in the preparation of the molecules and docking calculations. While many programs and software packages are available, it is ultimately up to the user to determine which will best suit the desired purpose of the docking.
1.5 PROJECT RATIONALE
Subtype C is the dominant form of HIV infection. Several distinct qualities of this clade could be responsible for the apparent improved viral fitness at the population level. This subtype has in particular a high degree of polymorphism in Gag at the sites of PR cleavage. The p2/NC cleavage site in clade C has the highest degree of polymorphism of all cleavage sites. Therefore variation at this site could have an effect on viral replication capacity.
1.5.1 Aims and Objectives
The aim of this study was to determine the impact of Gag p2/p7 cleavage site polymorphisms on subtype C viral fitness by assaying replication capacity and cleavage of Gag.
As it was not practical to assay all possible p2/NC cleavage site variants, a computational approach was employed to select the sequences which would be used in the laboratory assays. These calculations were used to predict binding affinity between PR and the p2/NC cleavage site. The results predicted by the computational studies were compared to the experimentally measured parameters
The first hypothesis was that ligands with a higher binding affinity would result in better ligand-protein interactions and hence display enhances cleavage efficiency of Gag. This was tested in an enzyme assay. The second hypothesis was that the ligands with higher
cleavage efficiency would result in a higher replication capacity. This was tested in a replication capacity assay.
To achieve this, the overall study objectives were:
1. To use molecular dynamics simulations to predict impact of p2/NC site polymorphisms on binding affinity between PR and Gag.
2. To preform replication capacity assays to determine the impact of selected cleavage site polymorphisms.
3. To preform enzyme assays to determine the effect of these same polymorphisms on Gag cleavage by PR.