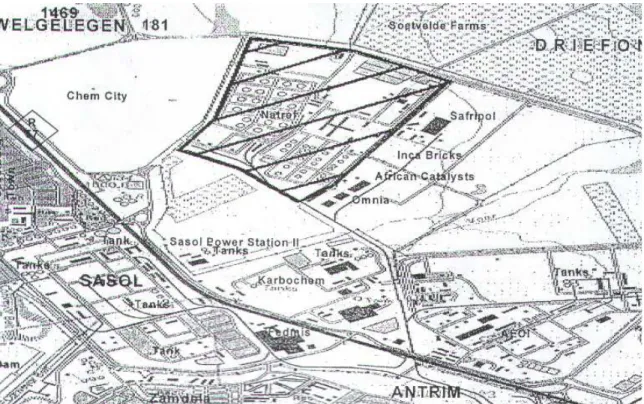
This research examined the impact and management of external project stakeholders in the chemical sector located in the geographic region of Sasolburg (Free Province of South Africa). I further declare that I have obtained the necessary authorization and consent to conduct this research. I would like to thank the following people who contributed to the completion of this research project:-.
INTRODUCTION TO RESEARCH PROBLEM
- R ESEARCH TITLE
- R ESEARCH PROBLEM
- R ESEARCH AIM AND MOTIVATION
- R ESEARCH SCOPE
- S ECTOR SELECTION
- G EOGRAPHIC REGION
- S UMMARY
This research examined the influence and governance of project stakeholders in the chemical sector in a South African project environment. The basis of this research differs mainly from Karlsen's (2002) study in that this research only focused on chemical manufacturing organizations located in the geographic region of Sasolburg, Free State Province, South Africa, as opposed to the general study conducted by Karlsen (2002) across sectors and geographic areas. The next chapter presents a literature review related to the focus of this research study.
LITERATURE REVIEW
- I NTRODUCTION
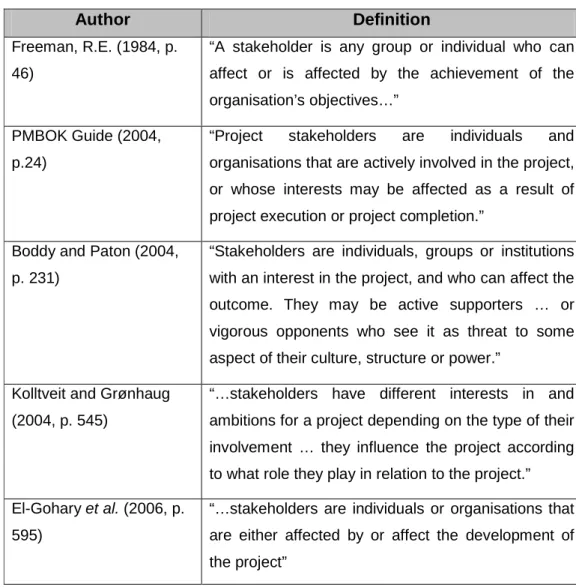
- P ROJECT S TAKEHOLDERS
- P ROJECT S TAKEHOLDER I DENTIFICATION
- C LASSIFYING P ROJECT S TAKEHOLDER I MPORTANCE
- I MPACT OF P ROJECT S TAKEHOLDERS
- D EVELOPING P ROJECT S TAKEHOLDER M ANAGEMENT
- P ROJECT S TRATEGY AND S TAKEHOLDERS
- E FFECT OF M OTIVATION ON P ROJECT P ERFORMANCE
- N ATURE OF THE C HEMICAL I NDUSTRY
- S OUTH A FRICAN C HEMICAL S ECTOR
- C ONCLUSION
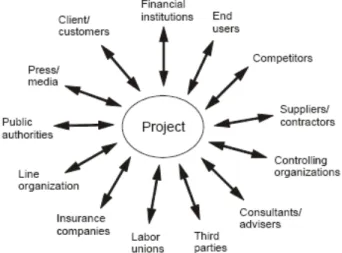
The challenge is to identify these project stakeholders and assess their needs and expectations in relation to project objectives to ensure which needs and expectations will be met and to identify which stakeholders can influence project decisions (Olander and Landin, 2005; Olander, 2006). The resulting stakeholder map helps determine the level of communication and depth of relationship required between the various stakeholders and the project. Project strategy can be defined as a direction that the project follows which contributes to the success of the project within its environment (Artto et al., 2008).
RESEARCH QUESTIONS AND HYPOTHESES
The null hypothesis states that all areas related to stakeholder management require the same amount of development. The alternative hypothesis states that there are specific areas that will require more development to improve project stakeholder management (two-tailed test, Ho: µi – µi+1 = 0, HA: µi – µi+1 ≠ 0 where i represents the different development areas for stakeholder management).
RESEARCH METHODOLOGY
- I NTRODUCTION
- R ESEARCH P HILOSOPHY
- R ESEARCH A PPROACH
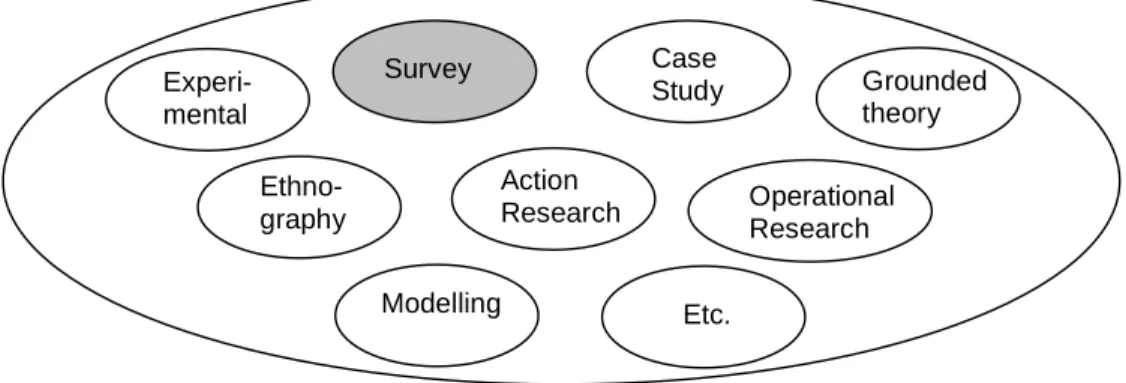
- R ESEARCH S TRATEGY
- T IME H ORIZON
- S AMPLE D ESIGN AND S AMPLING P ROCEDURE
- P OPULATION AND S AMPLING F RAME
- S AMPLING T ECHNIQUE , AND S IZE
- D ATA C OLLECTION M ETHOD
- D ATA A NALYSIS A PPROACH
- R ESEARCH L IMITATIONS
- S UMMARY
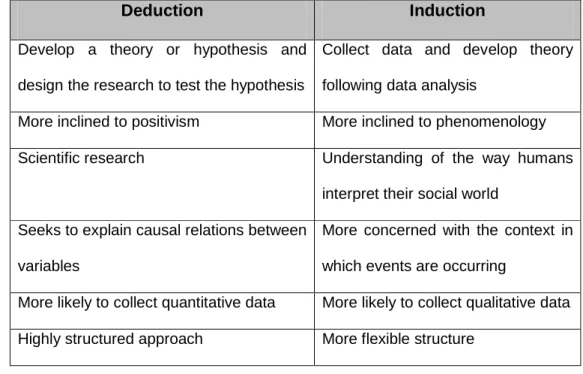
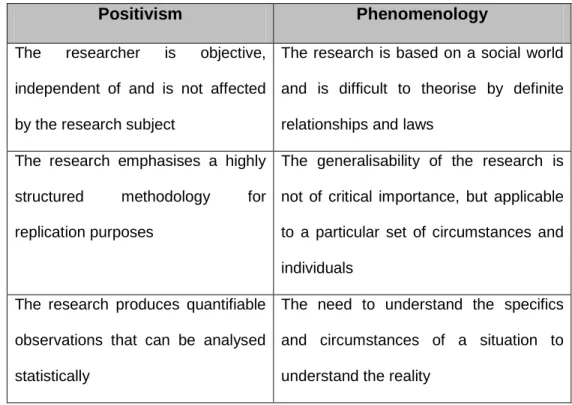
The generalizability of the research is not of critical importance, but applicability to a particular set of circumstances and individuals. Saunders (2000) states that the research approach taken may involve either a deductive or inductive approach, or a combination of both. More prone to positivism More prone to phenomenology Scientific research Understanding the way people are.
Due to the absence of a comprehensive list or database, the population size was unknown. Compliance of the method with the characteristics of the population in terms of literacy and access to e-mail. The questionnaire design (see Appendix C) was based on fixed alternative questions as opposed to open-ended questions.
To increase the response rate, reliability and validity of the data collected, the design of the questionnaire included the following factors (Saunders et al., 2000, p. 279):-. This approach was undertaken to gain an understanding of the data collected and to provide a context for further data analysis. For example, the categorical data analysis included the use of frequency distributions to explore the experience levels of respondents and the average size (capital value) of the projects worked on.
This chapter explained the details and reasons behind the choice of the specific methodology used in this research.
RESULTS
I NTRODUCTION
P RELIMINARY D ATA A NALYSIS
Interviewer and auspices bias were not applicable to this research due to the research methodology used and the design of the research instrument. To ensure that non-response items were avoided in the survey instrument, the online questionnaire (which used email as the basis of contact) was designed to allow the respondent to return the questionnaire only when all questions had been completed.
A NALYSIS OF S URVEY R ELIABILITY
E XPLORATORY D ATA A NALYSIS
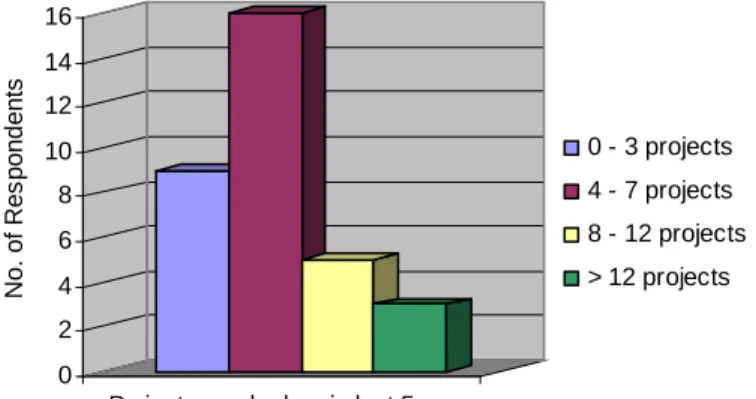
Relevant aspects related to frequency of occurrence and bar graphs are therefore drawn (Figure 5.3 and Figure 5.4). Figures 5.3 and 5.4 showed that the data values were positively skewed with most types of respondents having work experience levels between six to ten years, and that most respondents had worked on four to seven projects in the last five years. The relevant aspect was about the frequency of responses in particular categories and therefore a bar graph was drawn up (Figure 5.5).
D ESCRIPTIVE D ATA A NALYSIS
- I DENTIFICATION , C LASSIFICATION , AND I MPORTANCE OF S TAKEHOLDERS
- I MPACT OF P ROJECT S TAKEHOLDERS
- D EVELOPING P ROJECT S TAKEHOLDER M ANAGEMENT
- P ROJECT S TRATEGY AND S TAKEHOLDERS
It is clear from Figure 5.7 that the distribution of responses was negatively skewed with a longer tail towards the lower range of values. From Figure 5.9 it is clear that the distribution of responses was negatively skewed with a longer tail towards the lower range of values. From Figure 5.11 it is clear that the distribution of responses for the five highest ranked external stakeholders was negatively skewed with a longer tail towards the lower range of values, except for the consultants/advisors group which was positively skewed.
Therefore, a pie chart (Figure 5.12) was drawn and a box plot was made to show the distribution of values (Figure 5.13). Therefore, a bar chart of the percentage components was drawn (Figure 5.14), Figure 5.15 was drawn to illustrate the distribution of values, and Table 5.2 was constructed to highlight the results of the statistical tests. Figure 5.15 shows that for the five highest-ranked external stakeholder groups, the distribution of responses was a.
From Figure 5.19, the distribution of responses was positively skewed with a longer tail towards the higher range of values. A percentage component bar graph was therefore drawn (Figure 5.22), and a box plot was constructed showing the distribution of values (Figure 5.23). A pie chart was drawn summarizing the proportion of responses received (Figure 5.24), and a box plot was constructed (Figure 5.25).
A bar graph was drawn for percentages (Figure 5.26), Figure 5.27 drawn to illustrate the distribution of responses, and Table 5.3 constructed to highlight the results of the statistical tests.
S UMMARY
DISCUSSION OF RESULTS
- I NTRODUCTION
- E MPIRICAL D ATA C OLLECTION P ROCESS
- I DENTIFICATION , C LASSIFICATION , AND I MPORTANCE OF S TAKEHOLDERS
- R ESEARCH Q UESTION AND H YPOTHESIS 1
- I MPACT OF P ROJECT S TAKEHOLDERS
- R ESEARCH Q UESTION AND H YPOTHESIS 2
- D EVELOPING P ROJECT S TAKEHOLDER M ANAGEMENT
- R ESEARCH Q UESTION AND H YPOTHESIS 3
- P ROJECT S TRATEGY AND S TAKEHOLDERS
- S UMMARY
The first research question asked was: “Which stakeholders are most important in the project environment?” while the null hypothesis stated that all stakeholders of the project are equally important and receive the same emphasis in terms of stakeholder management. The majority of respondents agreed that involving stakeholders throughout the project lifecycle was critical to project success. The data also showed that unions, financial institutions/insurance companies and competitors caused minor problems and uncertainty for the project.
The result was similar when assessing whether stakeholder management was formally integrated during the project lifecycle (46% of respondents were neutral and 12% disagreed). When assessing the frequency of risk and benefit communication between the project and its external stakeholders, the results of this study were mixed. The assessment of the extent to which external stakeholder strategies are analyzed in relation to the project showed that the majority of respondents answered that external stakeholder strategies are sometimes analyzed in relation to the project.
The survey results showed that the majority of respondents rated the effectiveness of the stakeholder management strategy as average, with just over a quarter of respondents rating the strategy as good during the project. The survey results showed that motivating external stakeholders to achieve project objectives and analyzing external stakeholder strategies related to the project did not receive much attention. There was no evidence to suggest that there was a formalized system for stakeholder management throughout the project life cycle; and that stakeholder management was formally integrated into the project lifecycle.
Holistically, these results indicated that stakeholder management was not sufficiently emphasized during the project with research findings supporting that stakeholder management strategies were generally average in terms of their effectiveness over the project life cycle.
CONCLUSION AND RECOMMENDATIONS
- I NTRODUCTION
- M AIN R ESEARCH P ROBLEM
- R ECOMMENDATIONS
- F UTURE R ESEARCH I DEAS
- C ONCLUSION
The third research question asked was “Which area(s) of project stakeholder management requires the most development?” while the null hypothesis stated that all aspects of stakeholder management require equal development. The areas of stakeholder management that required the most development were the areas of strategy and plans; evaluations; and tools and methods with no significant difference between the areas of strategies and plans, and evaluations. The areas of strategy and plans; evaluations; and tools and methods required the most development and focusing on these can put more emphasis on project stakeholder management at the tactical level, resulting in improved project performance.
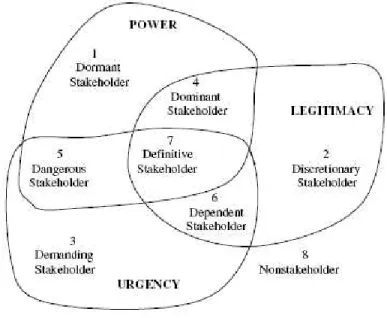
The aim of this section is to highlight recommendations applicable to the scope of this research to improve the effectiveness of stakeholder management in future projects. These recommendations are listed in order of priority and should be an integral part of the stakeholder management plan. In order to enable a more efficient classification of relationships in stakeholder management, in addition to the dimension of power, the dimensions of legitimacy and necessity can be included (where legitimacy refers to the authenticity of the claim, and necessity is related to time).
The dimensions of stakeholder management that required the most development were strategy and plans; evaluations; and tools and methods. These dimensions related to both assessing the impact of stakeholders on the project; and evaluating the effectiveness of the stakeholder management process. Further research is needed to explore the concept of improving project stakeholder management in terms of strategy and plans; and evaluations.
This research would be valuable in allowing comparisons to be made across sectors, and to determine whether and how project stakeholder management differs between sectors.
2003) Working conditions in projects: perceptions of stress and motivation among project team members and project managers. Available from http://www.groundwork.org.za/AirQuality/AirMonitoringReport2003.pdf. 1998) Strategy Implementation and Project Management. The importance of the early stage: the case of building and construction projects. 2004) Vertical specialization and industrial structure in high-technology industries.
Asia: John Wiley & Sons. 1997) Towards a theory of stakeholder identification and salience: defining the principle of who and what really counts. 2005) Evaluation of the influence of stakeholders in the implementation of construction projects. 2007). South African Government Information (2006) Accelerated and Shared Growth Initiative for South Africa Annual Report 2006 [Internet]. The Ministry of Trade and Industry (2006) The Chemical Industry Sector. 2006) Using storytelling and storytelling as knowledge sharing practices: a case study in the South African mining industry.
APPENDICES
This information is only required for academic purposes and can help improve project success by understanding the importance and impact external stakeholders can have on a project. If further clarification is needed, I can be contacted at or at [email protected]. Contractors: a person who enters into a contract to provide materials and labor for a job (source: www.askoxford.com/concise_oed/).
Third Party: A person or group other than the two primarily involved in a situation or dispute (source: www.askoxford.com/concise_oed/). Client: a person using the services of a professional person or organization (source: www.askoxford.com/concise_oed/). Line organization: a business or industrial structure with independent departments (source: www.businessdictionary.com/definition/).
Strategy: Planning and control of resources that enables efficient and effective use (source: www.businessdictionary.com/definition/). Visions and Objectives: Vision refers to an aspiration of what one wants to achieve while objective is specific goals to be achieved instead of vision (source: . www.businessdictionary.com/definition/). Procedures and routines: refers to a sequence of activities to perform a task (source: . www.businessdictionary.com/definition/).
Evaluations: Refers to the analysis of activities to assess status (source: www.businessdictionary.com/definition/).