The current study contributes to the existing debate by examining whether a migrant in the household generates welfare gains. However, Zimbabweans living and working in the diaspora in 2014 were estimated to be between 2 and 3 million people (Dzingirai et al., 2015). The decision to migrate is based on the potential migrant's perception of the expected stream of income, taking into account prevailing urban wages and the likelihood of finding a job in the modern industrial sector (Todaro, 1969).
The New Economics of Labor Migration theory is based on the notion that migrants find better opportunities in the places they migrate to, which is not always the case.
Empirical literature review
The results indicated that migration had a positive effect on the standard of living of rural households in Ethiopia. However, Azam and Gubert (2003) conducted a cross-sectional study of African countries, which showed that remittances are sent to the entire household rather than specific individuals.
Conceptual framework
The present study follows the perspective demonstrated by Azam and Gubert (2003), which is appropriate since welfare changes are typically assessed at the household level. Moreover, this collective approach is also embedded in Stark and Bloom's (1985) New Economics of Labor Migration theory, where decisions about migration are viewed as outcomes of joint utility maximization by the household.
Methodology
Model specification framework
First, the assumption that each family member has an equal share of consumed items regardless is unrealistic (Ravallion, 2008). The coefficient estimates from equation (1) are used to generate hypothetical consumption expenditures for migrant households. The projected values are used as estimates of what the consumption expenditure of migrant households could have been if the migrant members had remained at home.
A comparison is then made of counterfactual consumption expenditure and actual consumption expenditure for households with migrants. If some of the characteristics that affect the probability of migration are correlated with expenditure on consumption, then parameters of explanatory variables in the consumption equation will be biased and inconsistent (Adams, 1989). In the 2018 Migrating Out of Poverty survey data for Zimbabwe, about 94% of households reported being Christian, while only 6% reported belonging to other religious groups.
In the households that reported being Christian, 75% of them had a migrant, while of the households that reported belonging to other religious groups, 67% of them had a migrant member. District dummies are part of the covariates because proximity to the border reduces distance and cost of migrating to neighboring countries. A statistically significant coefficient of the Inverse Mills ratio in equation (4) indicates that there is selection bias.
Data and data source
It is expected that level of education will influence migration because people with higher levels of education have a high chance of being employed in the countries of destination (Greenwood, 1997; Todaro, 1977). Therefore, the probability of migration is expected to be high in households closer to the borders. The Inverse Mills Ratios (IMR) are produced after estimating equation (3) and then included in equation (4) as an independent variable.
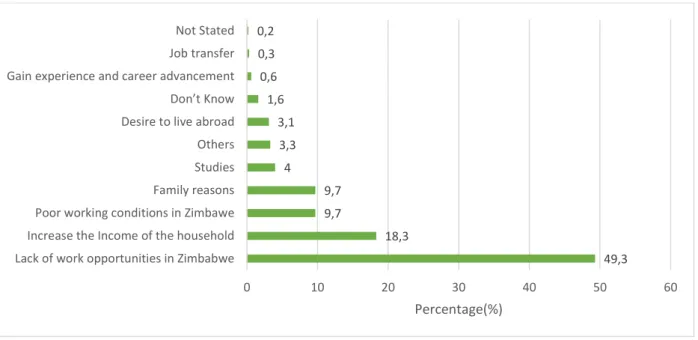
Purposive sampling was used to select households with and without migrants, the division between internal and international migrants within the group of households with migrants was not specified.
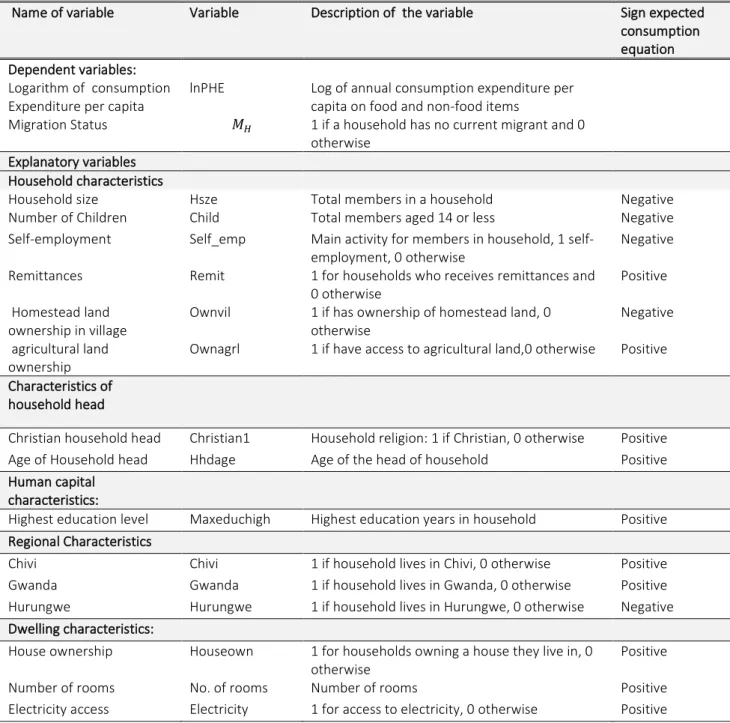
Variable description and a Priori Expectation Sign
Most of the households in Hurungwe have internal migrants, while the majority of households in Chivi and Gwanda have international migrants (Nyikahadzoi et al., 2019). Hurungwe is in Mashonaland West, while Chivi and Gwanda are close to the border with South Africa. According to Tawodzera and Crush (2016), living in districts closer to South Africa makes it cheaper and easier to send remittances to Zimbabwe.
Since remittances can be used to bridge the gap between consumption and income, they are expected to contribute positively to consumption expenditure. This is due to the fact that the district is far from the borders of neighboring countries and major cities. Since it is an expensive option, migrants end up going infrequently leading to households having less to spend on consumption.
Households that own a house and have access to electricity are expected to spend more on food and non-food items. In addition, households with access to electricity pay electricity bills, buy replacement light bulbs and other electrical appliances. Households living in houses made of wood and mud are generally classified as poor compared to households living in houses made of concrete.
Estimation, presentation and interpretation of results
Descriptive statistics
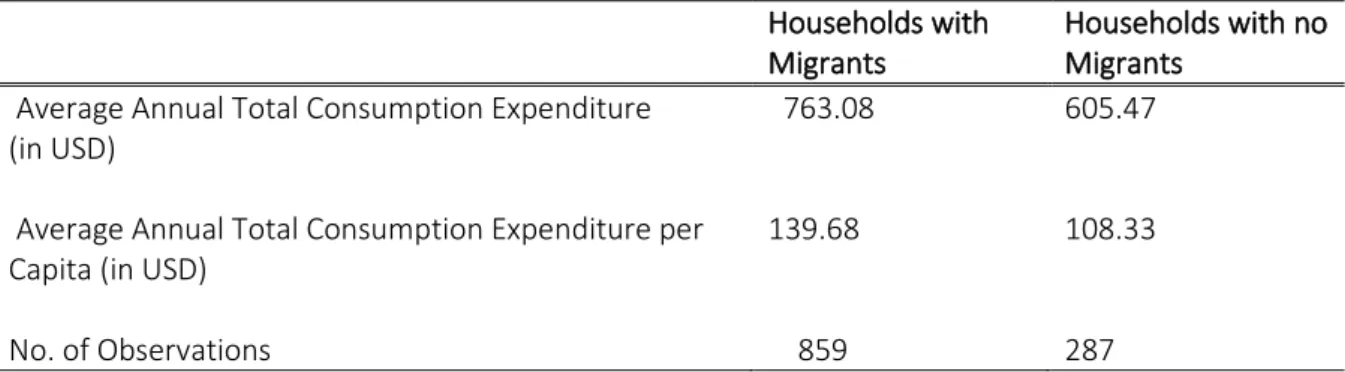
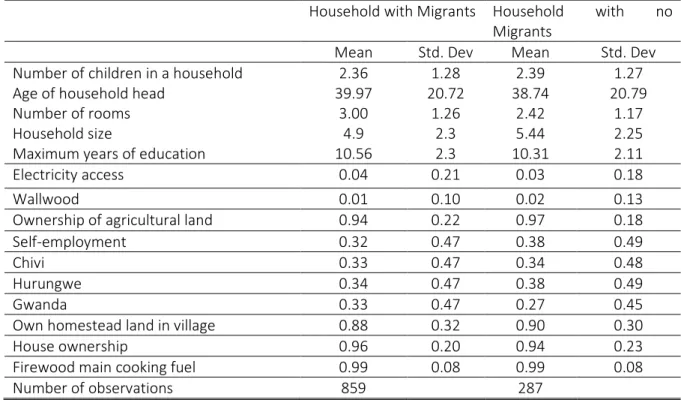
The average household size is five for both households with current migrants and households without current migrants. The statistics presented show that members of migrant households have slightly more years of education than non-migrant households, indicating a positive migration selection process. The share of access to electricity of 0.04 for migrant households and 0.03 for non-migrant households shows that households in these two categories living in the selected rural areas have little access to electricity.
Their main source of energy is firewood, as shown in table 4.2, that 99% of households in both categories use firewood as their primary fuel. A high proportion of households in the sample own agricultural land as indicated by 94% for households without migrants and 97% for those with migrants. A high proportion of households in both categories also own a homestead land in the village as well as the houses they live in.
There is a very small proportion of households living under dwellings, the main material of which is wall wood. About 38% of non-migrant households reported self-employment as their main activity, and this is 0.06 percentage points higher than reported by migrant households. In general, the results from table 4.2 show that the characteristics of families with migrants and families without are almost similar.
Empirical results
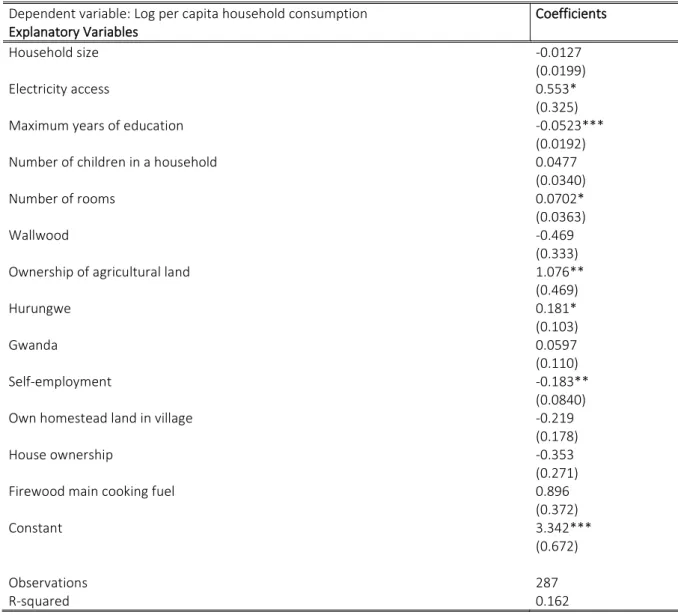
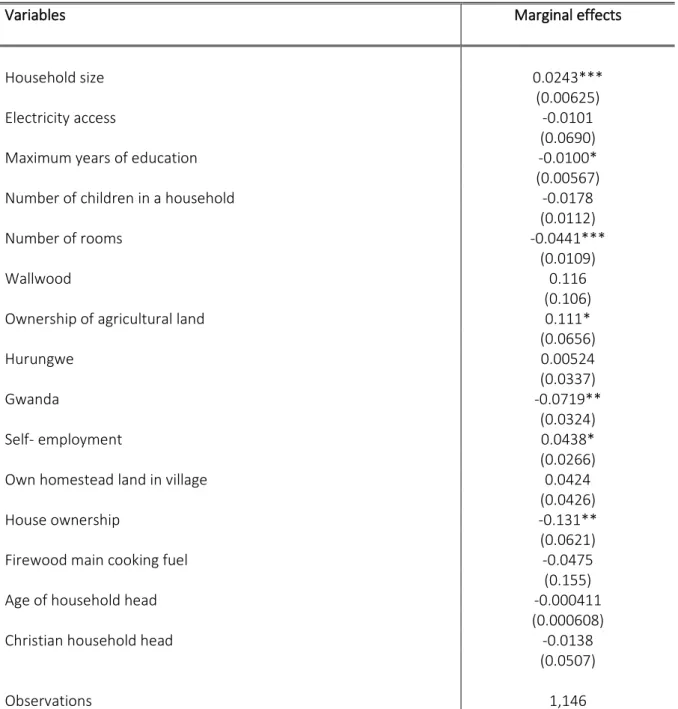
This shows that an additional year of education, on average, causes per capita consumption expenditure to decrease by $0.05 per household member, ceteris paribus. This shows that for a household with access to electricity, per capita consumption expenditure on food and non-food items will be 55.3% more compared to a household without access to electricity. This shows that a household that owns agricultural land in the village reported 107.6% more per capita consumption expenditure on food and non-food items compared to a household that does not own agricultural land in the village.
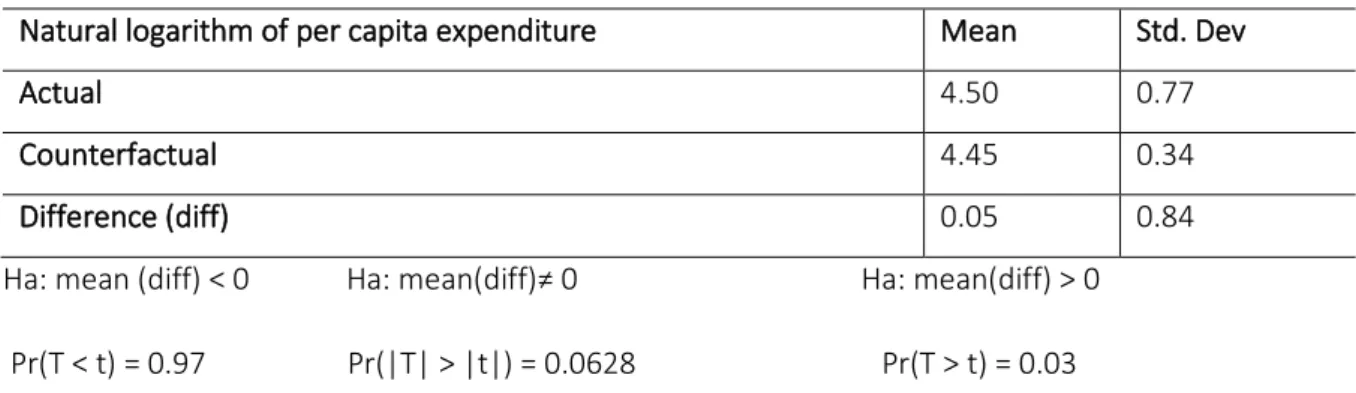
A household that reports that the main activity is self-employment has 18.3% less consumption expenditure per per capita for food and non-food goods than when the main activity is formal paid employment. The study used coefficients in Table 4.3 to estimate what household consumption expenditures would have been if immigrant members had stayed at home (counterfactual consumption expenditures for households with immigrants). The consequence is that having a migrant member in a household increases the average consumption per member of the household.
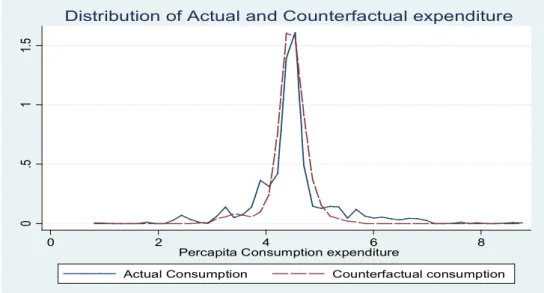
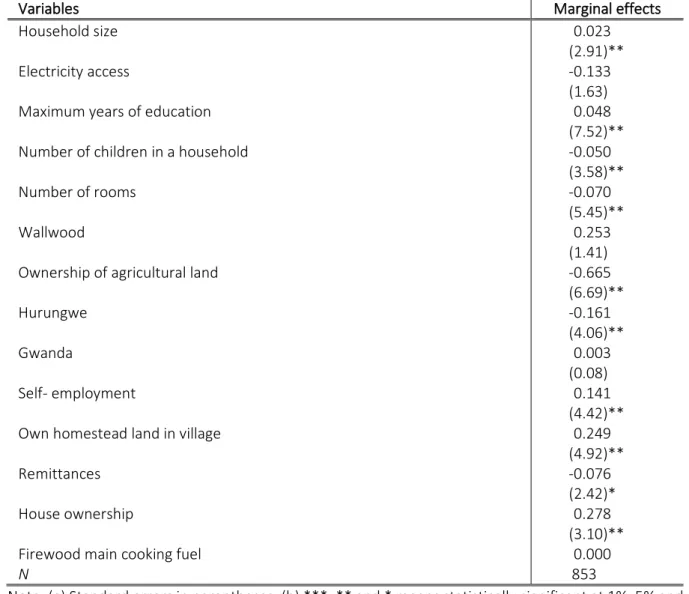
Under the mode of the consumption expenditure distribution, the counterfactual consumption distribution is slightly to the left of the actual consumption expenditure distribution. Indeed, before controlling for selection, 429 of the 859 migrant households were made worse off, while 430 were made better off by the migration of a member3. Households with a member whose main activity before migration was self-employment are 14.1 percentage points more likely to be better off by migration compared to households that were previously in paid formal employment.
Estimation results for two-stage Heckman model
Households that own agricultural land in the village are 66.5 percentage points less likely to be better off as a result of moving than those that do not own agricultural land, ceteris paribus. Thus, the extent to which migration networks differ across denominations may neutralize the effect of overall Christianity as an exclusionary constraint in the model. Selection Equation The coefficients of the Probit model (in Appendix 1.2) were used to create an inverse Mills ratio variable included in the second-stage regression model (selection corrected).
The most crucial result in Table 4.7 is the coefficient of the Inverse Mills Ratio, which is insignificant in this case, suggesting that selection is not a crucial issue here. However, it is not surprising that the Inverse Mills Ratio is insignificant, since the exclusion restrictions are all insignificant in the selection equation. Thus, the finding that migrant-sending households are not selected is partly an artifact of the choice of exclusion constraints.
The Inverse Mills Ratio is insignificant, so the coefficient estimates in Table 4.3 (OLS regression) and the results of the two-stage Heckman model are quite similar. Thus, the current study will not generate new counterfactuals using a selection-corrected model, but rather rely on counterfactuals created using the estimates in Table 4.3, as the results are consistent and do not suffer seriously from selection bias. Based on the results from Table 4.4, the prosperity of households with migrants would therefore have been 5 percentage points lower if the migrants had stayed at home.
Conclusions
Thus, it is reasonable to acknowledge that our model has failed to identify the correct selection mechanism and migration selection that may occur. Ultimately, on average, one-member migration improves the welfare of migrant-sending households in rural Zimbabwe. However, above the mode and at higher consumption expenditures, the distribution of counterfactual consumption is slightly to the right of the actual consumption distribution, indicating that migration makes migrant-sending households worse off.
Recommendations
The situation of illegal migrants in South Africa: A case study of Zimbabweans in Soshanguve extension 4 and 5. Self-employment and reason for migration: Are those who migrate for asylum different from other migrants. Rural out-migration, income and poverty: Are those who move really better off. presented at the Agricultural and Applied Economics Association conference, Milwaukee, 2009, Wisconsin: Agricultural and Applied Economics Association. non-experimental measures of the income gains from migration.
The selectivity of migration and the educational disadvantages of second-generation immigrants in ten host societies.
APPENDICES