Conventionally, risks are ranked based on the criticality, which is defined as the product of risk spontaneous probability and impact. Furthermore, when risk begets risk, the level of risk also depends on the level of risk. The value of a level of risk is calculated as the product of the related coefficient and.
We assume that the increased level of risk in the period will be eliminated in period 1.
Evaluation approach of risk interaction network
In addition, the value of is also affected by the timeliness of risk elimination during the project life cycle. When risk occurs, it can be eliminated immediately in the period or in future periods. The combination of this criterion with the heating process makes the RIN simulation model able to terminate automatically.
Social network analysis of risk interaction network
Network index of the node
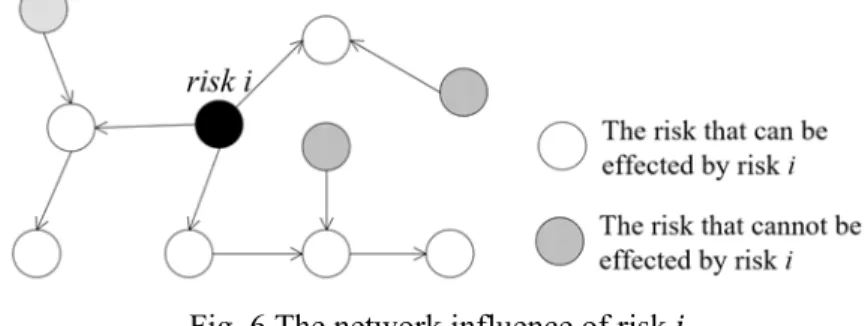
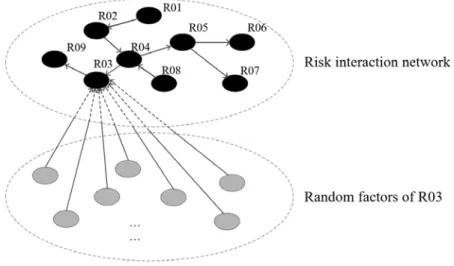
The latter is related to the network position of the risk, as shown in fig. If the paths from risk to the risks indicated by the empty circles are strong, the risk has a high probability of causing loss by triggering occurrences of other risks in the RIN. Regarding the RIN properties, the index can be weighted based on three aspects: the loss of risk, the spontaneous probability of the risk, and the loss of risks triggered by risk.
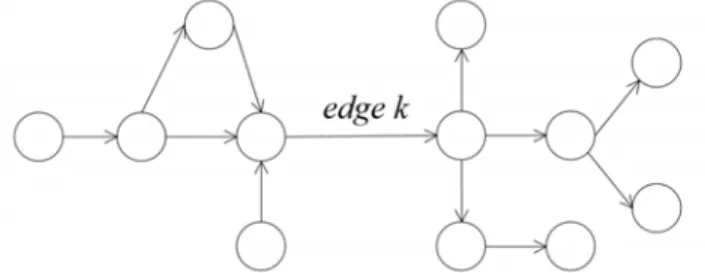
This phenomenon is related to the "edge betweenness" in the theory of SNA, which is a measure of the centrality of an edge in the network [22]. The index of , can also be weighted by treating the following four aspects: the power of the most powerful path from node to node, rand's contribution to the path, the spontaneous probability of risk. Consequently, the weighted betweenness of rand on the paths from risk to risk is updated from Eq. where , represents the -th strongest path from node to node passing through edge.
As a result, the indices can more accurately present the quantitative meaning of the node and edge. The paths whose powers are higher than the threshold will be selected for the calculation of the indices instead of the most powerful paths. The value of the threshold is determined based on the expert experience, the complexity of RIN, the RIN size and the conditions for comparing the indices.
Improved simulated annealing algorithm
RD representation and initial RD
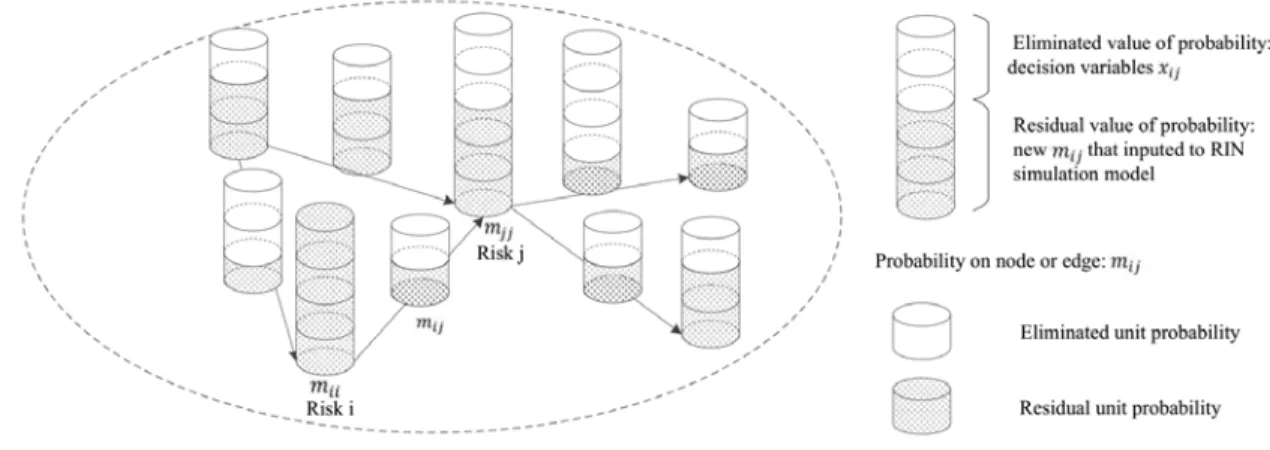
Recall that a risk RD is a combination of prototypical risk actions, which may involve eliminating the spontaneous probability of one risk or transition probability between a pair of risks. Suppose that the matrix represents an RD, where is the reduced value of spontaneous probability of risk if , or the transition probability from risk to risk if . The value of is set as integer multiples of the unit probability, which is set to 0.1 in this study.
No project can afford to manage all potential risks as it is subject to limited time and tight budget constraints [3, 4]. Thus, the RD optimization is under the constraint of total eliminated value with respect to spontaneous probability and transition probability, which is indicated by [27]. Meanwhile, the value of the decision variable is no more than the former is the diminished value of the latter.
The equal division method is used to determine the initial RD for the SA algorithm [19]. Only the parameters whose value can be changed based on Eq. 18) are taken as the decision variables and their number is denoted by . The first stage increments all decision variables by the value of , which is equal to ⁄ , where is a function that returns no more than the largest integer.
Definition of neighborhood search
The decision variable corresponding to the maximum (minimum) will be increased (decreased) by the unit probability. For example, if with minimum cannot be further reduced ( 0), the algorithm will search for the next best minimum until the associated is positive. This method of searching for the alternative also applies to what corresponds to the maximum.
Specifically, if the corresponding maximum cannot be increased since the current value is equal to , the algorithm will search for the one associated with the next best maximum until the value of is less than . There is another special condition that the value of the corresponding to the maximum is equal to and all the other decision variables are zero. In this case, the one corresponding to the maximum will decrease by and the one related to the second maximum will increase by .
As a consequence, the improved SA algorithm is applied to search the feasible domain of decision variables more quickly and effectively, which is denoted by the pseudocode in Fig. 9, represents the process of calling the RIN simulation model, whose output is the stable value of the total risk loss according to the specification; is the quantitative importance set of nodes and edges in RIN; represents the total number of iterations that the neighborhood search should repeat at a given temperature; and are the initial and final temperatures, respectively; is the Boltzmann constant used in calculating the probability of accepting a worse solution; and α is the cooling plane coefficient [19]. The algorithm terminates when the current temperature is below or equal to , or the best solution is no longer the best.
Illustrative example
RIN modeling
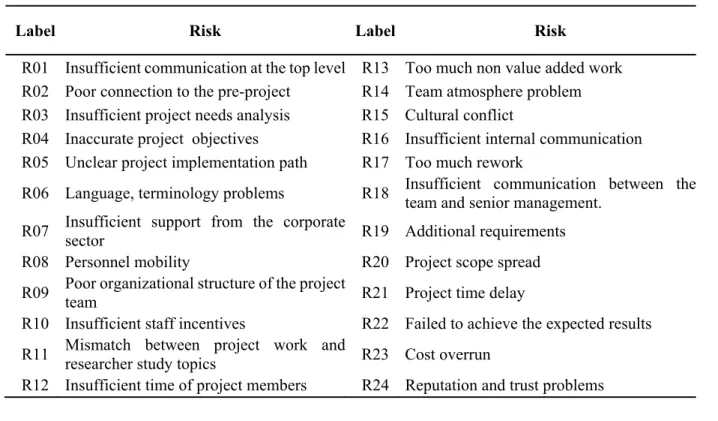
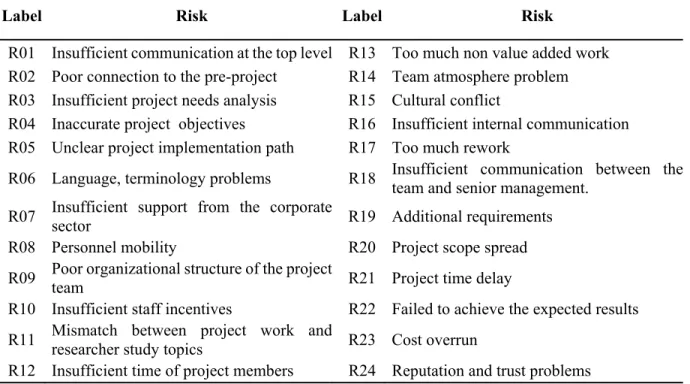
R01 Insufficient communication at top level R13 Too much work without added value R02 Poor connection to the pre-project R14 Team atmosphere problem R03 Insufficient project needs analysis R15 Culture conflict. The social network analysis is used to calculate the quantitative importance of the nodes and edges in RIN. A program is written in MATLAB to identify the paths of each node pair and calculate their power based on Eq. Consequently, the most powerful path is identified for each pair of nodes and the value of the index is obtained.
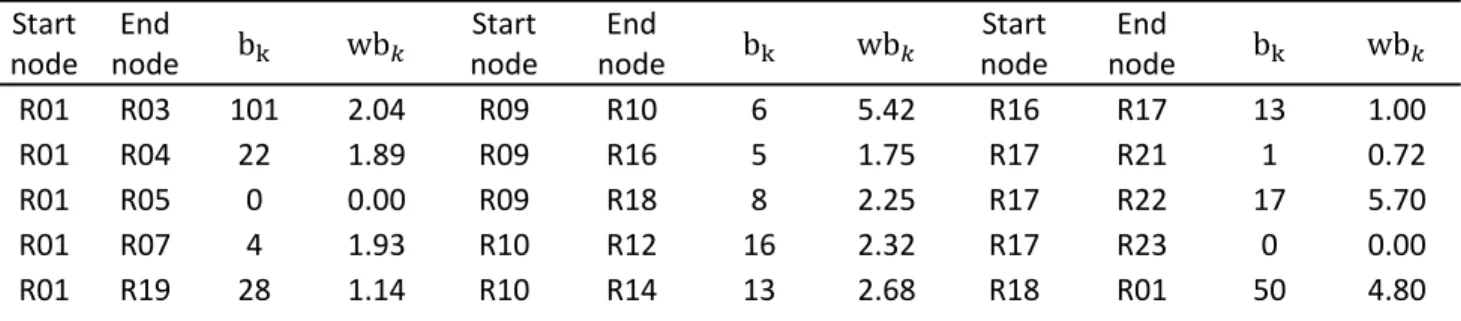
The matrix , where is the spontaneous probability of risk and is the transition probability from risk to risk and is the risk loss resulting from the occurrence of risk are used to calculate the network strength of the node and weighted based on Eq. These results are in Table 2. Regarding edge importance, the betweenness indices and weighted betweenness from Eq. Table 3: Edge Importance Calculation Start. 15), quantitative significance is obtained and will be entered into the improved SA algorithm program.
Simulation results of the proposed approach
24 From these results, the optimal RD can be considered as the optimal combination of prototypical measures that indicate the risks and interactions of the risks to be addressed. For example, it is equal to 0.1 in the aforementioned results, which means that the spontaneous probability of R20 should be reduced by 0.1. R20 is “Project Scope Range” which is related to the issue of uncertainty in the contract.
In this study, eliminating risk or risk interaction absolutely means that it reaches its maximum based on Eq. This shows the necessity of setting the decision variables as reduced probability value instead of binary values. This previous research compared spontaneous probability elimination action and transition probability elimination action.
The conclusion of previous research is specific to one risk in RIN while our conclusion is drawn from the perspective of the whole network. Therefore, the optimized RD focuses more on reducing the spontaneous probability to avoid the occurrence of risks and eventually radically reduces the total risk loss. This is because the weakening of the related interactions destroys the structure of the RIN effectively and ends up in a reduction of the total risk loss.
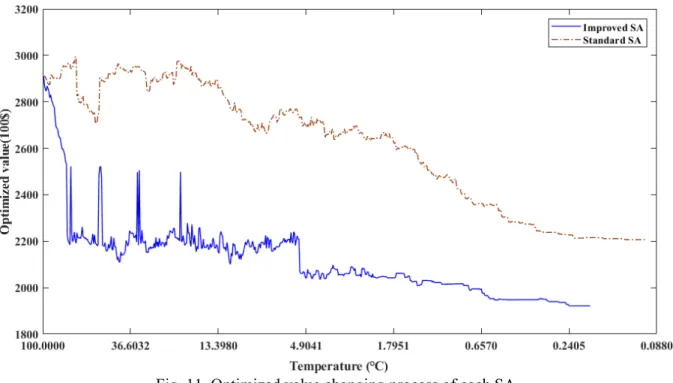
Contrastive analysis of improved SA and standard SA
In the initial stage of the temperature drop, the solid line corresponding to the improved SA decreases faster than the dotted line corresponding to the standard SA. Moreover, the temperature to stop the improved SA is higher than that of standard SA. These phenomena show that the improved SA can search for the optimized result more efficiently.
To validate this observation, these two SAs are run 20 times and the final optimized value of total risk loss and SA termination temperature are recorded. Table 5 shows that the improved VA performs better in terms of effectiveness and efficiency. In addition, the Bartlett test is used to assess whether the two samples have equal variance [31], the p-value indicates that the test rejects the null hypothesis that the variances are equal across the two samples, in favor of the alternative hypothesis that the variances are different.
Since the assumptions are not met, the non-parametric test is adapted instead of the parametric test [32]. Therefore, it is reasonable to conclude that the enhanced SA is better than the standard SA in terms of respecting effectiveness. Similarly, the NR samples are compared and the final p-value returned is the one that favors the conclusion that these two samples are different from the mean.
Conclusion and perspective
In SNA, two new network indices are introduced to assess the importance of nodes and edges with respect to the causation of risk loss. The analysis of the optimized ZHR shows that most of the risk elimination efforts are devoted to reducing the spontaneous chance of risk, which is opposite to the previous study. This is because the previous study focuses on one risk in RIN and aims to reduce the occurrence of risk, while our study faces all risk in RIN with the aim of reducing the total risk loss.
In addition, in the RIN's SNA, the significance of a toad is judged by its strength; however, a path with a smaller delay is more important because it can create a risk faster. The proposed approach uses the strongest paths and overall level of risk to calculate the network indexes in SNA. 29 but responsible for steering the stakeholders, such as ensuring the sustainability and efficiency of the stakeholders in the contracts [33, 34].
Hatefi, An integrated methodology for assessment and selection of the project risk response actions, Risk Analysis. Raz, An integrated approach for risk response development in project planning, Journal of the Operational Research Society. Ding is the committee member in the final stage of Global Project Excellence Award of International Project Management Association, the member of the Global Degree Certification Committee in Project Management Institute and chief specialist of Project Management Review.