The utilization of energy storage systems is necessary in renewable microgrids as they can ensure the reliability of the supplied power. The objective of this research was to develop a battery management system algorithm to control the charge/discharge of a battery bank and keep its state of charge (SoC) within the allowable limits to avoid deep charge/discharge of the battery in a DC micro-grid.
INTRODUCTION
- Backgrounds
- Micro-Grids
- Energy Storage Systems
- Energy Management Systems
- Statement of the Research Problem
- Motivation for Research
- Aims and Objectives of the Research
- Methodologies
- Research Questions
- Significance of the Research
- Plan of Development
Specifically, more attention is focused on the optimization of the energy management system seeking efficiency, economy. The use of battery energy storage systems, especially in renewable micro-grids, has an important role in electricity reliability, as it can mitigate power fluctuation, reduce power quality problems and control voltage, in this direction needs an energy management strategy. to be implemented.
LITERATURE REVIEW ON MICRO-GRIDS
The Divergence between a Traditional Power Grid and a Micro-Grid
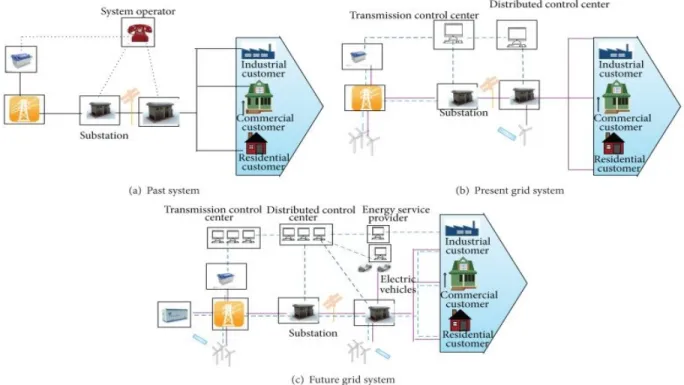
The distribution of the power grid is a fundamental factor to ensure and stabilize the operation of the electrical system as well as to optimize the allocation of resources. Based on the ineffective restoration process of the traditional power system, this requires a quick intervention, generally manual and in real time, while in a microgrid system, the whole processing of the restoration is much easier due to a limited number of controllable variables (Difference between traditional and MG) (Islam et al., 2014).
Some Benefits of a Micro-Grid
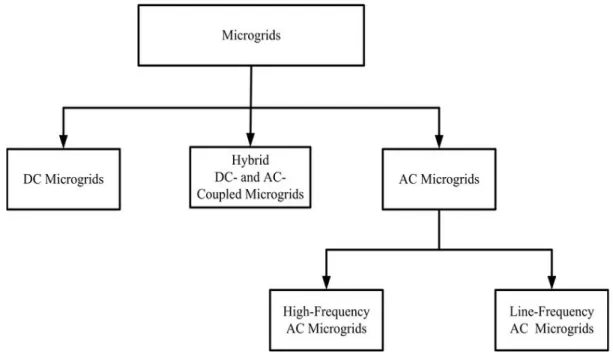
Types of Micro-Grid
- The DC Micro-Grid
- The AC Micro-Grid
- The Hybrid Micro-Grid
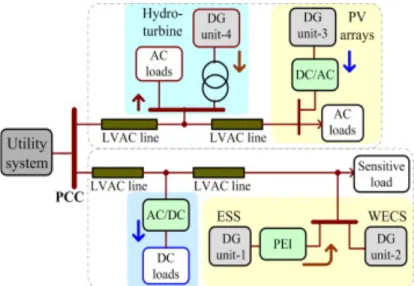
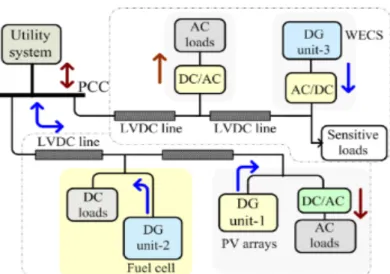
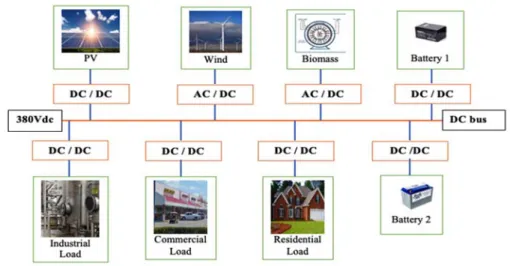
The DC microgrid can operate connected to the utility grid, either isolated from it. A hybrid microgrid includes an AC and DC microgrid, it combines AC and DC bus types (See Figure 2.6) (Kishore & Ravikumar, 2016).
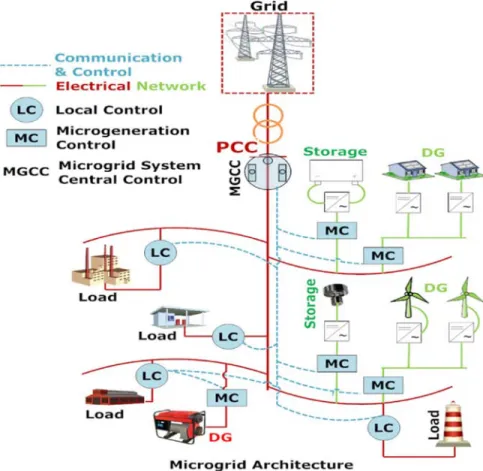
Micro-Grid Architecture
No additional inverter interface is required to supply AC or DC loads, improving system efficiency and reliability. The coordination of a control algorithm may be required by the system to achieve performance stability, which is challenging for this type of configuration (Ortiz et al., 2019).
Distributed Generation Systems
- Solar Power System
- Photovoltaic System Presentation
- Maximum Power Point Tracking Charge Controllers
- Algorithms for Maximum Power Point Tracking
- Photovoltaic Cell System Operation
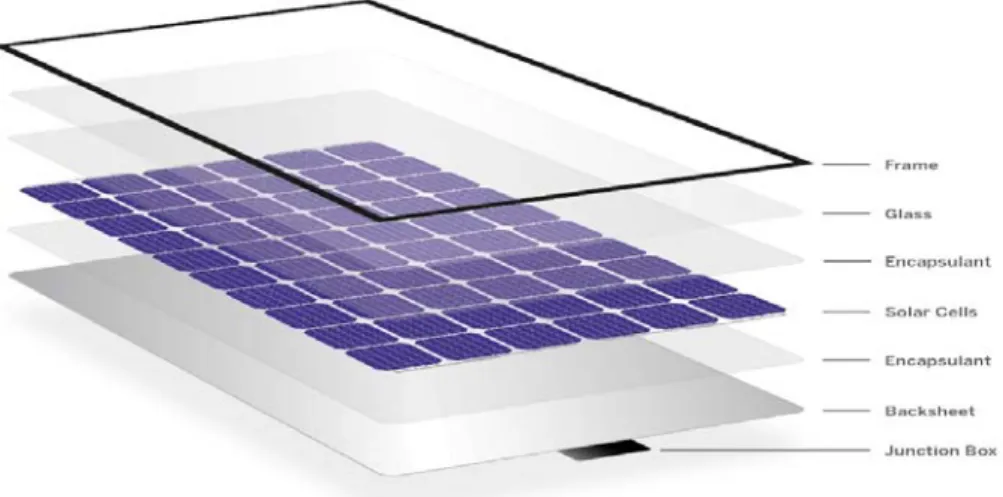
- Photovoltaic Module System
- Photovoltaic Array System
- Solar cell efficiency
- Wind Energy Power System
- Wind Turbine Characteristics
- Power Electronics Converters for Wind Turbines
The characteristics of the components included in them (such as rated output power and speed, shutdown and cut-off speed) affect the characteristics of wind turbines (Wrobel et al., 2018). C refers to the extracted wind fraction of the wind turbine and limits their theoretical value to 59.7%, according to Betz's rules (Sumathi et al., 2015).
Diode rectifier based converter
Where 𝜆 is the tip-to-speed ratio for the wind turbine (radians), 𝜔 is the rotational speed of the rotor (radians / second), R is the radius of the rotor (m) and 𝑣 is the wind speed (m / s). During the last two decades, the investigation of different configurations of converters depending on the power condition of wind turbine generators has been carried out.
Back to back converter
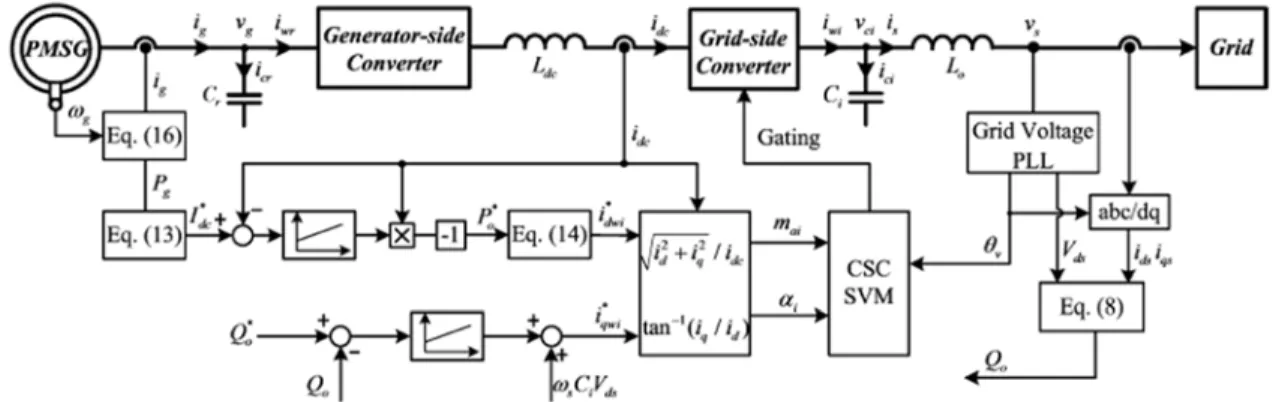
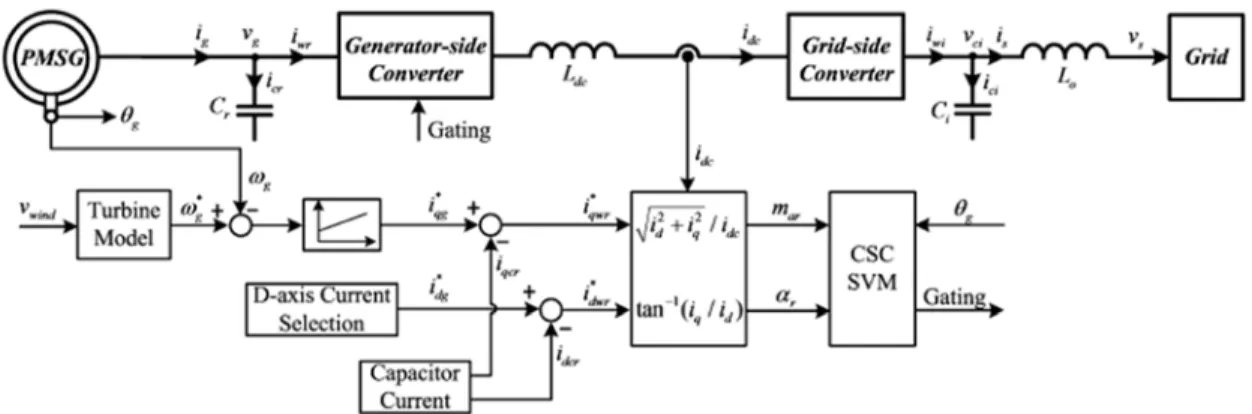
- Voltage Source Converter and Current Source Converter Wind
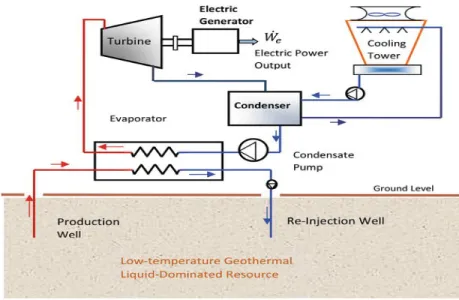
- Geothermal Power
- Hydropower
- Biomass Power
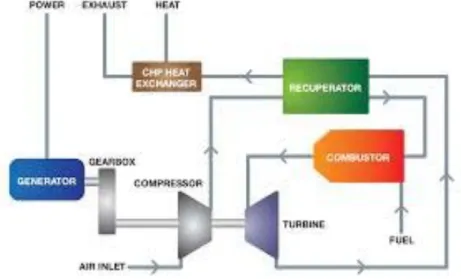
- Micro-Turbines
- Diesel Generators
Currently, biomass is becoming a more attractive system of global renewable energy, representing a higher level to increase the share of the world's electrical capacity (Rahman et al., 2015). The combined compressor-turbine unit forms the core of the microturbine (or turbocompressor) (Darrow et al., 2015).
BACK GROUND ON ENERGY STORAGE SYSTEMS
- Energy storage Systems
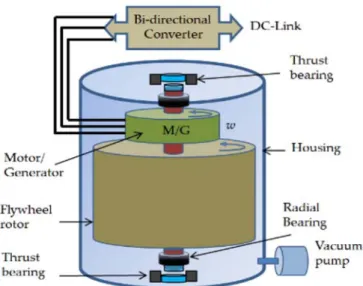
- Flywheel
- Fuel Cell
- Super-capacitors
- Secondary batteries
- Battery Energy Storage System Control
- Power electronics converters for batteries
- Non-Isolated Converters
- Isolated Converters
- Power electronics converters control
- Primary Control
- AC to DC converter
- DC to DC converter
- Droop control
- Secondary control
- Tertiary control
However, its disadvantages include a high cost and a protection requirement to limit the voltage and current (Daniel et al., 2018). When the switch is in disabled state, the input side of the circuit is isolated while the inductor supplies energy to the capacitor and the load (De Sousa et al., 2015). This converter is mostly used to charge and discharge the battery with respect to the battery voltage and load voltage (or .grid voltage) respectively (Fong, et al., 2016).
The diode is used to rectify the voltage, while the capacitor smoothes the rectified in the secondary (Ponzo et al., 2019). It operates at half the supply, which is a disadvantage, and it is not suitable for power mode control (Zhao et al., 2020).
SYSTEM DESCRIPTION AND MODELLING
- Introduction
- System Description
- Load Profile of the System
- Operation of the Designed and Developed System
- Mathematical Modelling of Main Components of the Developed DC micro-grid
- Modelling of Solar Power
- Modelling of Wind Power
- Modelling of the Battery
- Modelling and Design of Power Converter
- Buck-Boost Converter Parameters
- Determination of Inductor Value
- Determination of Capacitor Value
- Boost Converter Parameters
- Developed Energy Management System Control for Battery Energy Storage
E is the open circuit voltage of the battery expressed in (Volts); K is the polarization coefficient (Ω);. The state variables of the circuit (inductor voltage, v and capacitor current, i ) are expressed mathematically in the following equations. Based on the developed architecture, the power generation will meet the load requirements through four states and through the support of the battery bank.
Since the loads are supplied by the power generation, the voltage of the battery is measured at the same time. When the power generation is less than the total load demand, the loads are supplied using the battery bank.
RESULTS AND DISCUSSION OF THE DEVELOPED MODEL
Introduction
Second, the simulation results of the developed DC microgrid system and the power management system algorithm.
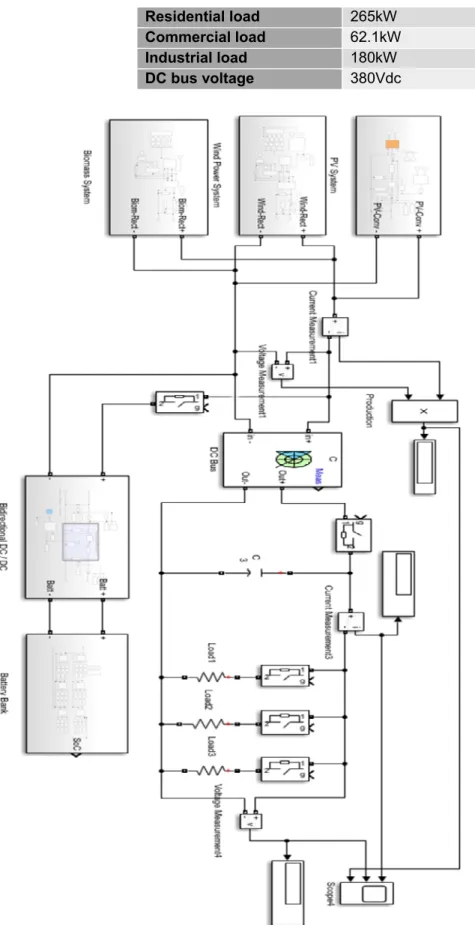
Description of Simulation Model for the Developed DC micro-grid
Simulation Results of the Developed PV Array Model for the DC micro-grid
- Simulation Results of the PV Array Model for the DC micro-grid
Simulation Results of the Developed Wind Power Model for the DC micro-grid 72
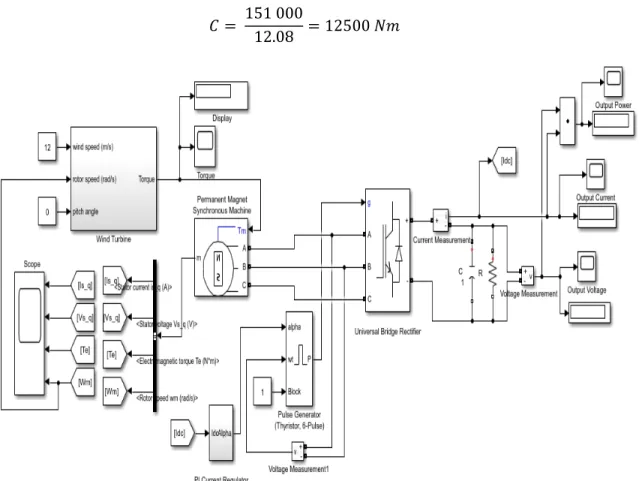
Simulation results of the developed wind power model for the DC microgrid To make sure that this design model is correct, the model can be simulated to estimate and analyze its performances and quality. The steady state of the output voltage is reached at about 2.5s and then remains constant at 380 V with very small ripples. The output current of the wind power system model from the universal bridge rectifier is shown in Figure 5.8.
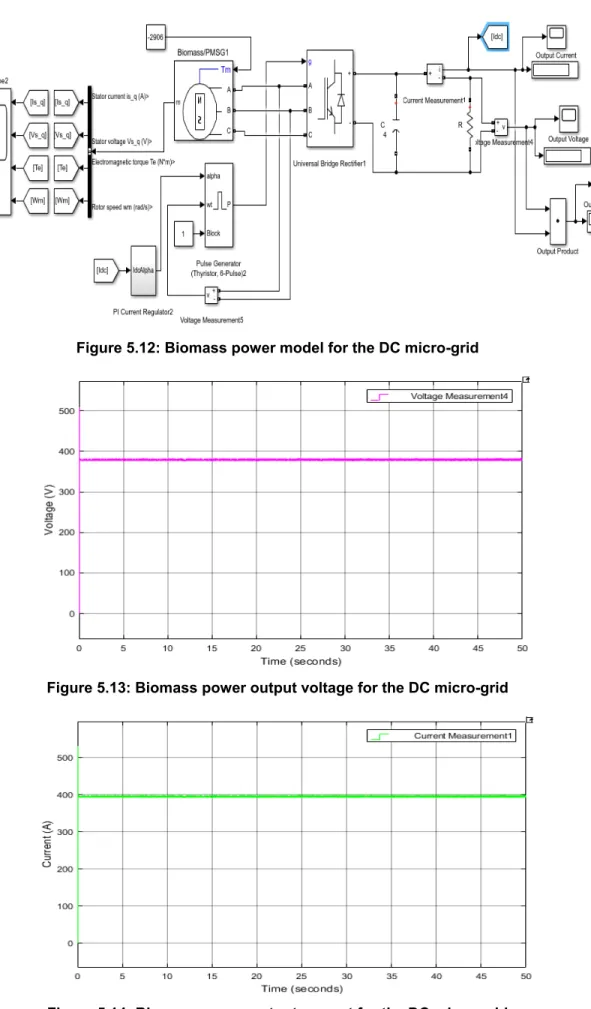
Therefore, the established voltage, current and power output values of the simulation results were identical and equal to the expected output values from the universal bridge rectifier. Simulation Results of the Developed Biomass Power Model for DC Micro-grid Since biomass block does not exist in SimpowerSystems, PMSG was considered for.
Simulation Results of the Developed Biomass Power Model for the DC micro-
- Simulation Results of the Biomass Power Model for the DC micro-grid
- Simulation Results of the Battery System Model for the DC micro-grid
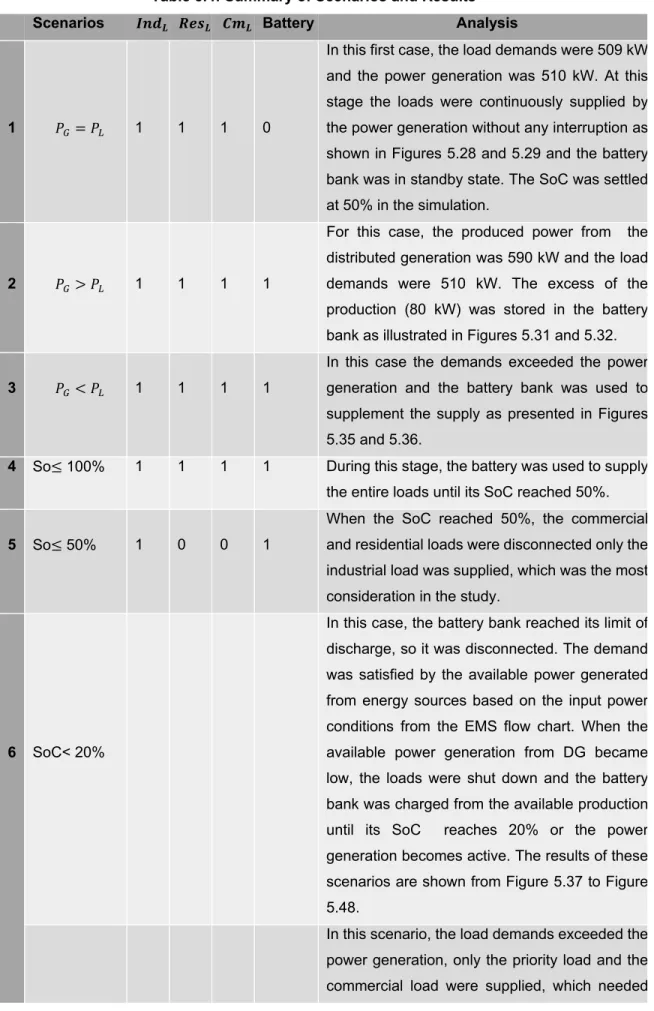
In Figure 5.35 above, the battery and the loads display 1 to indicate that the load requirements are supplemented by the battery bank. In Figure 5.37 it is shown that the two loads (Las1 and Load3) are supplied and charge the battery. The excess of the production (80 kW) was stored in the battery bank as illustrated in Figures 5.31 and 5.32.
The excess (50 kW) of the production was stored in the battery bank as illustrated in Figures 5.37 and 5.38. The industrial load (priority) was supplied without any interruption by the available power generation and the excess production (20 kW) was stored in the battery bank as shown in Figure 5.39 and 5.40. The power generation was less than the priority load in this case and the SoC of the battery was still less than 20%.
The battery bank was disconnected and the available power generation continuously supplied the residential load without interruption as shown in Figures 5.45 and 5.46.
Simulation Results of the Load demands for the Developed DC micro-grid
Description of the simulation of the developed energy management system
So, in Figure 5.32, the battery switch is displayed in blue to show its operating status. In this case it is considered that the power generation can supply power to priority load and the excess production is used to charge the battery as illustrated in Figure 5.39. In Figure 5.40 shown above, it is considered that the available power from the renewable sources is enough to supply power to the priority load and charge the battery bank.
In Figure 5.48 below, it is shown that the battery disk is shown in blue to show that only the battery is being supplied by the power generation and that the loads are isolated (closed). The residential load was supplied by the electricity production and 10 kW excess was stored in the battery bank as shown in Figures 5.43 and 5.44.
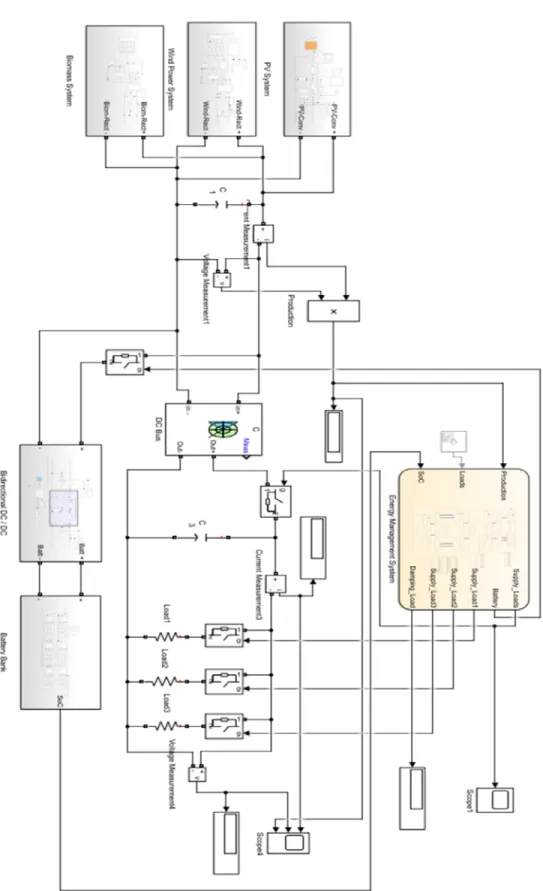
Simulation Results of the DC MG Using the Developed Energy Management
Conclusion
At this stage, the loads were continuously supplied by the power generation without any interruption as shown in Figures 5.28 and 5.29 and the battery bank was in standby. In this case the demands exceeded the power generation and the battery bank was used to supplement the supply as shown in Figures 5.35 and 5.36. In this case, the battery bank has reached its discharge limit, so it is disconnected.
When the available power generation from DG became low, the loads were switched off and the battery bank was charged from the available production until its SoC reached 20% or the power generation became active. The loads were instantaneously disconnected from the system and the available power generation charged the battery bank until its SoC reached 20% or the power generation became active.
CONCLUSION AND RECOMMENDATIONS
Conclusion
The various results of the scenarios of the developed energy management system algorithm have successfully shown that this developed algorithm will be able to ensure the reliability, robustness, robustness and proper operation of the battery systems in microgrid. The results showed that the battery is able to handle the load requirements of different scenarios investigated. In addition, this developed algorithm provides a low total cost, which is 20% lower than similar works and degradation impact on the battery.
The SoC of the battery operation will have a direct positive impact on the achievable lifespan and the cost of battery degradation will be significantly reduced. This algorithm ensures proper operation of the entire developed DC micro-grid system, resulting in reduced battery degradation and improved battery life, as well as the energy stored in the battery.
Recommendations and Future Works
The main advantage of this developed algorithm is that it will ensure the appropriate ratio between the charge / discharge rate of the battery energy storage systems according to their operating conditions and will allow keeping its SoC within the permissible limits (between 20% and 100%) according to the condition of the input power from EMS flowchart to avoid deep charge/discharge of the battery, which in turn will significantly affect their lifetime and reliability in the DC microgrid. In addition, the developed software model represents another advantage that allows users to access and modify any control parameter within the DC micro grid. The results showed that the initial investment costs will be relatively lower and will reduce the economic analysis in terms of LCOE.
Publication
AIUE Proceedings of the 18th Industrial and Commercial Use of Energy Conference 2020, Cape Town, South Africa, 23 – 25 November 2020. An Efficient Power Dispatch Control Strategy to Improve Generation Scheduling and Security of Supply for a Wind Farm Using a Battery Energy Storage System. Design and development of a wind turbine emulator for performance analysis of a stand-alone wind energy conversion system.
Proceedings of the 2nd International Conference on High Voltage Engineering and Power Systems: Towards Sustainable and Reliable Power Supply, ICHVEPS 2019, 2–7. Simplified model for optimal off-grid PV system sizing with respect to load probability loss value.