Shayne Mason for all the training and help with the NMR analysis and data interpretation. The effect of the anesthetics on the metabolic profiles of zebrafish and the implications this may have for zebrafish as research models has been mostly overlooked.
INTRODUCTION
- Background and motivation
- Aim and objectives
- Aim
- Objectives
- Experimental design
- Structure of dissertation and research outputs
- Author contributions
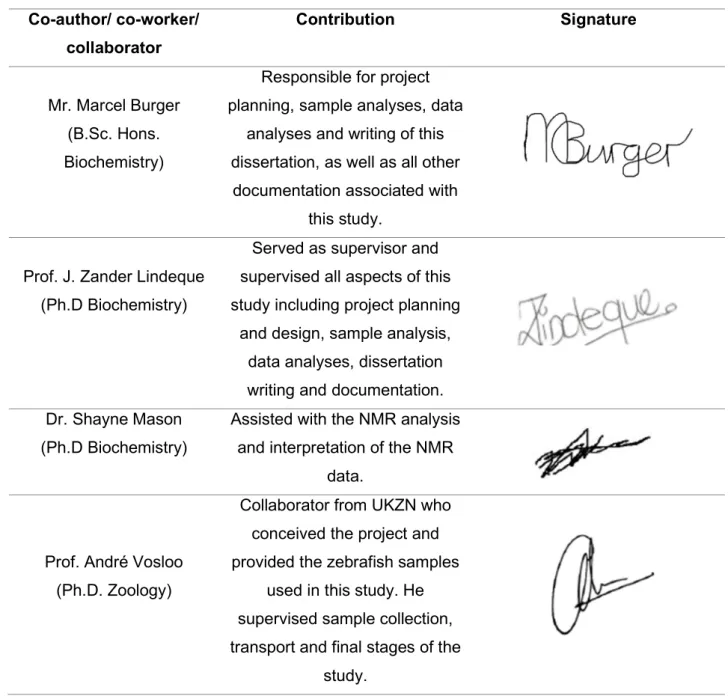
This thesis meets the requirements set by North-West University (NWU; Potchefstroom Campus), South Africa, for the Magister Scientae (Biochemistry) degree; and is structured in accordance with these guidelines, as shown below. The following statement by the research promoters and the primary author confirms their respective roles in this research and gives permission for the data generated and the conclusions drawn to be included in this thesis: “I declare that my role in the research, as indicated in Table 1.1 , is a representation of my actual contribution, and I hereby give my consent that this work may be published as part of the M.Sc.
LITERATURE STUDY
Zebrafish as research models
- Zebrafish as animal models for metabolism and biomedical research
- Advantages of zebrafish as animal models for metabolism and biomedical
- Disadvantages of zebrafish as animal models for metabolism and
- Zebrafish as models for aquaculture
Another advantage reported by Howe et al. 2013), is that the entire zebrafish genome is available, which is important for genetic analysis as well as interpretation of metabolic findings. The current techniques used to measure energy expenditure and food intake are also less sophisticated for zebrafish than for rodents (Seth et al., 2013).
Zebrafish metabolism
Santoro (2014) also reported that the TCA cycle and lipid metabolism in zebrafish were particularly similar to humans. Stainier (2017), also determined that genes known to be involved in the regulation of lipid metabolism are conserved in zebrafish.
Anaesthesia
- Mechanism of different anaesthetics
- Breakdown products of anaesthetics
- Stress response
Plasma glucose also increased at baseline, while chloride decreased in response to stressors (Topic Popovic et al., 2012; Lynne, 2012). According to Topič Popović et al. 2012), pre-anesthesia sedation was used for MS-222, which successfully reduced the stress response.
Effect of anaesthetics on metabolism
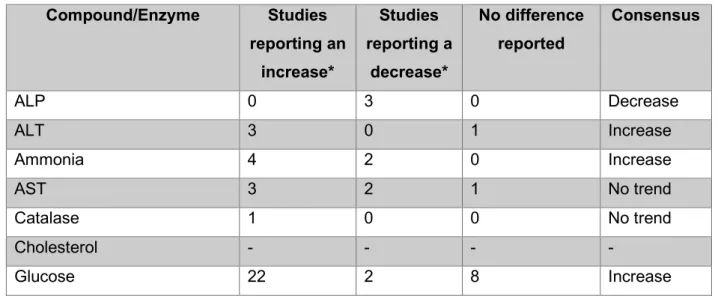
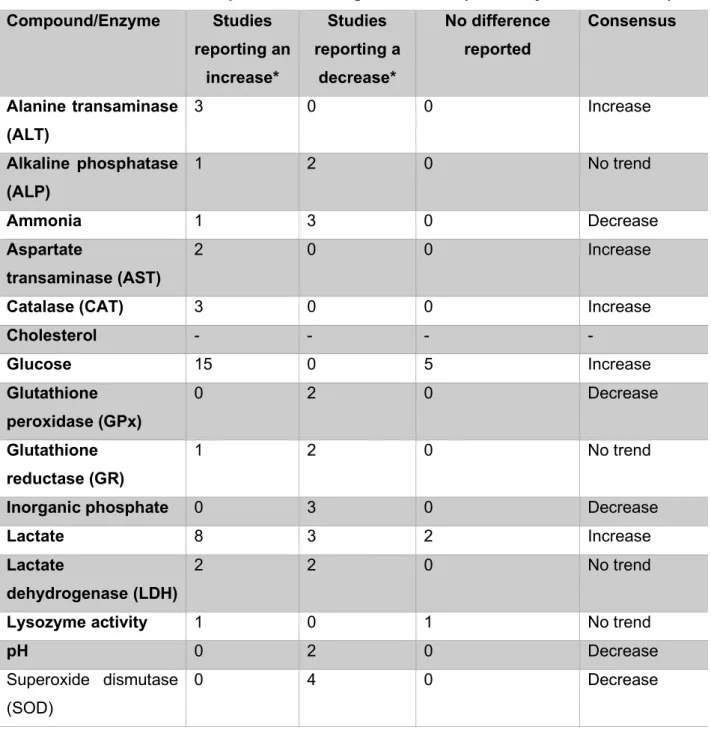
- Commonly altered metabolites
- Effect of anaesthetics on redox state
- Effect of ATP/ADP ratio on metabolism
The increase in glucose is caused by the increase in catecholamines as part of the stress response (Congleton, 2006; Lepic et al., 2014). The total protein content in the blood may indicate increased hemolysis (Roman et al., 2009).
Metabolomics
- Analytical approaches
- Extraction methods
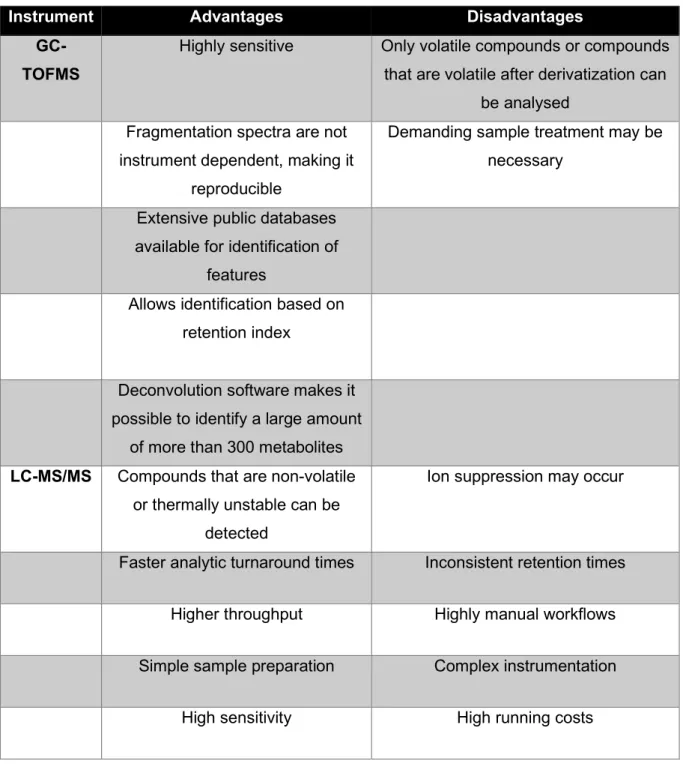
Furthermore, the metabolome is dynamic, unlike the static genome, and provides insight into the host phenotype (Du Preez et al., 2017). GC-MS has the advantages of being highly sensitive, efficient and quantitative (Garcia & Barbas, 2011; Scalbert et al., 2009). GC-MS allows the identification of detected species based not only on fragmentation patterns (mass spectrum) but also on retention time (Garcia & . Barbas, 2011; Scalbert et al., 2009).
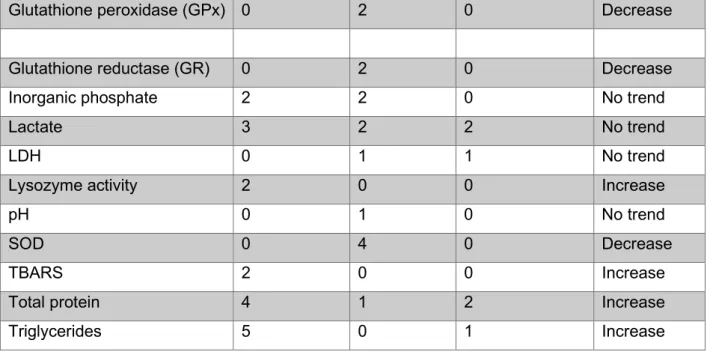
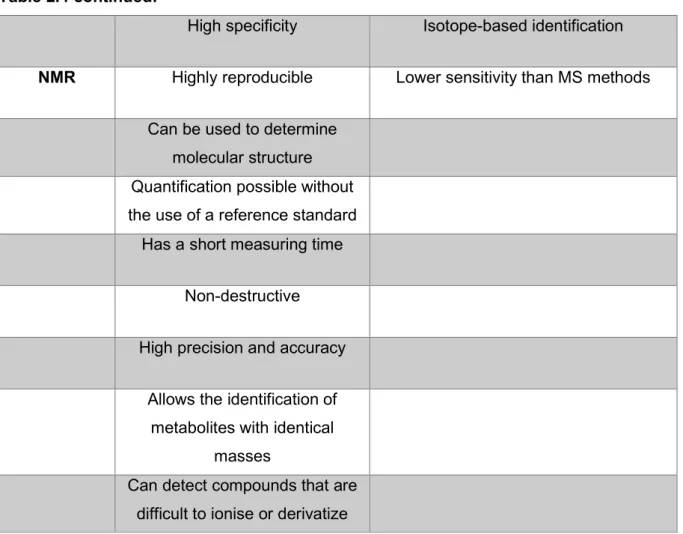
The main limitation of NMR is that it has a lower sensitivity than MS methods (Garcia & Barbas, 2011; Markley et al., 2017). Different approaches are often used in conjunction with each other, because the strengths and weaknesses of different approaches tend to offset each other (Ribbenstedt et al., 2018). Untargeted metabolomics has the advantages of being a comprehensive approach that can be used to discover new biomarkers and that it provides a basis for targeted analyzes (Ribbenstedt et al., 2018; Roberts et al., 2012).
However, targeted approaches have the limitation of providing limited coverage of the metabolome, which may cause important metabolic disturbances to be overlooked (Ribbenstedt et al., 2018). There are also modified versions of the Bligh and Dyer extraction where the final extract is monophasic (Wu et al., 2008). According to Salem et al. 2016) the two-phase method has the advantage that it. extract compounds with a wide range of polarities and in diverse compound classes.
METHODOLOGY
- Materials
- Experimental design
- Zebrafish treatment and sample acquisition
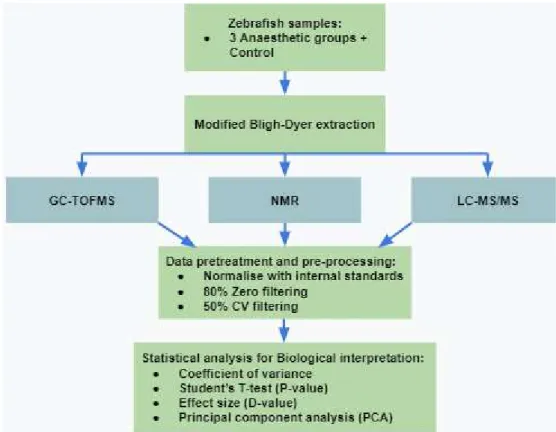
- Metabolite extraction
- Quality control samples
- Metabolomic analysis
- Sample preparation
- Instrumentation
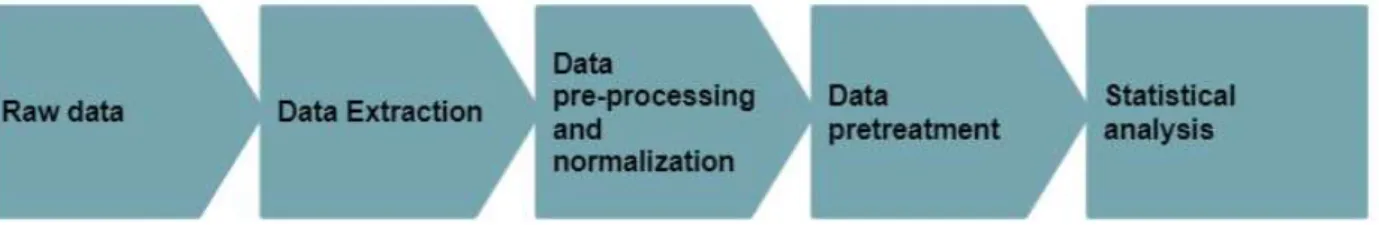
- Data analysis
- Data extraction
- Data pre-processing and normalisation
- Batch effect verification
- Missing value replacement
- Data pre-treatment
- Statistical analysis
- Feature Identification
The statistical analyzes used for final interpretation of the data were student's t-tests (p-values), effect size (d-values) and principal component analyzes (PCA). For this study, whole fish samples were used for the analysis due to the small size of the fish, which makes blood samples impractical. Whole fish samples also ensure a more complete picture of the fish's total metabolism (Seth et al., 2013; Löhr & Hammerschmidt, 2011).
The NMR QC samples were injected at the beginning, middle and end of the analytical batch. During the NMR analysis, Bruker Topspin (V3.5) software was used to perform automatic shimming of the sample based on the deuterium signal. The software does this by calculating a transformation parameter that minimizes the technical variance of the data (Parsons et al., 2007).
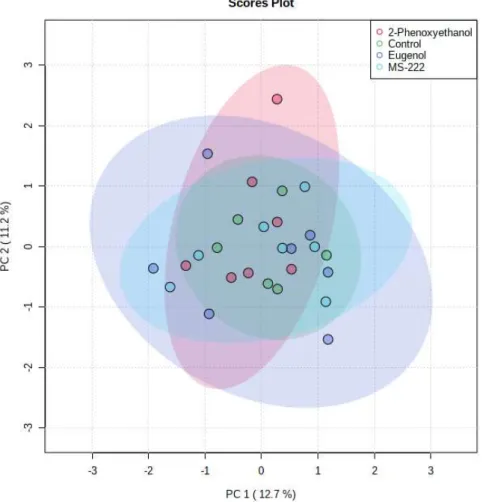
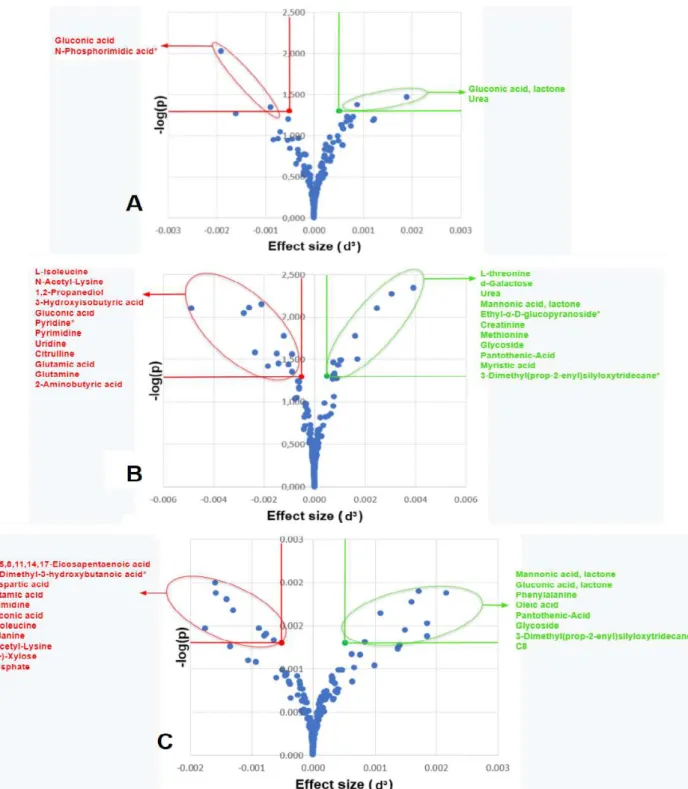
In this study, PCA was used to obtain an overview of the data prior to quantitative analysis. The PCA results were plotted with a 95% confidence ellipse to show the clustering of the data more effectively. In the volcano plots, the x-axis consisted of the effect size raised to the third power (𝑑), while the y-axis consisted of the negative log-transformed p value (Terburgh et al., 2019).
RESULTS AND DISCUSSION
Data quality and batch effect verification
Overview of data before feature selection
- GC-TOFMS analysis
- LC-MS/MS analysis
- NMR analysis
Evaluation of the PCA score graph thus showed no significant difference between the control and anesthetic groups when evaluated visually. The grouping of different experimental groups indicates a natural clustering of the data. The PCA score plot in Figure 4.3 showed no separation between the control and any anesthetic groups, similar to the PCA score plot of the GC data.
This visual examination therefore showed no significant variation in the concentrations of the targeted amino acids and acylcarnitines. Interestingly, the variance of the control group is smaller compared to variance seen in the GC-TOFMS and NMR bin data. The grouping of the different experimental groups gives an indication of the natural grouping of the data.
A PCA score plot (Figure 4.5) was generated to get an overview of the processed NMR data. The quantified NMR data consisting of the concentrations of important metabolites did not exhibit natural clustering when analyzed using a PCA score plot (Figure 4.5). As none of the PCA plots showed separation between experimental groups, it was decided not to use PLS-DA for feature selection due to the tendency to overfit data that have no natural separation (Kelly et al., 2018).
Feature selection (Univariate statistical analysis)
The concentration of only 4 traits differed significantly in zebrafish treated with eugenol, as shown in the volcano plot (A). In contrast, MS-222 and 2-phenoxyethanol affected the concentration of 23 and 17 traits, respectively, as shown in the volcano plots (B & C). The aim of the Venn diagram was to show the relationship between the different anesthetic treatment groups (Venter, 2013).
All the metabolites shown in the Venn diagram had to meet the requirement of having level 1 identities as well as significant p-values (<0.05) and d-values (>0.8). The Venn diagram in Figure 4.7 indicates the relationship between the different anesthetics regarding the number of significant metabolites. MS-222 affected the concentration of twenty metabolites, while 2-phenoxyethanol affected fifteen and eugenol only three.
Gluconic acid lactone was the only metabolite shared exclusively between eugenol and MS-222, while urea was the only metabolite shared exclusively between eugenol and 2-phenoxyethanol. The following metabolites were shared by MS-222 and 2-phenoxyethanol: glutamic acid, n-acetyl-lysine, pantothenic acid, mannonic acid lactone and glycoside. The following metabolites were only significant for MS-222: creatinine, 2-aminobutyric acid, methionine, glutamine, threonine, citrulline, 3-hydroxyisobutyric acid, isoleucine, galactose, 1,2-propanediol, myristic acid, pyrimidine, uridine.
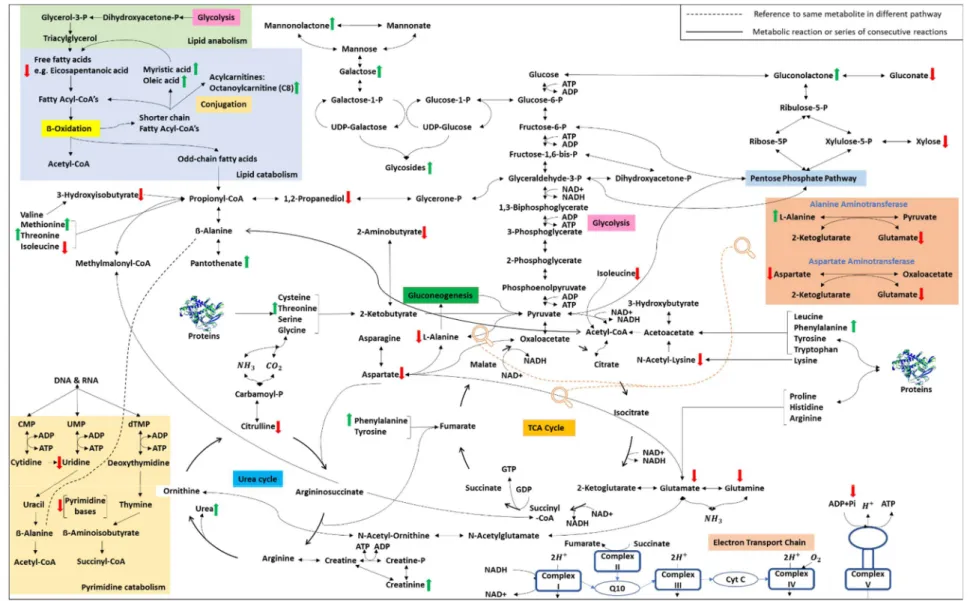
Biological interpretation
- Catabolic and anabolic pathways
- Effect of ATP levels on the upregulation of catabolism
- Effect of the stress response on upregulation of catabolism
- Effect of anaesthetics on other pathways and reactions
The first is that ATP is depleted to repair the lost membrane potential caused by anesthesia (Kishikawa et al., 2018). These two possible explanations are closely related, as the goal of the stress response is also to increase ATP production during times of stress (Fu et al., 2018). Due to the ATP dependence of cells, the metabolic pathways leading to ATP production are tightly regulated (Berg et al., 2002; Sussman et al., 1980).
In the event that ATP is depleted during anesthesia, as suggested by Kishikawa et al. This can cause a decrease in citrulline in the gut and kidneys, the gut being the main source of circulating citrulline (Curis et al., 2005). As previously mentioned, the amino acid concentrations in the anesthesia group were expected to be elevated due to increased protein catabolism (Reinecke et al., 2012).
A decrease in uridine can also cause a decrease in uridine diphosphate (UDP), because uridine is a precursor of UDP (Zhang et al., 2020). An explanation for this lies in the stress response, which upregulates glucose production (Tema Popovic et al., 2012; Lynne, 2012). Another common effect of stress reported by Fu et al. 2018), is that protein catabolism is upregulated to release amino acids for energy production.
FINAL CONCLUSIONS AND FUTURE PROSPECTS
Final conclusions
Critical evaluation and future prospects
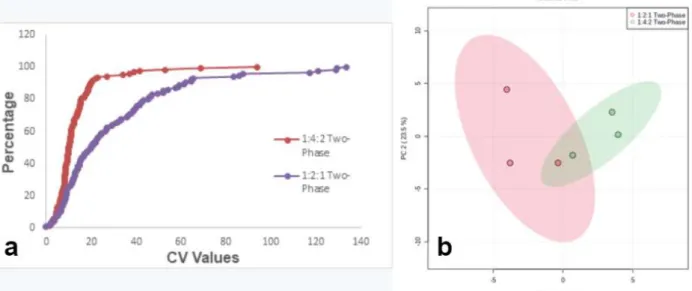
Ontogenetic changes in the toxicity and efficacy of the anesthetic MS222 (tricaine methanesulfonate) in zebrafish (Danio rerio) larvae. In the second experiment, the best solvent ratio from the previous experiment was used, followed by two different homogenization methods, a two-phase extraction method, derivatization and GC-TOFMS analysis. Consistent amounts of polar and apolar phases were transferred to GC-vials, derivatized (BSTFA + % TMCS) and analyzed by GC-TOFMS.
A PCA plot was also generated to aid in the comparison of the two solvent ratios (Figure A1(b)). The PCA plot supported this finding due to the closer clustering of the 1:4:2 group (shown in green). In the CV graph shown above, the curve for the vibration mill homogenization method is slightly shifted to the left, especially for functions with CV values between 40% and 50%.
The PCA plot supported this finding due to the tighter clustering of the vibration mill (bead beat) group (shown in red). The lower CV values of the two-phase method indicate that it had the lowest amount of variance among the three extraction methods. The PCA plot supported this finding due to the closer clustering of the two-phase group (shown in blue) than the other two groups.
The results of the student's t-test generated from the GC-TOFMS data are displayed in Figure B1. A Student's t-test was also performed for the LC-MS analysis to provide an overview of the data.