The goal of the linear programming model is to minimize transportation and storage costs across the OEM company's supply chain. One of the main objectives of the supply chain inventory management of the automotive OEM company is to achieve high levels of customer service. The automotive OEM company's customer service level is measured using two performance indices, namely: (i) order ll rate (which is the fraction of customer orders received with current inventory) and (ii) stock-out rate (which is the proportion of customer orders lost due to stockouts).
In the project, this information is used to map the sequence of events in the supply chain of the automotive OEM company.
RESEARCH METHODOLOGY CHAPTER 1. INTRODUCTION
Inventory Management
Document Structure
This chapter first explains the methods used to improve the supply chain business process and general types of inventory control systems. Third, the chapter explains general types of inventory control systems and reviews the literature on multilevel systems. Fourth, the chapter reviews the literature on inventory management techniques used in the automotive industry.
Finally, the chapter explains the approach followed for this project based on findings during the literature review.
Business process improvement in supply chains
MATHEMATICAL MODELLING APPROACHES FOR INVENTORY
Mathematical modelling approaches for inventory op- timisation
Linear Programming
Inventory controlling systems
INVENTORY MANAGEMENT METHODS USED IN THE AUTOMOTIVE
Inventory management methods used in the automo- tive industry
Concluding remarks
Some of these products are free, such as Solver (a Microsoft Excel add-in), while others such as Lingo and Evolver can be purchased. Evolver is a software developed by Palisade, "the maker of the world's leading risk and decision analysis software". Furthermore, Evolver must be purchased if one wants to use it for more than 15 days.
Any type of problem that can be modeled in Excel can be solved by Evolver.
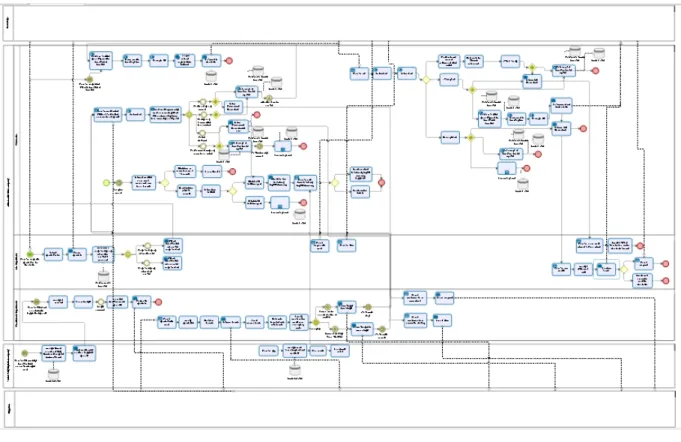
Current Process Mapping
Qualitative data were collected from interviews with the automotive OEM company's aftermarket supply chain manager, the automotive OEM company's Rosslyn warehouse manager, and the inventory optimization manager.
CURRENT PROCESS MAPPING CHAPTER 3. QM DATA ANALYSIS
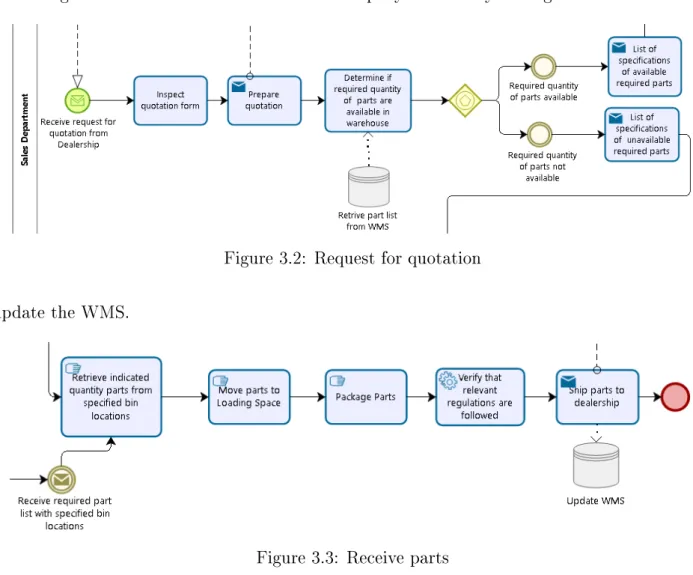
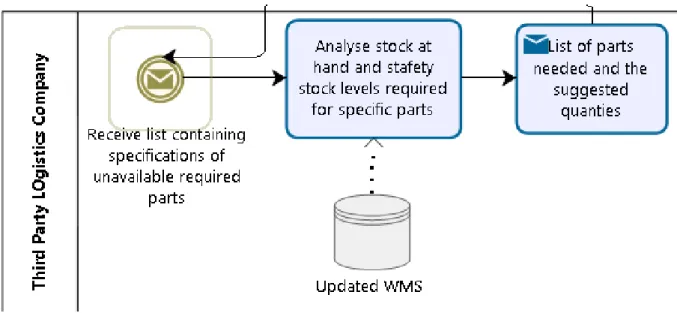
The external logistics provider must compare the list received from the sales department with the available stock according to the WMS system. Thereafter, the third-party logistics service provider must determine the optimal quantity of the necessary parts with regard to the appropriate safety levels. Subsequently, the external logistics service provider must send a list with the optimal quantity of the required specified parts to the purchasing department.
When the purchasing department receives the list of the optimal quantity of the specified parts from the third-party logistics provider (see Figure 3.5), they analyze the list. After that, they check whether the budget is sufficient for obtaining the quantity specified by the third-party logistics provider. Next, the purchasing department makes a final decision on the quantity of parts they want to order, before requesting quotes from the suppliers.
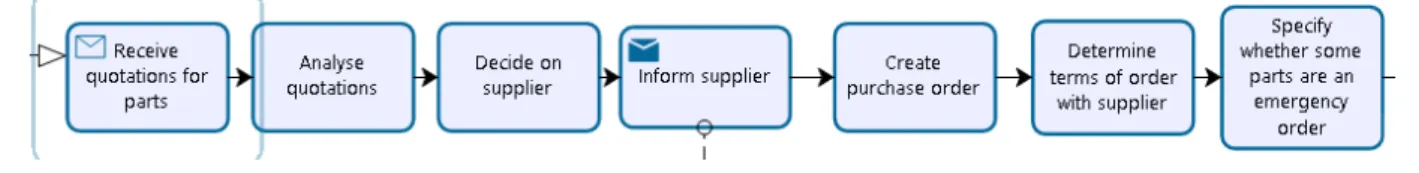
After receiving quotes for the parts needed, the purchasing department analyzes the quotes to determine from which supplier the automotive OEM company will purchase the needed parts (see Figure 3-6). As soon as the purchasing department determines from which supplier they will purchase the necessary parts, they inform the supplier and create a purchase order. After that, the purchasing department must determine the order terms with the supplier and indicate whether the purchase of the necessary parts was an emergency or not.
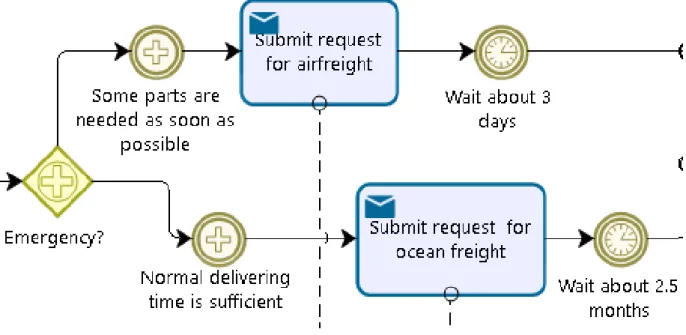
QM DATA ANALYSIS If the procurement of the necessary parts is an emergency, the supplier must send the parts.
CURRENT PROCESS MAPPING CHAPTER 3. QM DATA ANALYSIS If the procurement of the required parts is an emergency, the supplier has to send the parts
CURRENT PROCESS MAPPING CHAPTER 3. QM DATA ANALYSIS In which case the warehouse managers inform the purchasing department that they are
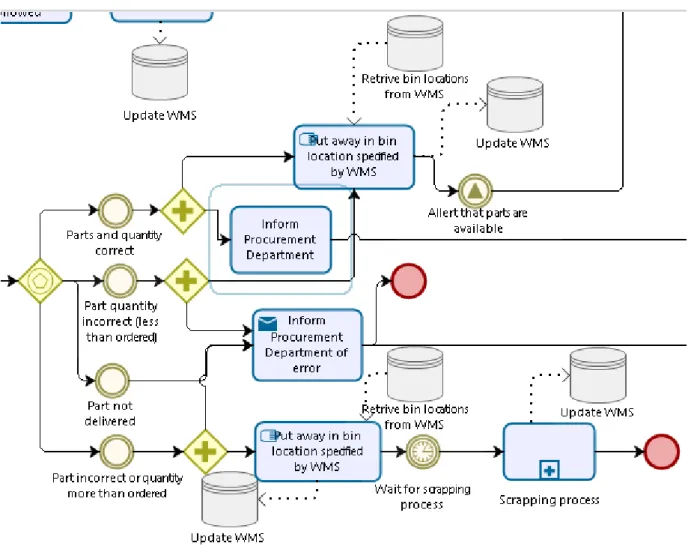
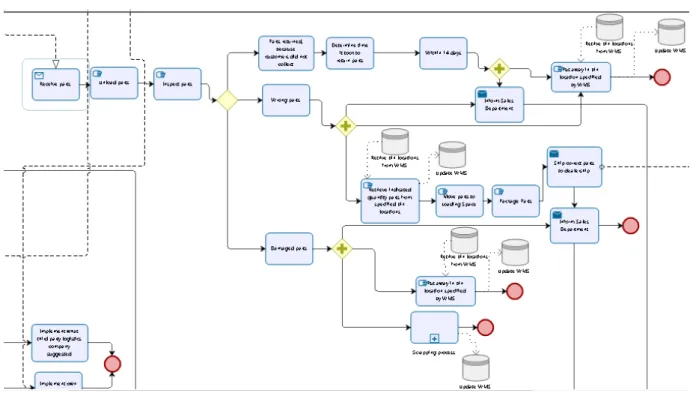
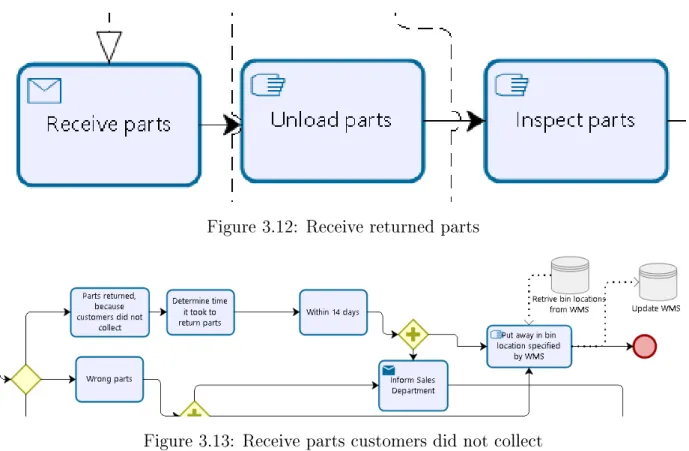
The incoming warehouse workers unload the parts returned from the dealers for inspection (see Figure 3.12). The dealers are allowed to return parts that their customers have not collected within 14 days from the date they received the parts from the warehouse department of the automotive OEM company (see Figure 3.13). If the dealers return parts within the stipulated 14 days, the warehouse employees place the parts in the bins indicated by the WMS, update the WMS and inform the sales department.
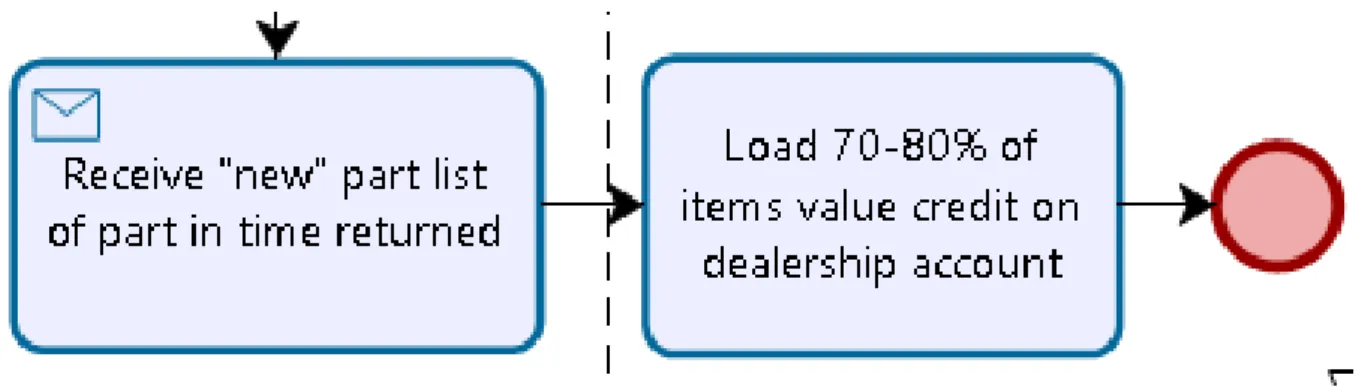
If the parts are returned within 14 days of the date the dealer received the parts, the sales department receives a "new" list of parts and charges 70-80% of the amount received from the dealer for the parts procurement as a credit to the sellers account (see Figure 3.14). If the warehouse sent the wrong parts to the vendors and they return the parts to the warehousing department of the automotive OEM company (see Figure 3.15). Outbound warehouse workers then update the WMS after receiving the required quantity of parts of the representation types from the bin location declared by the WMS and move these parts to the loading area, where the parts are packed according to the vendors' requirements and sent to the sellers.
Upon arrival of damaged parts from the dealership, the warehouse manager notifies the commercial, and the employees in the inbound warehouse place the parts in the containers specified by the WMS and update the WMS. The sales department receives a "new" parts list from the warehouse department if the dealer has returned damaged or incorrect parts (see Figure 3.17) and sends the dealer a new invoice after comparing the cost difference between the payments received for those parts. parts and the actual cost of the parts requested by the dealer. Once a month, the warehouse managers of an automotive OEM check whether parts have been sold in the last 12 months (see Figure 3.19).
If the parts have been sold within the past four years, then the warehouse managers should. If the parts have not been sold in the past four years, the parts must be scrapped.

ACCUMULATED INVENTORY CHAPTER 3. QM DATA ANALYSIS
SUGGESTED INVENTORY MANAGEMENT IMPROVEMENTS CHAPTER 3. QM DATA ANALYSIS
Suggested Inventory Management Improvements
SUGGESTED INEFFICIECY IMPROVEMENTSCHAPTER 3. QM DATA ANALYSIS with each other, but should rather connect the warehouse with each of the dealerships
Suggested Ineciecy Improvements
Minor Improvements
SUGGESTED INEFFICIECY IMPROVEMENTSCHAPTER 3. QM DATA ANALYSIS
The Scrapping Process
The current cutting process is mapped as a subprocess in the inventory management diagram (see Figure 3.27). Sections of process control are highlighted (see Figures 3.28 to Figure 3.29) to show how the cutting process can be improved. One of the major problems with the current inventory management process is that parts that have been depreciated are left in storage for three years before being removed (scrap) (see Figure 3.28).
The advantage of this is that the waste of resources allocated to obsolete parts within the supply chain is minimised. If parts are written off and not scrapped, this can lead to large amounts of SLOB inventory within the supply chain of the automotive OEM company, increasing resource wastage. In the demolition process, verification that proper demolition guidelines and policies are being followed is very important (Western Illinois University, 2008).
Concluding Remarks
CONCLUDING REMARKS CHAPTER 3. QM DATA ANALYSIS by implementing a regular scrapping processes, improving the management of SLOB inventory
As mentioned in the literature review, mathematical modeling is often used for inventory control problems. Linear programming is a mathematical modeling approach that enables decision makers to find the optimal course of action for complex problems, including inventory control problems (Winston, Venkataramanan, and Goldberg 2003). This chapter focuses on developing an LP to optimize inventory levels in the supply chain of the automotive OEM company.
The model incorporates medium and fast moving inventories as the supply chain does not need to order SLOB inventory. The chapter describes the LP model, as well as its assumptions, formulation, objective function and limitations.
Model Introduction
Model Description
Dealers may return the following types of parts to the warehouse: (i) wrong parts, (ii) damaged parts, or (iii) parts not collected by the customer within 14 days. After receiving parts from the dealers, the OEM warehouse must resend the correct parts to the dealer and destroy or give away damaged parts.
Model Assumptions
FORMULATION CHAPTER 4. QUANTITATIVE DATA ANALYSIS
Model Formulation
Sets
The three groups that are defined for this linear programming model are as follows: The first group I, consists of 180 values representing the type of inventory. The second set J, consists of two values, where = 1 is the dealer and j = 2 is the warehouse. The first group of variables are the product variables, the second group the nance variables and the third the capacity volume and distance.

FORMULATION CHAPTER 4. QUANTITATIVE DATA ANALYSIS Sets J and T are described below
Variables
FORMULATION CHAPTER 4. QUANTITATIVE DATA ANALYSIS Capacity, Volume and Distance
Objective Function
FORMULATION CHAPTER 4. QUANTITATIVE DATA ANALYSIS ordered at any of the two locations, (x) shortage cost due to demand not fullled obtained by
Constraints
Solving the Linear Programming Model
QUANTITATIVE DATA ANALYSIS The LP model estimates that a combination of and 5301 parts should The LP model estimates that a combination of and 5301 parts should respectively be ordered from the warehouse in the first period, the second period, the third period, and the fourth period to minimize transportation and warehousing costs across the automotive OEM supply chain. Since the parts in the model are sorted from the highest volume of sales in the periods to the lowest volume of sales, the LP model suggests that each of the time periods order 760 spark plugs respectively. Although the LP model incorporates only medium- and fast-moving goods, the automotive industry does not sell goods as often as various other businesses, for reasons often cited.
The LP model estimated that and 19% of the parts in each of the respective periods are not ordered during these periods. The exact order amounts of each of the 180 parts for each of the four periods can be seen in Appendix 2.
Model Validation
Recommendations
CONCLUDING REMARKS CHAPTER 4. QUANTITATIVE DATA ANALYSIS
Concluding Remarks
Conclusion
Future Studies
If these parts can be reduced by implementing regular scrapping processes, the inventory management process will function more effectively and save large amounts of money. Thus, instead of running multiple tests on a deterministic linear program, as done in the current project, a stochastic model can be used to verify this model's results. Second, the OEM company can formulate an alternative study that uses geographic linear programming.
This can be done to optimize the supply chain management process to see if the current supply chain "setup" is the optimal setup or not. Second, the OEM car company can build a warehouse in each of the cities with many dealers, such as Durban, Cape Town, East London and Port Elizabeth.
Estimate Warehouse Orders
ESTIMATE WAREHOUSE ORDERS APPENDIX B. ESTIMATED WAREHOUSE ORDERS AND DEALERSHIP SALES