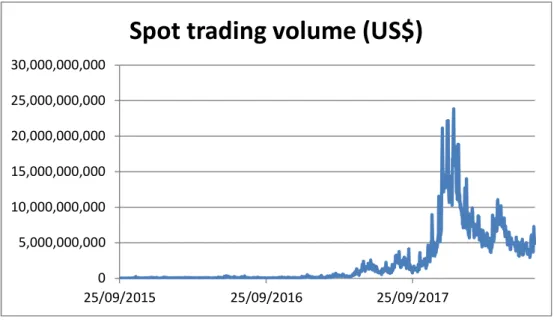
The study used, among other tests, an ARCH(1) and Granger causality test and found that spot trading volumes had a significant positive effect on price volatility during the study period. The study also found that in the year of the introduction of Bitmex derivatives contracts, derivatives trading had a significant negative effect on Bitcoin price volatility.
Introduction
The purpose and function of Bitcoin
Bitcoin opportunities and challenges
4 The Lightning Network would allow Bitcoin transaction fees to be fractions of a cent, as well as millions of transactions per second. second can be handled immediately.
Bitcoin as a currency
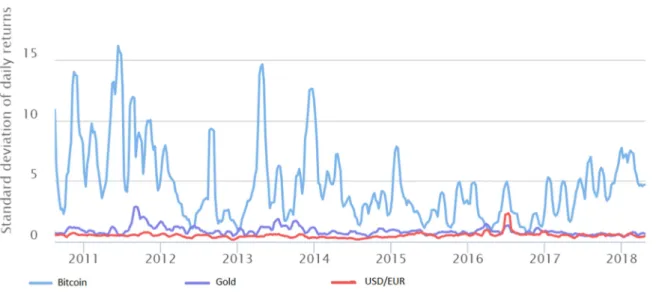
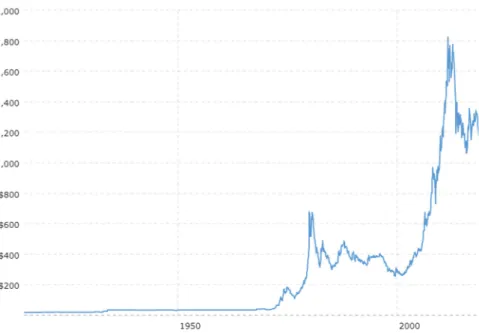
As can be seen in the figure above, the volatility of the US$/Gold price has also increased significantly since countries abandoned the gold standard, particularly the US in 1971. It can be argued that in the 1970s, when the US abandoned the gold standard, they essentially created a new unsecured currency.
Ways of stabilising Bitcoin
Monetary policy
Stable coins
By keeping USD in escrow, it is easy to audit, but also vulnerable to government intervention. ReserveCoin also attempts to create a stable peg to the USD dollar by using a reserve of various cryptocurrencies and then issuing/retiring tokens on only a portion of the reserve.
Speculation
It is therefore not clear whether the increased volume of speculation has affected Bitcoin's price volatility in recent years. Shi (2018) found a dampening effect on the spot price of Bitcoin in the first 2 weeks after the launch of CBOE futures contracts.
Contribution to business
9 The research problem addressed in this report is to determine the effect that Bitcoin spot trading volume has on Bitcoin price volatility and then to determine the effect that Bitcoin derivatives trading volume has on Bitcoin spot price volatility in particular.
Contribution to literature
The scope of the study
The purpose of this paper
Introduction
What is Bitcoin
However, some parties argue that Bitcoin is not as decentralized as it is made out to be. In general, however, it can be argued that Bitcoin is less anonymous than existing cash such as paper notes (Antonopoulos, 2014).
Bitcoin’s value as a currency
However, he found that bitcoin has similar characteristics to traditional currencies in China and the United States. He adds that bitcoin plays an important role in financial markets and portfolio risk management.
Bitcoin as a hedge and safe haven
Bitcoin volatility
In contrast, Conrad, Custovic and Ghysels (2018) used a GARCH-MIDAS model and found that Bitcoin price volatility is closely linked to real activity in the global economy and therefore not just speculation. Symitsi and Chalvatzis (2018) also suggested that Bitcoin and stock indices are linked when presented with shock events.
Bitcoin bubbles
They found evidence of co-explosiveness in both directions (up and down) among cryptocurrencies, but not specifically from Bitcoin to smaller currencies. However, he found no method for using this knowledge to predict the next day's volatility or returns.
Volatility and monetary policy
He found that volatility and trading on a given day strongly influence attention on subsequent days. It is also evident that the demand for Bitcoin still fluctuates wildly, which means that it does not meet the conditions laid out by Friedman (1969).
Spot market trading volume and volatility
For Bitcoin specifically Blau (2017) tested whether price volatility is the result of speculative spot trading during 2013 and found that it is not. The only research found that attempted to find an effect between spot trading volume and volatility for the Bitcoin market specifically is by Balcilar et al.
Derivative trading and its effect on volatility
Bohl, Diesteldorf and Siklos (2015) agree and examined the effect that the introduction of derivatives in the Chinese futures market had on the spot volatility of the Chinese, Singapore and Hong Kong stock markets. Bohl, Salm and Wilfling (2011) also investigated whether the introduction of futures derivatives trading had an effect on the Polish stock market.
Derivatives’ effect on Bitcoin price stability
However, they did mention that the derivatives market can increase spot market volatility if derivatives speculators are uninformed, thereby creating noise in the price discovery process. More studies concluded that the derivatives market reduced the volatility of the spot price of the underlying asset or instrument than studies concluded the opposite, but under certain circumstances it can go either way or have no impact at all. Because there is little literature on the subject of how derivatives trading volumes specifically affect Bitcoin spot market volatility, it is prudent to test the effect of derivatives traded volume on Bitcoin's spot price volatility over a longer period of time to determine whether the introduction of derivatives contracts could help Bitcoin reduce its volatility going forward.
Hedging strategies
They also did not use data from Bitmex, which actually has the largest volume of derivative contracts (Table 1).
Conclusion
Introduction
Research methodology and design
Population
Unit of analysis
Sampling method and sample size
Daily data on all Bitmex historical derivative contracts trading volume (both futures and swaps) (Bitmex, 2018). Although the CME futures and CBOE futures are more commonly used among institutional investors, the table below shows how Bitmex has traded significantly more volumes for recent derivative contracts. This means the time series data had 1696 daily observations for the first hypothesis and 1035 observations for the second hypothesis.

Measurement instruments and data collection tool
- Standard deviation
- Histogram using the historical returns performance
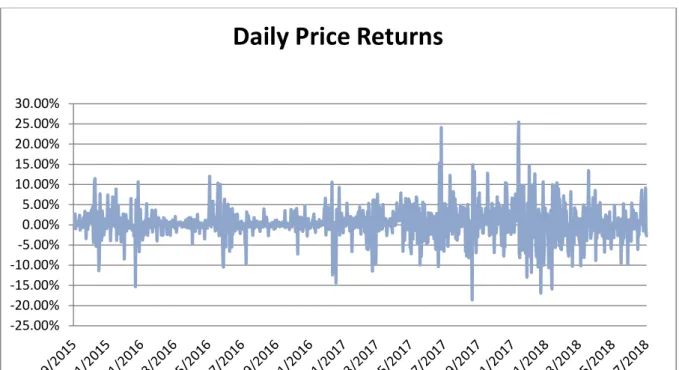
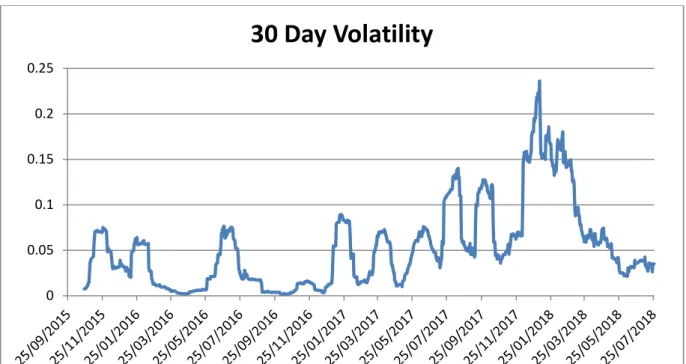
- Historical realised volatility method
- ARCH methods
- Other volatility measurements
29 The first reason is that time-series data, such as investments and specifically Bitcoin, are typically skewed. The second reason is that time series data for Bitcoin typically shows leptokurtosis, meaning that the tails of the return distribution are typically thick. Long memory and structural breaks in the time series data are also two important elements in modeling.
Data gathering process and collection method
2017) found that the IGARCH and GJRGARCH models are optimal for modeling returns in most major cryptocurrencies. This research therefore tried to fit the best available model to the data in the time available and found that a 1-year lagged ARCH model is appropriate as shown by the formula below. Although GARCH models are currently the most widely used model to model bitcoin volatility, as noted above, their limitation is that it does not properly model for asymmetry and non-linearity in volatility data.
Data analysis approach
Trend analysis was also performed to determine trends in the underlying data and to examine the relationships of the variables over time. Due to the detected presence of white noise, further tests were performed to check for stationarity or roots of unity in the data set. To test for the ARCH effect, we tested whether there is a serial correlation of the heteroskedasticity.
Strategies to ensure quality of data
The ARCH model was also run annually in an attempt to gain insight into the relationships across different price regimes and times. Finally a Granger test analysis was done to confirm the Granger causality between the two time series and to determine the direction of the effect if in fact there is an effect between the two (Granger, 1981). The test applied an ordinary least square model to determine whether unidirectional causality exists between time series data sets.
Research ethics
The Granger test suggests that when the coefficients are significantly different from zero at a given significance level, one variable can Granger cause the other.
Research limitations
The purpose of this research is to ascertain whether Bitcoin trading volumes (both spot and derivative) have an effect on Bitcoin volatility and therefore determine the likelihood that Bitcoin volatility will decrease in the future if trading volumes increase. The chapter begins with descriptive statistics, followed by time series tests (Portmanteau white noise, Dick Fuller tests for stationarity, and unit root tests).
Hypothesis 1
- Descriptive statistics
- Transforming non-normal distribution of primary data
- Distribution Normality
- Scatter plots
- Trends Analysis
- Autocorrelation and stationarity tests
- Unit Roots Test: Dickey-Fuller (DF)
- Johansen tests for co-integration
- Autoregressive Conditional Heteroskedasticity (ARCH) method
- Granger Causality test
The Ljung-Box-Pierce portmanteau test was performed to test for autocorrelation between variables (white noise) in the data, which affects the future validity of the results. The cointegration test below (Table 7) investigates the correlations between several time series variables in the long run. The ARCH model will be run annually to try to gain better insight into changes in effect and the potential effects of regime changes and structural breaks in price.
Hypothesis 2
- Descriptive statistics
- Transforming non-normal distribution of primary data
- Distribution Normality
- Scatter plot
- Trends Analysis
- Autocorrelation and stationarity tests
- Unit Roots Test: Dickey-Fuller (DF)
- Johansen tests for co-integration
- Autoregressive Conditional Heteroskedasticity (ARCH) method
- Granger causality test
Daily Returns: Trading Volume of Bitcoin Derivatives has p-values less than 5%; hence the Granger test null hypothesis is rejected. A conclusion is drawn that the trading volume of Bitcoin derivatives had a long-term relationship with Daily Returns. A conclusion is drawn that the trading volume of Bitcoin derivatives and Daily Returns had a long-term relationship with Daily Log Returns (volatility).

Results on reliability and validity of the data
Bitcoin Derivatives Trading Volume: Prices, Daily Returns, Daily Daily Returns (Volatility) all have p-values less than 5%. These endogenous factors were found to be related to the trading volume of Bitcoin derivatives in the long run in this study. Daily Daily Returns (Volatility): Bitcoin derivative trading volume and daily returns had p-values of less than 5%; therefore, the null hypothesis of the Granger test is rejected.
Bitcoin Price
This chapter will discuss the results of the statistical tests carried out in chapter 4 and their possible implications. It will then discuss the results of the hypothesis tests used to determine whether there are relationships between spot and derivative trading volumes and Bitcoin price volatility.
Absolute Bitcoin Price Daily Returns
Bitcoin Spot trading volume
Bitcoin Derivative trading volume
Bitcoin volatility
This resulted in speculation that institutional investors will significantly increase the price of Bitcoin in the future. The study shows that the Bitcoin price went through a volatile period of bubbles and anti-bubbles from mid-2017 to early 2018, as defined by Cheung et al. Although the study period by Su et al. 2018) ended before the last mentioned bubble, this also supports their views.
Means over time
Due to the methodology used in this study, the concerns of Pieters and Vivanco (2017) about differences in volatility between exchanges have been avoided since the Coinmarketcap index was used.
Data normality
63 3 showed that the transformed data was more consistent with normality in terms of standard deviations and kurtosis. The non-normal distribution of the data is an indication of non-stationarity in the data series, meaning that there is no strong trend. This indicated that non-parametric statistical tests should be performed, which was expected since literature in the study of Bitcoin volatility almost exclusively uses non-parametric tests (Katsiampa, 2017; Peng et al., 2018; Dyhrberg, 2016a; Dyhrberg, 2016b; Bouoiyour & Selmi, 2016).
Hypothesis 1
- Scatter Plots
- Tests for white noise and unit roots
- Tests for co-integration
- ARCH Analysis
- Granger-causality test
- Further Discussion
The null hypothesis that Bitcoin spot trading volume has a negative effect on the price volatility of Bitcoin was rejected by the ARCH analysis. In this case, the null hypothesis was rejected and it was concluded that Bitcoin spot trading volume does not have a negative effect on Bitcoin price volatility. The null hypothesis that Bitcoin spot trading volume has a negative effect on Bitcoin price volatility was rejected by this study.
Hypothesis 2
- Scatter plots
- Tests for white noise and unit roots
- Tests for co-integration
- ARCH Analysis
- Granger-causality test
- Further Discussion
A third possible reason suggested by Bouri et al. 2018) is that volatility ratios depend on the current price regime. The above tests for stationarity and unit roots therefore showed that the ARCH model is appropriate. The fact that derivatives trading volumes had significant effects (either positive or negative) in different years again suggests that the effects may depend on the price regime, as also suggested by Bouri et al.
Principal theoretical findings
Implications for management
With speculation moving into the derivatives market, and the derivatives market showing a small negative (though not significant) effect on volatility, it is conceivable that volatility will decline in the future as derivatives trading increases. However, this author suggests that, due to the advantages of cryptocurrencies, it is likely that, if Bitcoin is not adopted, a 'stable coin' will become the currency of the future. It is not clear whether this stablecoin will be government regulated or algorithmically controlled.
Limitations of the research
Volatility is unlikely to decrease just because of increased spot trading volumes and attention, and will actually increase, as shown by this study. The introduction of derivatives trading contracts shows some signs of reducing volatility in this study; This is due to the value it can extract from existing payment systems such as credit cards, where annual costs in the US alone exceed $90 billion (Fin24, 2018).
Suggestions for future research
Retrieved 2018, from Coindesk: https://www.coindesk.com/ledgerx-sees-7x-jump-in-options-trading-6-months-after-launch/. Retrieved 2018, from Fin24: https://www.fin24.com/Companies/Financial- Services/visa-mastercard-reach-62bn-settlement-on-swipe-fees-20180918. Retrieved 2018, from Bloomberg: https://www.bloomberg.com/gadfly/articles bitcoin-options-would-tame-this-beast.

