For Peer Review Only
A new method for the analysis of soluble and insoluble oxalate
in pulp and paper matrices
Journal: Journal of Wood Chemistry and Technology Manuscript ID: Draft
Manuscript Type: Article Date Submitted by the Author: n/a
Complete List of Authors: Sithole, B.; University of KwaZulu-Natal/CSIR , Forestry and Forest Products Research Centre
Azeez, Akeem; Ekiti State University, Department of Chemistry and Industrial Chemistry
Ramjugernath, Deresh; University of KwaZulu-Natal, Chemical Engineering Keywords: Oxalate, ion chromatography, methanesulphonic acid, calcium oxalate
For Peer Review Only
A new method for the analysis of soluble and insoluble oxalate in pulp and paper matrices
B. Bruce Sithole1*, Akeem M. Azeez2,3 and Deresh Ramjugernath3
1*Forestry and Forest Products Research Centre, University of KwaZulu-Natal/CSIR Natural Resources and the Environment, Durban, South Africa Tel: +27 31 242 2325; Fax: +27 31 261 1216
2Department of Chemistry and Industrial Chemistry, Ekiti State University, Ado-Ekiti, Nigeria
3Discipline of Chemical Engineering, University of KwaZulu-Natal, Durban, South Africa
ABSTRACT
A novel method has been developed for determining soluble and insoluble forms of oxalate in pulp and paper samples by ion chromatography. Methanesulphonic acid is used to dissolve insoluble oxalate, and total oxalate is then determined by ion
chromatography with suppressed conductivity detection. Soluble oxalate is determined directly by ion chromatography, without prior chemical treatment. Insoluble oxalate is obtained by difference. The method was validated and applied to samples of pulp, process liquors, filtrates, and scale deposits from kraft mills. In kraft mills, considerably higher levels of oxalate were found in the Eop samples compared to those in the
brownstock and D0 samples. In both brownstock and Eop samples, oxalate was mainly present in soluble form, whereas the D0-stage contained relatively higher levels of insoluble oxalate. The new method will allow for the evaluation of the effect of process variables on the sources and forms of oxalate in mills, and to assess the effectiveness of various strategies to control oxalate scale deposition.
KEYWORDS
Oxalate, soluble, insoluble, methanesulphonic acid, ion chromatography, pulp and paper
3 4 5 6 7 8 9 10 11 12 13 14 15 16 17 18 19 20 21 22 23 24 25 26 27 28 29 30 31 32 33 34 35 36 37 38 39 40 41 42 43 44 45 46 47 48 49 50 51 52 53 54 55 56
For Peer Review Only
1. INTRODUCTION
Oxalic acid and calcium oxalate are naturally present in both the wood and the bark of plants, including most species of trees [1-6]. While both substances are released from the wood during the various stages of pulp and paper manufacturing, the vast majority of oxalic acid and calcium oxalate present in pulp and paper mills is formed in the pulping and bleaching stages in kraft, primarily via the oxidation of lignin and to a lesser extent carbohydrates [6-10].
The two acid forms (H2C2O4 and HC2O4-
; pK1 = 1.3, pK2 = 4.3) and the fully ionized form of oxalic acid (oxalate, C2O42- or Ox2-) are very soluble in water. On the other hand, calcium oxalate (CaC2O4 or CaOx) is known to form three hydrates (mono-, di- and trihydrate), all of which are only sparingly soluble in water. Under conditions prevailing in pulp and paper mills, calcium oxalate monohydrate (CaC2O4•H2O or COM) is the most thermodynamically stable, and thus the major form of CaOx present in process samples and in oxalate-based scale deposits. As noted earlier, the majority of COM found in mills forms in-situ via the reaction between calcium ions originating primarily from the water and wood supplies, and oxalic acid released from the wood and that which is formed in the pulping and bleaching stages. A number of factors, such as temperature, pH, the presence of organic substances and certain metal ions as well as the ionic strength play significant roles in the solubility of calcium oxalate in model aqueous systems and mill process streams [11-27].
3 4 5 6 7 8 9 10 11 12 13 14 15 16 17 18 19 20 21 22 23 24 25 26 27 28 29 30 31 32 33 34 35 36 37 38 39 40 41 42 43 44 45 46 47 48 49 50 51 52 53 54 55 56
For Peer Review Only
System closure (reduction of fresh water use) is a major goal in most pulp and paper mills. However, its implementation leads to significant increases of dissolved and colloidal substances, including calcium and oxalate ions [19]. This in turn results severe deposition of COM, which forms and accumulates in several locations, such as on the surface of washer wires, within storage tanks, evaporators, pipes, valves, and on papermachine wires and papermachine felts [28]. Such deposition leads to upsets in mill process operations, and causes frequent shutdowns specifically for the purpose of descaling equipment. The shutdowns result in significant economic losses in terms of lost production and cleaning costs for the affected mills. Despite considerable published work on calcium oxalate formation and scaling, knowledge of the factors that aggravate scaling under mill conditions is still incomplete. In addition, there is no reliable and simple laboratory method available for predicting the propensity for CaOx scale formation or for assessing the efficacy of scale control additives and strategies in reducing CaOx scale formation in mills. Availability of reliable methods for measuring the soluble and, in particular the insoluble forms of oxalate, is a prerequisite to better understanding and control of calcium oxalate scale deposition more effectively. In the case of pulp and paper applications, only a few analytical methods have been published to date [6, 29, 30]
. In some cases, the methods involve a lengthy sample preparation step, may be time consuming or they may not have been validated. The current work reports on the development of a new and reliable method for measuring soluble and insoluble forms of oxalate in pulp and paper matrices; the method is based on ion chromatography (IC).
3 4 5 6 7 8 9 10 11 12 13 14 15 16 17 18 19 20 21 22 23 24 25 26 27 28 29 30 31 32 33 34 35 36 37 38 39 40 41 42 43 44 45 46 47 48 49 50 51 52 53 54 55 56
For Peer Review Only
2. EXPERIMENTAL 2.1 Instrumentation
All IC analyses were performed with a DX-600 ion chromatographic system (Dionex, Sunnyvale, CA, USA) consisting of a gradient pump (GP 50), a chromatographic module (LC 20), which housed a Rheodyne injection valve fitted with a 25 µL sample loop;
separation columns; an ASRS ULTRA-II anion suppressor (4 mm); a thermostated conductivity cell, which was controlled by an ED 50 module; and an AS 40 autosampler, into which all standards and samples are placed for injection into the IC.
2.2 Columns and separation conditions
Separations were performed with Dionex IonPac AG4 guard (4 x 50 mm) and IonPac AS4 analytical columns (4 x 250 mm) connected in series. An eluent comprised of 2.25 mM Na2CO3 and 2.8 mM NaHCO3 was used for the separation of oxalate from other anions present in the samples and was delivered to the columns at a flow rate of 1.50 mL/min (nominal operating pressure ca. 750 psi). All separations were conducted at ambient room temperature (ca. 18-23 ºC). A Dionex in-line filter apparatus containing two 5µm filters was placed upstream from the inlet of the guard column to remove particulates from the flow stream.
A regenerant consisting of 25mM H2SO4 (prepared by dilution of standard 2M H2SO4 in Milli-Q water) was delivered to the suppressor at a flow rate of 4 mL/min (background conductivity ca. 17.5 µS). High purity He was used to pressurize the eluent and
3 4 5 6 7 8 9 10 11 12 13 14 15 16 17 18 19 20 21 22 23 24 25 26 27 28 29 30 31 32 33 34 35 36 37 38 39 40 41 42 43 44 45 46 47 48 49 50 51 52 53 54 55 56
For Peer Review Only
regenerant reservoirs, and to actuate the sample injection valve. Instrument control and data acquisition were performed using Chromeleon® software (version 6.5 SP-1, Dionex).
2.3 Reagents
Reagent grade sodium oxalate (Na2C2O4), sodium carbonate, (Na2CO3), sodium hydrogen carbonate, (NaHCO3), calcium chloride dihydrate (CaCl2•2H2O), methanesulphonic acid (CH3SO3H, MSA) and Amberlite IR-120 cation-exchange resin (H-form) were purchased from Aldrich Chemical Company Inc. (Milwaukee, WI, USA). A combined five anion standard solution containing chloride, nitrite, phosphate, nitrate and sulphate was
obtained from Dionex and diluted in water to prepare calibration standards. Several forms of high purity calcium oxalate, including CaC2O4, CaC2O4•H2O and CaC2O4•2H2O were used. High purity 18 MΩ water was obtained from a Millipore Milli-Q Plus water purification system (Bedford, MA, USA) and used in all aspects of the study.
2.4 Preparation of standards
A stock standard solution containing 1000 mg/L C2O42-
was prepared by dissolving an appropriate and accurately known mass of reagent grade Na2C2O4 in 100 mL of Milli-Q water. The solution was stable for at least six months when stored in the dark at room temperature. Initially, dilute oxalate standards, with concentrations ranging between 0.1 and 25 mg/L, were prepared in water and in various concentrations of aqueous MSA (0.25-7.5% v/v) to assess its effect on the separation of and detector response to oxalate.
Regardless of the solvent used for dilution, all standards were prepared fresh daily by diluting aliquots of stock oxalate solution to volume with and without MSA added. A
3 4 5 6 7 8 9 10 11 12 13 14 15 16 17 18 19 20 21 22 23 24 25 26 27 28 29 30 31 32 33 34 35 36 37 38 39 40 41 42 43 44 45 46 47 48 49 50 51 52 53 54 55 56
For Peer Review Only
series of six anion standard solutions ranging in concentration between 0.1 and 25 mg/L of oxalate and containing, chloride, nitrite, phosphate, nitrate, sulphate and oxalate in water were prepared by combining aliquots of Dionex standard five anion stock with the oxalate stock in a volumetric flask followed by dilution to volume with water. Oxalate and/or mixed standards were placed in autosampler tubes and injected into the IC, via the autosampler, at the beginning and the end of each day to obtain calibration plots for oxalate and the other anions mentioned above. Such plots were found to be linear for oxalate and for the other anions studied, over the concentration range specified above, and were used to determine the concentration of oxalate in a sample. A standard solution of anions was injected after every fourth sample to verify the performance of the IC system.
2.5 Sample collection and storage
Samples were collected from kraft mills: they included vat samples from the brownstock, D0- and Eop-stage washers. All samples were collected and stored in polypropylene bottles and refrigerated (at 4oC) when not in use. The temperature and pH of each sample were recorded at the time of sampling. The moisture content of wood chips, pulp and pulp slurries were determined by thoroughly drying a small portion of each sample at 105
°C in a hot air oven for at least 6 hours. Wood chips were ground to a fine powder with the aid of a Wiley mill.
2.6 Analysis of total oxalate in pulp and paper samples
3 4 5 6 7 8 9 10 11 12 13 14 15 16 17 18 19 20 21 22 23 24 25 26 27 28 29 30 31 32 33 34 35 36 37 38 39 40 41 42 43 44 45 46 47 48 49 50 51 52 53 54 55 56
For Peer Review Only
The novel aspect of the reported entails using MSA to rapidly and completely dissolve insoluble forms of oxalate, which is mainly present as COM in the case of pulp and paper samples. MSA is a strong acid with a pKa value of -1.9 at 25°C, which forms soluble complexes with many metals [31, 32]. In addition, MSA has a relatively high boiling point, a low vapor pressure, does not produce volatile gases when exposed to moist air or when diluted in water, has low toxicity and is biodegradable [31]. In practical terms, this means that MSA can be handled and disposed of with relative ease, which is not the case with other acids commonly used for this purpose.
This new approach for measuring total oxalate allows the evaluation of the effect of process variables on the forms and partitioning of oxalate in mills, and the assessment of the effectiveness of various strategies to control oxalate scale deposition.
2.7 Total oxalate
2.7.1 Process filtrates and effluents
It is important to mix the samples well to establish and maintain, as closely as possible, the same equilibrium concentrations of dissolved and soluble forms of oxalate that
existed under mill conditions at the time of sampling. Consequently, prior to sampling for oxalate analysis by IC, the samples were mixed thoroughly and warmed to the
temperature prevailing at each sampling location. For the determination of total oxalate in process filtrates and effluents, refrigerated samples were first warmed to the temperature at which they were collected and mixed thoroughly for 5-10 minutes. An accurately
3 4 5 6 7 8 9 10 11 12 13 14 15 16 17 18 19 20 21 22 23 24 25 26 27 28 29 30 31 32 33 34 35 36 37 38 39 40 41 42 43 44 45 46 47 48 49 50 51 52 53 54 55 56
For Peer Review Only
known volume (25 mL) or mass (25 g) of sample was then placed in a 50 mL Pyrex beaker to which was added 0.60 mL MSA - the purpose of which is to dissolve all insoluble forms of oxalate. The beaker was covered with Parafilm, placed on a magnetic stirrer/hotplate and the contents were stirred vigorously with the aid of a Teflon-coated stirring bar for 30 minutes at 60 °C. During the dissolution step, the MSA concentration was ca. 2.5% v/v and the pH of the mixture was ≤ 1. After 30 minutes, the beaker and its contents were removed from the hot plate, allowed to cool briefly, and quantitatively transferred to a volumetric flask. If necessary, additional MSA was added to the flask before dilution to volume so that the final concentration of MSA was approximately 0.5%
v/v. In most cases sample dilution was in the range of 1:20. An aliquot was taken from the volumetric flask, filtered through a 0.45 µm membrane filter and delivered to an autosampler tube for injection into the ion chromatograph. It is important to note that in the case of total oxalate analysis, the MSA concentration in the diluted samples should be maintained at or below 0.5% v/v. Therefore, if sample dilution is needed to bring the peak area of oxalate within the linear range of the calibration plot, sufficient MSA must be added during the dilution step so that 0.5% MSA is present once the final dilution has been made.
2.7.2 Pulp, pulp slurries, wood chips and scale deposits
Into a 150 mL Pyrex beaker was added an accurately known mass of both sample (ca. 2 g) and water (ca. 100 g), 2.5 mL of MSA and a Teflon-coated stirring bar. The beaker was covered with Parafilm, placed on a magnetic stirrer/hot plate and the contents were vigorously mixed for 30 minutes at ca. 60 °C. Following the prescribed mixing period,
3 4 5 6 7 8 9 10 11 12 13 14 15 16 17 18 19 20 21 22 23 24 25 26 27 28 29 30 31 32 33 34 35 36 37 38 39 40 41 42 43 44 45 46 47 48 49 50 51 52 53 54 55 56
For Peer Review Only
the sample was processed further (filtered and diluted) as described in section (i) above.
Portions of pulp slurries were centrifuged to enable separation of fibre-free supernatant.
2.8 Soluble oxalate
2.8.1 Process filtrates and effluents
Approximately 8 mL of warmed process filtrate or effluent was transferred to a 10 mL polypropylene syringe, to which was attached, via luer lock fittings, a Millex-LCR 0.45 µm x 25 mm PTFE membrane filter (Millipore, Bedford, MA, USA). The contents of the syringe were forced through the membrane filter and the last 5 mL of filtered sample was collected in a small glass vial. Filtration through a 0.45 µm membrane was performed to remove insoluble forms of oxalate present in the sample. An accurately known volume of the filtered sample was transferred to a volumetric flask and diluted to volume with water. A portion of the filtered, diluted sample was then transferred to an autosampler tube for injection into the ion chromatograph.
2.8.2 Pulp, pulp slurries, wood chips and scale deposits
Pulp, pulp slurries, wood chips and scale deposits were first heated, mixed and/or ground as described in section (iii), and then processed further as described in sections (ii) and (iii), except that no MSA was added to the samples.
3. RESULTS AND DISCUSSION
3 4 5 6 7 8 9 10 11 12 13 14 15 16 17 18 19 20 21 22 23 24 25 26 27 28 29 30 31 32 33 34 35 36 37 38 39 40 41 42 43 44 45 46 47 48 49 50 51 52 53 54 55 56
For Peer Review Only
3.1 Analysis of soluble oxalate
Ion chromatography (IC) coupled with conductivity detection is well suited for analyzing soluble, low molecular weight inorganic and organic ions in aqueous solutions. Over the years, several columns and eluent systems have been developed which afford good separation of oxalic acid and/or oxalate anion in aqueous samples. The columns and separation conditions chosen and used in this work are similar to those recommended by Dionex for the analysis of common anions. The separation of standard solutions of oxalate by itself and in combination with other anions prepared in water is shown in Figure 1. As illustrated, the common anions found in pulp and paper mill samples are well resolved and elute in less than 15 minutes.
3.2 Dissolution of insoluble oxalate
One of the major requirements for the analysis of total oxalate was to find a reliable method for dissolving the insoluble forms of oxalate. It has been reported that MSA can dissolve oxalate at room temperature. The effectiveness of MSA when compared to inorganic, non oxidizing acids such as HCl, is that MSA forms a stable, water-soluble complex with several metals, including calcium [31,32] to yield calcium
methanesulphonate, (CH3SO3)2Ca) as illustrated by its reaction with COM in reaction 1, whereas HCl reacts more slowly with COM to form oxalic acid and calcium chloride.
The oxalic acid formed from reaction 1 may ionize to different extents, depending upon the pH, and exist in one or more forms (all of which are soluble) as shown in reaction 2.
2 CH3SO3H + CaC2O4•H2O ↔ (CH3SO3)2Ca + H2C2O4 + H2O (1) H2C2O4 + H2O ↔ H C2O4-
+ H+ ↔ C2O42-
+ H+ (2)
3 4 5 6 7 8 9 10 11 12 13 14 15 16 17 18 19 20 21 22 23 24 25 26 27 28 29 30 31 32 33 34 35 36 37 38 39 40 41 42 43 44 45 46 47 48 49 50 51 52 53 54 55 56
For Peer Review Only
3.3 Application of MSA in IC analysis of total oxalate
Repeated injections of aqueous MSA solutions ranging in concentration from 0.1 to 5%
(v/v) were made to test the compatibility of MSA with the IC column. The results showed that the retention time, peak area and peak shape of oxalate standards prepared in water and aqueous MSA were essentially identical, thus implying that MSA was fully
compatible and did not degrade the IC column or suppression system. A single peak attributable to methanesulphonate (CH3SO3-
or MS-) eluted in or near the water dip and thus was not retained by the column. In addition, a small peak eluted at the same retention time as sulphate, which is probably a minor artifact from manufacture of the MSA [31]. However, as shown in Figure 2, the elution of the oxalate ion is not affected by the presence of MSA or any other anions present in the sample. Calibrations curves for the analysis of oxalate in the presence of 0.5% v/v MSA showed that the presence of 0.5% or less MSA in the standards did not significantly affect the response of the conductivity detector to oxalate and a strong linear relationship was found over the concentration range studied (Figure 3).
Conditions necessary to effect complete dissolution of aqueous suspensions of calcium oxalate with MSA, we studied by varying the concentration of calcium oxalate and the mixing time under constant MSA and temperature conditions. The calcium oxalate suspensions were prepared by combining equal volumes of equimolar solutions of calcium chloride and sodium oxalate in a constant final volume of water. The resultant aqueous suspensions of calcium oxalate were then mixed vigorously on a hot plate for
3 4 5 6 7 8 9 10 11 12 13 14 15 16 17 18 19 20 21 22 23 24 25 26 27 28 29 30 31 32 33 34 35 36 37 38 39 40 41 42 43 44 45 46 47 48 49 50 51 52 53 54 55 56
For Peer Review Only
five minutes at 60 °C, and then a known volume of MSA was added and the suspensions were mixed for an additional 0, 5, 10, 20 and 30 minutes. Samples of the suspensions were taken at each interval, filtered through 0.45 µm PTFE membrane filters and the filtrates were diluted and analyzed to determine the concentration of oxalate present. As summarized in Table 1, high concentrations of calcium oxalate, well beyond the levels expected to be present in most pulp and paper mill process samples, were dissolved within 5 minutes. These findings suggest that MSA will dissolve COM in any type of pulp and paper sample.
3.4 Analysis of kraft mill samples
Vat samples from the last brownstock (BStock), the D0 and EoP, D1 and D2 washers were collected from three kraft mills and analyzed for soluble and insoluble oxalate content.
As shown in Table 2 for mills A and B samples, the concentration of soluble and insoluble oxalate varied considerable between mills A and B and between the various stages. For example, the brownstock sample in Mill A contained nearly 2.5 times more soluble oxalate than the same stage in mill B. However, the percentage of insoluble oxalate was much lower in mill A brownstock than in the corresponding mill B sample.
The oxalate present in the brownstock samples originates from the wood supply and that which is formed by the degradation of lignin and carbohydrates during pulping. Both D0
vat samples contained less oxalate that the corresponding brownstock samples, and both samples contained a high percentage of insoluble oxalate, which in the case of the mill B sample, exceeded the level of soluble oxalate. The highest levels of oxalate were found in
3 4 5 6 7 8 9 10 11 12 13 14 15 16 17 18 19 20 21 22 23 24 25 26 27 28 29 30 31 32 33 34 35 36 37 38 39 40 41 42 43 44 45 46 47 48 49 50 51 52 53 54 55 56
For Peer Review Only
the EOP vat samples, which contained 3-5 times more soluble oxalate than D0 vat samples. The EOP vat samples also contained the least insoluble oxalate.
Selected samples were spiked with soluble and insoluble forms of oxalate to determine the accuracy of our method. As also shown in Table 2, the recoveries for both forms of oxalate ranged from 95-105%, which indicates that the method is suitable for quantitative analysis in both acidic and alkaline process samples. Figure 4 shows the separation of soluble oxalate from other anions in D0 and EOP vat samples from mill A. Figure 5 shows the separation of total oxalate from other anions in a D0 sample from mill A. In both separations, it is clear that oxalate is well resolved from other anions and free from interferences in both types of samples.
3.5 Comparison of methods for the analysis of total oxalate
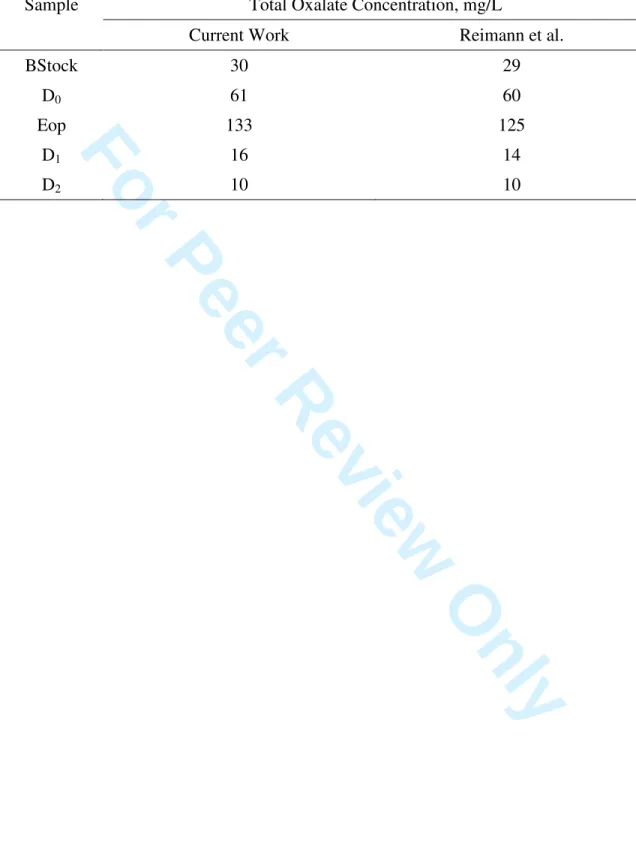
To our knowledge, the only other published IC method for determining oxalate in pulp and paper samples is that of Reimann et al. [29]. Their method was developed for and applied only to kraft bleach filtrates, and measures total oxalate by mixing aqueous samples in the presence of a strong cation-exchange resin to dissolve insoluble forms of oxalate, followed by IC analysis of the dissolved oxalic acid. As a further test of our method, we analyzed several filtrate samples from a third kraft mill by our method and that of Reimann et al. As indicated in Table 3, we found excellent agreement between the two methods for the five different filtrate samples. In the course of this work we
discovered that the cation-exchange resin recommended and purchased from Aldrich contained a red, water soluble dye (probably formed during the resin manufacturing
3 4 5 6 7 8 9 10 11 12 13 14 15 16 17 18 19 20 21 22 23 24 25 26 27 28 29 30 31 32 33 34 35 36 37 38 39 40 41 42 43 44 45 46 47 48 49 50 51 52 53 54 55 56
For Peer Review Only
process), that if injected into the IC, can adsorb to and damage the IC columns. However, we found that we could remove the dye quite effectively by simply washing the resin with 50 mL of 1 M HCl and then with copious amounts of Milli-Q water until the pH of eluate from the resin was neutral. This simple procedure not only removes any dye that is present, but also ensures that the resin is fully protonated prior to use. The advantage of our method over that of Reimann et al., is that it is simpler to perform and steps such as resin washing to remove the dye, which can harm expensive IC columns, and filtration of resin containing samples prior to IC analysis are not necessary in our approach. In
addition, our method has been validated for a broader range of samples, including paper, pulp, and scale deposits.
4. CONCLUSIONS
A new and rapid method has been developed for measuring soluble and insoluble forms of oxalate in kraft pulp and paper matrices. Spike-recovery experiments showed that both forms of oxalate are quantitatively determined. The method can also be applied to the analysis of calcium oxalate in scale deposits.
5. REFERENCES
1. Trockenbrodt, M., 1995, Annals of Botany 75: 281.
2. Kennedy, R.W., Sastry, C.B.R., Barton, G.M. and Ellis, E.L., 1968, Canadian Journal of Botany 46: 1221.
3. Nakata, P.A., 2003, Plant Science 164: 901.
4. Webb, M. A., 1999, The Plant Cell 11: 751.
3 4 5 6 7 8 9 10 11 12 13 14 15 16 17 18 19 20 21 22 23 24 25 26 27 28 29 30 31 32 33 34 35 36 37 38 39 40 41 42 43 44 45 46 47 48 49 50 51 52 53 54 55 56
For Peer Review Only
5. Libert, B., Franceschi, V.R., 1987, J. Agric. Food Chem. 35: 926.
6. Krasowski, J.A. and Marton, J., 1983, J. Wood Chem. Technol., 3(4): 445.
7. Löwendahl, L., Petersson, G. and Samuelson, O., 1976, Tappi 59(9): 118.
8. Elsander, A., Ek, M. and Gellerstedt, G., 2000, Tappi J., 83(2): 73.
9. Fiskari, J. and Gullichsen, J., Laboratory experiments on oxalic acid formation in hardwood pulp TCF bleaching, Tenth International Symposium on Wood and Pulping Chemistry, Yokohama, Japan, June 7-10, 1999, Vol. 1, pp. 324-328.
10. Nilvebrant N-O and Reimann A., Xylan as a source for oxalic acid during ozone bleaching, Fourth European workshop on lignocellulosics and pulp, Advances in characterization and processing of wood, non-woody and secondary fibers, Stresa, Italy, Sept. 8-11, 1996, pp. 485-491.
11. Armitage, G.M. and Dunsmore, H.S., 1972, J. Inorg. Chem., 34: 2811.
12. Kettler, R. M., Palmer, D. A., and Wesolowski, D. J., 1991, J. Sol. Chem., 20(9):905- 927.
13. Nancollas, G.H., 1983, Croatica Chemica Acta 56(4): 741.
14. Nancollas, G.H. and Gardner, G.L., 1974, J. Cryst. Growth 21: 267.
15. Babic-Ivancic, V., Füredi-Milhofer, H., Purgaric, B., Brnicevic, N. and Despoptoviv, Z., 1985, J. Cryst. Growth 71: 655.
16. Tomaciz, B. and Nancollas, G.H., 1979, J. Cryst. Growth 46: 355.
17. Tomaciz, B. and Nancollas, G.H., 1980, J. Colloid and Interface Sci 75(1): 149.
18. Millan, A., Pavelkova, M., Sohnel, O., Grases, F., 1998, Cryst. Res. Technol. 33(5):
777.
19. Ulmgren P., 1997, Nord. Pulp Pap. Res. J. 12(1): 32.
20. Ulmgren, P. and Rådeström, R.: Calcium oxalate in bleach plant filtrates, TAPPI minimum effluent mills symposium, San Francisco, CA, Oct. 23-24, 1997, pp. 51-62.
21. Ulmgren P. and Rådeström R., 2001, Nord. Pulp Pap. Res. J., 16(4): 389.
22. Ulmgren P. and Rådeström R., 2001, J. Pulp Pap. Sci., 27(11): 391.
23. Ulmgren, P. and Rådeström, R., 1999, Nordic Pulp Paper Res. J. 14(3): 214.
3 4 5 6 7 8 9 10 11 12 13 14 15 16 17 18 19 20 21 22 23 24 25 26 27 28 29 30 31 32 33 34 35 36 37 38 39 40 41 42 43 44 45 46 47 48 49 50 51 52 53 54 55 56
For Peer Review Only
24. Ulmgren, P. and Rådeström, R., 1999, Nordic Pulp Paper Res. J. 14(3): 338.
25. Hultman, B. and Nillson, C., 1981, Svensk Papperstidn. 84(18): R163.
26. Reid, D.W., Hinck, M.L., 2003, Tappi 2(2): 8.
27. He, Z., Ni, and Zhang, E., 2003, J. Pulp Pap. Sci., 29(12): 391.
28. Sithole, B., Scale deposit problems in pulp and paper mills, Seventh Brazilian
symposium on the chemistry of lignins and other wood components, Belo Horizonte, Brazil, Sept. 2-5, 2001, pp. 249-256.
29. Reimann, A., de Sousa, F. and Bjorklund, J.M., A method for the analysis of oxalic acid and calcium oxalate in kraft mill bleaching samples, Sixth European workshop on lignocellulosics and pulp (EWLP 2000). Advances in lignocellulosics chemistry towards high quality processes and products, Bordeaux, France, Sept. 3-6, 2000, pp.
543-546.
30. Jordan, C.R., Dashek, W.V. and Highley, T.L., 1996, Postia placenta, Holzforschung, 50(4): 312.
31. Gernon, M.D., Wu, M., Buszta, T. and Janney, P., 1999, Green Chem. 1(3): 127.
32. Patai, S. and Rappoport, Z., The chemistry of sulphonic acids, esters and their derivatives, John Wiley and Sons, New York, p. 251, 1991.
3 4 5 6 7 8 9 10 11 12 13 14 15 16 17 18 19 20 21 22 23 24 25 26 27 28 29 30 31 32 33 34 35 36 37 38 39 40 41 42 43 44 45 46 47 48 49 50 51 52 53 54 55 56
For Peer Review Only
Table 1. Effect of mixing time and aqueous MSA concentration on the dissolution of aqueous calcium oxalate suspensions. All experiments were conducted at 60 °C. See experimental section and text for additional details.
Experiment No.
Mixing Time (min)
[CaC2O4] [MSA]
(%, v/v)
CaC2O4
Dissolved (mM) (mg/L) (%)
1 0 1.15 147 0 8
2 5 1.15 147 2.5 98
3 10 1.15 147 2.5 97
4 20 1.15 147 2.5 98
5 30 1.15 147 2.5 99
6 0 1.70 218 0 8
7 5 1.70 218 2.5 97
8 10 1.70 218 2.5 98
9 20 1.70 218 2.5 98
10 30 1.70 218 2.5 100
Table 2. Soluble and insoluble levels in, and recovery of added soluble and insoluble oxalate for kraft mill brownstock (BStock), D0 and Eop pulp slurries from Mills A and B.
Soluble oxalate added in the form of aqueous sodium oxalate. Insoluble oxalate added in the form of solid COM.
Sample [C2O42-
], mg/kg oven dry pulp Recovery
Soluble Insoluble Added Found %
Soluble Insoluble Mill A
BStock 4530 - 4000 - 3890 97
D0 2130 - 2000 - 1950 98
Eop 12800 - 6000 - 5900 98
BStock - 880 - 1000 1050 105
D0 - 1560 - 1500 1480 99
Eop - 600 - 500 520 104
Mill B
BStock 1865 - 2000 - 1920 96
D0 1650 - 1500 - 1580 105
Eop 8950 - 4000 - 4100 103
BStock - 1580 - 1500 1450 97
D0 - 2195 - 2000 2060 103
3 4 5 6 7 8 9 10 11 12 13 14 15 16 17 18 19 20 21 22 23 24 25 26 27 28 29 30 31 32 33 34 35 36 37 38 39 40 41 42 43 44 45 46 47 48 49 50 51 52 53 54 55 56
For Peer Review Only
Table 3. Comparison of total oxalate results obtained by the current method and that of Reimann et al. [27], for kraft process filtrates from Mill C.
Sample Total Oxalate Concentration, mg/L
Current Work Reimann et al.
BStock 30 29
D0 61 60
Eop 133 125
D1 16 14
D2 10 10
3 4 5 6 7 8 9 10 11 12 13 14 15 16 17 18 19 20 21 22 23 24 25 26 27 28 29 30 31 32 33 34 35 36 37 38 39 40 41 42 43 44 45 46 47 48 49 50 51 52 53 54 55 56
For Peer Review Only
FIGURE CAPTIONS
Figure 1. Separation of oxalate in a standard solution by itself (upper trace) and in a standard mixture with five additional anions, including chloride, nitrite, phosphate, chlorate, sulphate (lower trace). Both solutions were prepared in water and contained 2.5 mg/L of oxalate. See experimental section for other conditions.
Figure 2. Separation of oxalate in standard solutions prepared in 0.5% v/v MSA in water (upper trace) and in water (lower trace). Oxalate was present at 2.5 mg/L in each solution.
See experimental section for other conditions.
Figure 3. Calibration plot showing the linear relationship between peak area and the concentration of oxalate in standard solutions prepared in water (open, inverted triangles) and in 0.5% v/v MSA in water (black, filled circles). See experimental section and Section 2.4 for further details.
Figure 4. Separation of soluble oxalate in samples of kraft D0 (upper trace), Eop (middle trace) filtrates and in a standard solution containing several common anions, including 2.5 mg/L oxalate (bottom trace). The samples and the standard were prepared in water.
See experimental section for other conditions.
Figure 5. Separation of total oxalate in a sample of kraft D0 filtrate (upper trace) and in a standard solution containing several common anions, including 2.5 mg/L oxalate (bottom trace). The sample and standard were prepared in 0.5% v/v MSA in water. See
experimental section for other conditions.
3 4 5 6 7 8 9 10 11 12 13 14 15 16 17 18 19 20 21 22 23 24 25 26 27 28 29 30 31 32 33 34 35 36 37 38 39 40 41 42 43 44 45 46 47 48 49 50 51 52 53 54 55 56
For Peer Review Only
Figure 1.
C2O42-
C2O42- SO42-
ClO3- PO43-
NO2- Cl-
0.0 2.0 4.0 6.0 8.0 10.0 12.0 15.0
-0.20 -0.00 0.20 0.40 0.60 0.80 1.00 2
Conductivity
Retention Time
2
1
C2O42-
C2O42- SO42-
ClO3- PO43-
NO2- Cl-
0.0 2.0 4.0 6.0 8.0 10.0 12.0 15.0
-0.20 -0.00 0.20 0.40 0.60 0.80 1.00 2
Conductivity
Retention Time
2
1
3 4 5 6 7 8 9 10 11 12 13 14 15 16 17 18 19 20 21 22 23 24 25 26 27 28 29 30 31 32 33 34 35 36 37 38 39 40 41 42 43 44 45 46 47 48 49 50 51 52 53 54 55 56
For Peer Review Only
Figure 2.
C2O42- SO42-
0.5% MSA
0.0 2.0 4.0 6.0 8.0 10.0 12.0 15.0
-0.20 0.50 1.00 1.50 2.00 2.50 2
Conductivity
Retention Time
2
1
C2O42-
water MSA
C2O42- SO42-
0.5% MSA
0.0 2.0 4.0 6.0 8.0 10.0 12.0 15.0
-0.20 0.50 1.00 1.50 2.00 2.50 2
Conductivity
Retention Time
2
1
C2O42-
water MSA
3 4 5 6 7 8 9 10 11 12 13 14 15 16 17 18 19 20 21 22 23 24 25 26 27 28 29 30 31 32 33 34 35 36 37 38 39 40 41 42 43 44 45 46 47 48 49 50 51 52 53 54 55 56
For Peer Review Only
Figure 3
Concentration, mg/L
0 5 10 15 20 25
Peak Area, µs*min
0.00 0.25 0.50 0.75 1.00 1.25
1.50 y = 0.05548 (x) - 0.00271 R² = 0.9997
3 4 5 6 7 8 9 10 11 12 13 14 15 16 17 18 19 20 21 22 23 24 25 26 27 28 29 30 31 32 33 34 35 36 37 38 39 40 41 42 43 44 45 46 47 48 49 50 51 52 53 54 55 56
For Peer Review Only
Figure 4
C2O42-
SO42- ClO3-
PO43- NO2- Cl-
0.0 2.0 4.0 6.0 8.0 10.0 12.0 15.0
-0.20 0.50 1.00 1.50 2.00 2.50 3
Conductivity
Retention Time
3
2
1
D0
Eop
Std
C2O42- C2O42-
C2O42-
SO42- ClO3-
PO43- NO2- Cl-
0.0 2.0 4.0 6.0 8.0 10.0 12.0 15.0
-0.20 0.50 1.00 1.50 2.00 2.50 3
Conductivity
Retention Time
3
2
1
D0
Eop
Std
C2O42- C2O42-
3 4 5 6 7 8 9 10 11 12 13 14 15 16 17 18 19 20 21 22 23 24 25 26 27 28 29 30 31 32 33 34 35 36 37 38 39 40 41 42 43 44 45 46 47 48 49 50 51 52 53 54 55 56
For Peer Review Only
Figure 5
0.0 2.0 4.0 6.0 8.0 10.0 12.0 15.0
-0.20 0.50 1.00 1.50 2.00 2.50 2
Conductivity
Retention Time
2
1
C2O42- MSA
C2O42- D0
Std
0.0 2.0 4.0 6.0 8.0 10.0 12.0 15.0
-0.20 0.50 1.00 1.50 2.00 2.50 2
Conductivity
Retention Time
2
1
C2O42- MSA
C2O42- D0
Std 3
4 5 6 7 8 9 10 11 12 13 14 15 16 17 18 19 20 21 22 23 24 25 26 27 28 29 30 31 32 33 34 35 36 37 38 39 40 41 42 43 44 45 46 47 48 49 50 51 52 53 54 55 56
For Peer Review Only
FIGURE CAPTIONS
Figure 1. Separation of oxalate in a standard solution by itself (upper trace) and in a standard mixture with five additional anions, including chloride, nitrite, phosphate, chlorate, sulphate (lower trace). Both solutions were prepared in water and contained 2.5 mg/L of oxalate. See experimental section for other conditions.
Figure 2. Separation of oxalate in standard solutions prepared in 0.5% v/v MSA in water (upper trace) and in water (lower trace). Oxalate was present at 2.5 mg/L in each solution.
See experimental section for other conditions.
Figure 3. Calibration plot showing the linear relationship between peak area and the concentration of oxalate in standard solutions prepared in water (open, inverted triangles) and in 0.5% v/v MSA in water (black, filled circles). See experimental section and Section 2.4 for further details.
Figure 4. Separation of soluble oxalate in samples of kraft D0 (upper trace), Eop (middle trace) filtrates and in a standard solution containing several common anions, including 2.5 mg/L oxalate (bottom trace). The samples and the standard were prepared in water.
See experimental section for other conditions.
Figure 5. Separation of total oxalate in a sample of kraft D0 filtrate (upper trace) and in a standard solution containing several common anions, including 2.5 mg/L oxalate (bottom trace). The sample and standard were prepared in 0.5% v/v MSA in water. See
experimental section for other conditions.
3 4 5 6 7 8 9 10 11 12 13 14 15 16 17 18 19 20 21 22 23 24 25 26 27 28 29 30 31 32 33 34 35 36 37 38 39 40 41 42 43 44 45 46 47 48 49 50 51 52 53 54 55 56
For Peer Review Only
Figure 1.
C2O42-
C2O42- SO42-
ClO3- PO43-
NO2- Cl-
0.0 2.0 4.0 6.0 8.0 10.0 12.0 15.0
-0.20 -0.00 0.20 0.40 0.60 0.80 1.00 2
Conductivity
Retention Time
2
1
C2O42-
C2O42- SO42-
ClO3- PO43-
NO2- Cl-
0.0 2.0 4.0 6.0 8.0 10.0 12.0 15.0
-0.20 -0.00 0.20 0.40 0.60 0.80 1.00 2
Conductivity
Retention Time
2
1
3 4 5 6 7 8 9 10 11 12 13 14 15 16 17 18 19 20 21 22 23 24 25 26 27 28 29 30 31 32 33 34 35 36 37 38 39 40 41 42 43 44 45 46 47 48 49 50 51 52 53 54 55 56