1
MODELLING SPATIAL VARIABILITY OF COFFEE (
COFFEA ARABICA L.
) CROP CONDITION WITH MULTISPECTRAL REMOTE SENSING DATAChemura Abel
A thesis submitted to the College of Agriculture, Engineering and Science, at the University of KwaZulu-Natal, in fulfilment of the academic requirements for the degree of Doctor of
Philosophy in Environmental Science Academic Supervisor: Professor Onisimo Mutanga Academic Advisors: Dr. John Odindi
Dr. Timothy Dube
Pietermaritzburg, South Africa November 2017
i ABSTRACT
Coffee (Coffea arabica L.) is an important economic crop produced by over 25 million farmers, across four continents. Coffee production is not just important for livelihoods of farmers, but also provide ecosystem services. As a perennial crop, coffee requires a robust, reliable and cost- effective monitoring strategy for diseases, pests, water stress, soil fertility and other crop stressors, to ensure long-term productivity and to safeguard investments and other related ecosystem services. The current monitoring methods largely rely on spontaneous field inspections and sampling, which are not only labour intensive, but also conclusive once economic damage has been inflicted on the crop. The coffee crop, due to its architecture, production system, planting arrangement and cropping cycle presents many challenges that make traditional remote sensing not applicable. Vegetation monitoring data and algorithms developed for either natural ecosystems or annual agricultural crops cannot be applied to coffee production because its distinct characteristics. In addition, since the majority of the coffee production is in developing countries, easily available multispectral level approaches are required for crop condition assessments of a unique and challenging but yet economically and ecologically important cropping system.
This study presents an integrated system for crop condition assessment using available multispectral remote sensing data for landscape scale modelling and mapping of crop health in coffee plantations. First, as a perennial crop, coffee is planted in various age groups across the landscape for continuity. However, age of the coffee plants significantly affects remote sensing potential due to its relationship with canopy cover and soil background effect. An approach to develop reliable and detailed age-specific thematic maps for areas producing coffee was developed by combining the machine learning robustness of the random forests algorithm with the improved sensor design of Landsat 8 OLI data. Results showed that higher overall classification accuracy was achieved when coffee was classified as a single class (90.3% for OLI and 86.8% for ETM+) than the three age-based coffee classes (86.2% for OLI and 81.0% for ETM+). It was concluded that disaggregating coffee classes to produce age-specific maps reduce overall accuracy, but the usefulness of a thematic map with age-specific classes is more than the value of the marginal decrease in accuracy. Thus, this research achieved inter and intra-class discrimination of landcover classes in a heterogenous coffee producing area. A reliable coffee age-mask was produced, thereby solving the problem of age variability in coffee plantations, which is one of the key limitations to crop condition assessments with remote sensing in perennial crops.
Next, the age specific thematic maps were used as age masks to develop an NDVI based method to detect and quantify incongruous patches based on their deviation from the age-expected mean values. Incongruous patches represent areas experiencing poor crop growth, pest infestation, disease outbreaks, soil fertility problems and/or responding or not responding to management interventions. Results showed that using the age-adjusted anomalies performed better in separating incongruous and healthy patches than using the global mean for both normalized difference vegetation index (NDVI) (Overall accuracy=77.2% and 66.4% respectively) and for Land Surface Water Index (LSWI) (Overall accuracy=66% and 49.2% respectively). When applied to other Landsat 8 OLI scenes, the results showed that the proportions of coffee fields that were modelled incongruent decreased with time for the young age category while it increased for the mature and
ii
old age classes with time. Using the distribution of transformed age-adjusted NDVI values around known health values with the inverse cumulative distribution function (ICDF) is an innovative way of detecting and mapping anomalous areas in plantations both spatially and temporally.
Having identified anomalous areas, more specific remote sensing approaches could now be used to determine the cause of the identified anomalies in the coffee fields. To achieve this, the effect of plant water stress and coffee leaf rust (CLR), a major coffee disease was explored as potential abiotic and biotic stressors that influence the spectral response of coffee at field scale. In both cases the random forest algorithm successfully classified and quantitatively predicted stress levels in coffee leaves. In plant water stress modelling, the results showed that the bands selected through reflectance sensitivity performed best in water stress detection (r = 0.87, RMSE = 4.91% and pBias
= 0.9%). In CLR discrimination, the results showed that simulated Sentinel-2 MSI derived vegetation indices achieved relatively high overall accuracy of 76.2% when compared to 69.8%
obtained using raw spectral bands. The RBF-PLS model satisfactorily modelled CLR severity (R2=0.92 and RMSE=6.1%) using all simulated Sentinel-2 MSI bands. These results indicate that it is possible to reliably predict plant water content (PWC) and CLR using wavebands in the VIS/NIR range that correspond with many of the available multispectral remote sensing data. This is an important development as previous studies mainly used hyperspectral data and data beyond the VIS/NIR range that is not available in many of the commonly accessible multispectral sensors.
However, further research at field and landscape scale is required to operationalize these findings as problems are encountered in transferring models from leaf level to canopy level.
The successful isolation of abiotic and biotic stressors that influence spectral signatures of coffee plantations set the basis to use multispectral remote sensing data to model the spatial variability of chlorophyll and nitrogen with Sentinel 2 MSI data. Results showed that the best modelling results (R2=0.77, RMSE=5.9) were achieved when all the bands at 10m spatial resolution were used in modelling coffee leaf chlorophyll for mature coffee stands. It was also concluded that the interaction between spectral settings and spatial resolution are important in chlorophyll estimation with Sentinel-2 MSI data. These findings are imperative in that Sentinel 2 MSI data comes with variable spatial and spectral resolution. Therefore, our finding that the spatial resolution, together with the spectral settings, cast aspersions on spectroscopic simulation studies that did not consider spatial resolution of Sentinel 2 MSI data in biochemical and biophysical vegetation characterisation. A combination of optimized bands and vegetation indices produced the best results for coffee foliar nitrogen modelling (R2=0.78, RMSE=0.23) at a landscape scale. The obtained nitrogen distribution maps can be used in precision coffee plantation management, insurance assessment and yield forecasting which were previously daunting tasks. This study therefore extended the frontiers of knowledge by developing an integrated multi-sensor approach for landscape scale modelling of coffee plant health. The use of multispectral remotely sensed data that is reliable and available at little to no cost as an added advantage to coffee producing countries in developing countries particularly in Sub-Saharan Africa.
iii PREFACE
The research work described in this thesis was carried out in the School of Agricultural, Earth and Environmental Sciences (SAES), University of KwaZulu-Natal, Pietermaritzburg, from January 2015 to August 2017, under the supervision of Prof. Onisimo Mutanga (School of Agricultural, Earth and Environmental Sciences, University of KwaZulu Natal, South Africa).
I would like to declare that the research work reported in this thesis has never been submitted in any form to any other university. It therefore represents my original work, except where due acknowledgments are made.
Abel Chemura Signed: ____________________ Date: _________________
As the candidate’s supervisor, I certify the above statement and have approved this thesis for submission.
Prof. Onisimo Mutanga Signed: ___________________ Date: _________________
iv DECLARATION 1 - PLAGIARISM
I, Abel Chemura, declare that:
1. The research reported in this thesis, except where otherwise indicated, is my original research,
2. This thesis has not been submitted for any degree or examination at any other university,
3. This thesis does not contain other persons’ data, pictures, graphs, or other information, unless specifically acknowledged as being sourced from other persons,
4. This thesis does not contain other persons’ writing, unless specifically acknowledged as being sourced from other researchers. Where other written sources have been quoted, then:
a. their words have been re-written, but the general information attributed to them has been referenced;
b. where their exact words have been used, then their writing has been placed in italics and inside quotation marks, and referenced;
5. This thesis does not contain text, graphics, or tables copied and pasted from the Internet, unless specifically acknowledged and the source being detailed in the thesis and in the References section.
Signed:____________________
Date:____________________
v
DECLARATION 2 - PUBLICATIONS AND MANUSCRIPTS
1. Chemura, A. and Mutanga, O. (2016) Developing detailed age-specific thematic maps for coffee (Coffea arabica L) for heterogeneous agricultural landscapes using random forests applied on Landsat 8 multispectral sensor data, Geocarto International, 32(7), 759-776.
2. Chemura, A., Mutanga, O and Dube, T (2017) Integrating age in the detection and mapping of incongruous patches in coffee (Coffea arabica) plantations using multi-temporal Landsat 8 NDVI anomalies, International Journal of Applied Earth Observation and Geoinformation, 57, 1–13.
3. Chemura, A., Mutanga, O and Dube, T (In Press) Remote sensing leaf water stress in coffee (Coffea arabica) using secondary effects of water absorption and random forests, Physics and Chemistry of the Earth ABC.
4. Chemura, A., Mutanga, O and Dube, T (2016) Separability of coffee leaf rust infection levels with machine learning methods at Sentinel-2 MSI spectral resolutions, Precision Agriculture, 17, 1-23
5. Chemura, A., Mutanga, O., Sibanda, M., and Chidoko, P. (In Press) Machine learning prediction of coffee rust severity on leaves using spectroradiometer data, Tropical Plant Pathology.
6. Chemura, A., Mutanga, O., and Odindi, J. (In Press) Empirical modelling of leaf chlorophyll content in coffee (Coffea arabica) plantations with Sentinel-2 MSI data: Effects of spectral settings, spatial resolution and crop canopy cover. Accepted in IEEE Journal of Selected Topics in Applied Earth Observations and Remote Sensing.
7. Chemura, A., Mutanga, O., Kutywayo, D., and Odindi, J. (Accepted) Mapping spatial variability in foliar nitrogen in coffee (Coffea arabica) plantations with multispectral level Sentinel-2 MSI data, Submitted to ISPRS Journal of Photogrammetry and Remote Sensing (June 2017).
Signed: ____________________
vi DEDICATION
This thesis is dedicated to my mother Mrs Bongai Chemura and my love Sitshengy.
vii ACKNOWLEDGEMENTS
This study could not have been successful if it were not for the assistance, contributions and cooperation I got from organisations and individuals for which I am very grateful. I give sincere gratitude to my supervisor Prof Onisimo Mutanga whose guidance, patience and wit helped me to properly shape this research work. In addition, I am grateful to Dr John Odindi and Dr Timothy Dube for their support throughout my research project. The input and support of Dr D. Kutywayo, Mr P. Chidoko and Mr C.
Mahoya is also greatly appreciated in facilitating field work and providing technical support. I also wish to thank my colleagues Dr. Terence Mushore, Dr. Mbulisi Sibanda, Victor M Bangamwabo, Dr Khoboso Seutloadi, Cletah Shoko, Thembeka Mhlongo and Pedzisai Kowe for their collaboration and moral support during the journey of putting together this study. I also want to thank my wife Sitshengisiwe, for supporting me, purifying my research ideas and proof-reading all my writings. The study also ran concurrently with International Foundation of Science (IFS) grant (D/5441) that provided financial support for carrying out some aspects of this study. I am also thankful to Mrs Shanita Ramroop, Sibongile Ntuli, Dr Mercy Ojoyi and Dr Concilia Danha for their support and encouragement. This research project and the entire study also drew a lot of inspiration from Anninlla-Nyasha for whom I will always work hard for.
viii TABLE OF CONTENTS
ABSTRACT ... i
PREFACE ... iii
DECLARATION 1 - PLAGIARISM ... iv
DECLARATION 2 - PUBLICATIONS AND MANUSCRIPTS ... v
DEDICATION ... vi
ACKNOWLEDGEMENTS ... vii
TABLE OF CONTENTS ... viii
LIST OF FIGURES ... xv
LIST OF TABLES ... xviii
SECTION 1: INTRODUCTION AND OVERVIEW... 1
CHAPTER 1: GENERAL INTRODUCTION ... 2
1.1 Coffee and coffee production ... 3
1.2 Remote sensing in agronomic decision making ... 4
1.3 Challenges of remote sensing application in coffee production ... 5
1.4 Importance of multispectral remote sensing in coffee production ... 6
1. 5 Aim and objectives ... 7
1.5.1 Aim ... 7
1.5.2 Objectives ... 7
1.6 Description of the study area ... 8
1.6.1 Coffee Research Institute ... 8
1.6.2: Ward 19 Chipinge District ... 8
1.7 Thesis structure ... 9
1.7.1 Section 1: Introduction and Overview ... 10
1.7.1.1 Chapter One: Introduction ... 10
1.7.1.2 Chapter Two: Literature review ... 10
1.7.2 Section 2: Setting the stage for coffee condition assessment ... 10
1.7.2.1 Chapter Three: Development of an age mask for coffee condition assessment ... 10
1.7.2.2 Chapter Four: Identification of anomalous patches in coffee plantations ... 11
1.7.3 Section 3: Remote sensing individual coffee stressors ... 11
1.7.3.1 Chapter Five: Predicting plant water content in coffee plants using multispectral remote sensing... 11
1.7.3. 2 Chapter Six: Modelling coffee leaf rust using multispectral remote sensing... 11
1.7.4 Section 4: Empirical modelling of coffee condition using multispectral data ... 11
ix
1.7.4.1 Chapter Seven: Multispectral remote sensing of coffee chlorophyll content ... 11
1.7.4.2 Chapter Eight: Multispectral remote sensing of spatial variability of coffee foliar nitrogen .. 12
1.7.4.5 Chapter Nine: Synthesis ... 12
CHAPTER 2: ADVANCES IN SENSOR APPLICATIONS FOR COFFEE (COFFEA ARABICA L.) CROP CONDITION ASSESSMENTS AND MONITORING ... 13
Abstract ... 14
2.1 Introduction ... 15
2.2 Physiological characteristics of coffee and their potential influence on remote sensing ... 17
2.3 Major biotic and abiotic stressors of coffee arabica plants that require monitoring ... 19
2.3.1 Nutrient deficiencies ... 19
2.3.2 Plant water stress and drought ... 20
2.3.3 Coffee Leaf Rust (CLR) ... 21
2.3.4 Coffee Berry Disease (CBD) ... 21
2.3.5 Coffee Wilt Disease (CWD) ... 22
2.3.6 Coffee White Stem Borer (CWB) ... 23
2.3.7 Other coffee diseases and pests ... 23
2.4. Current condition assessment methods in coffee crop management... 24
2.5. Applications of remote sensing in coffee crop management ... 25
2.5.1 Mapping cropped areas ... 25
2.5.2 Detection of coffee physiological properties ... 26
2.5.3 Coffee condition assessment ... 28
2.5.4 Yield estimation and modelling ... 29
2.6 Challenges for remote sensing in coffee production and future perspectives ... 32
2.7 Conclusion ... 34
SECTION 2: SETTING THE STAGE FOR COFFEE CONDITION ASSESSMENT ... 35
CHAPTER 3: DEVELOPMENT OF AN AGE MASK FOR COFFEE CONDITION ASSESSMENT .. 36
Abstract ... 37
3.1 Introduction ... 38
3.2 Material and methods ... 40
3.2.1 Study area ... 40
3.2.2 Field data collection ... 41
3.2.3 Image data and pre-processing ... 42
3.2.4 Spectral analysis and characterization ... 43
3.2.5 Classification schemes ... 44
x
3.2.6 Random forest classification ... 44
3.2.7 Accuracy assessment... 45
3.2.8 Comparing performance of classifiers ... 47
3.4 Results ... 48
3.4.1 Spectral characteristics of coffee age groups ... 48
3.4.2 Assessment of spectral separability of coffee classes ... 48
3.4.3 Assessing importance of individual bands in RF classification ... 49
3.4.4 Classification accuracy assessment ... 50
3.4.5 Comparing class area between the classifiers and schemes ... 55
3.5 Discussion ... 57
3.5.1 Comparison of performance of Landsat 8 OLI and ETM+ ... 57
3.5.2 Effect of age on spectral reflectance of coffee ... 58
3.5.3 Comparison of accuracy performance ... 59
3.6 Conclusions ... 60
3.7: Link to next chapter ... 60
CHAPTER 4: IDENTIFICATION AND MAPPING OF ANOMALOUS PATCHES IN COFFEE PLANTATIONS WITH MULTISPECTRAL DATA ... 61
Abstract ... 62
4.1 Introduction ... 63
4.2 Materials and methods ... 67
4.2.1 Study area ... 67
4.2.2 Satellite imagery ... 68
4.2.2.1 Data acquisition... 68
4.2.2.2 Data pre-processing... 69
4.2.2.3 Derivation of vegetation indices ... 70
4.2.3 Field data and statistical analysis ... 70
4.2.4 Anomaly detection and mapping ... 71
4.2.5 Model evaluation... 72
4.3 Results ... 73
4.3.1 Evaluating influence of age classes on vegetation indices ... 73
4.3.2 Determining anomalies ... 74
4.3.3 Accuracy assessment... 78
4.3.4 Quantification of incongruous areas ... 79
4.4 Discussion ... 80
xi
4.4.1 Effect of age on NDVI and LSWI values ... 80
4.4.2 Remote sensing-based identification of incongruent patches ... 81
4.4.3 Potential limitations and future improvements ... 83
4.5 Conclusions ... 84
4.6 Link to next chapter ... 84
SECTION 3: REMOTE SENSING INDIVIDUAL COFFEE PLANT STRESSORS ... 85
CHAPTER 5: MULTISPECTRAL LEVEL REMOTE SENSING OF PLANT WATER CONTENT IN COFFEE ... 86
Abstract ... 87
5.1 Introduction ... 88
5.2 Materials and methods ... 90
5.2.1 Study area ... 90
5.2.2 Experimental materials and design ... 90
5.2.3 Moisture stress treatments ... 91
5.2.4 Spectral reflectance measurements ... 91
5.2.5 Leaf water content measurements ... 91
5.2.6 Identification of water stress related wavebands ... 92
5.2.6.1 Cross-correlation threshold ... 92
5.2.6.2 Reflectance difference ... 93
5.2.6.3 Reflectance sensitivity ... 93
5.2.7 Modelling approach ... 93
5.2.8 Model evaluation... 94
5.3. Results ... 95
5.3.1 Coffee plant water content and reflectance ... 95
5.3.2 Variable selection ... 95
5.3.2.1 Cross-correlation threshold ... 95
5.3.2.2 Reflectance difference and reflectance sensitivity ... 96
5.3.3 Variable importance ... 97
5.3.4 Model performance evaluation ... 97
5.3.4.1 Cross-correlation threshold ... 97
5.3.4.2 Reflectance difference ... 98
5.3.4.3 Reflectance sensitivity ... 98
5.4 Discussion ... 99
5.4.1 Comparison of variable selection methods ... 99
xii
5.5 Conclusions ... 101
5.6 Link to next chapter ... 101
CHAPTER 6: MULTISPECTRAL LEVEL REMOTE SENSING-BASED DISCRIMINATION AND SEVERITY MODELLING OF COFFEE LEAF RUST ... 102
Abstract ... 103
6.1 Introduction ... 104
6.2 Materials and methods ... 107
6.2.1 Study area ... 107
6.2.2 Coffee leaf rust inoculation ... 107
6.2.3 Reflectance measurements and resampling ... 108
6.2.4 Vegetation Indices... 109
6.2.5 Statistical approaches for CLR discrimination ... 111
6.2.5.1 Random forest algorithm. ... 111
6.2.5.2 Partial least squares discriminant analysis ... 111
6.2.6 Statistical approaches for severity modelling ... 111
6.2.7 Accuracy assessment... 112
6.2.7.1 CLR discrimination ... 112
6.2.7.2 Severity modelling ... 112
6.3 Results ... 112
6.3.1 Spectral Resampling ... 112
6.3.2 CLR discrimination ... 113
6.3.2.1 Discrimination with all variables ... 113
6.3.2.2 Variable optimization ... 115
6.3.2.3 CLR discrimination with optimized variables ... 116
6.3.3 CLR severity modelling ... 118
6.3.3.1 Relationship between Sentinel-2 MSI spectral bands and CLR severity ... 118
6.3.3.2 Determining gaussian widths ... 119
6.3.3.3 Modelling CLR severity ... 120
6.4 Discussion ... 121
6.4.1 Spectral resampling ... 122
6.4.2 Discrimination ... 122
6.4.2.1 Performance of Sentinel-2 spectral bands in CLR discrimination ... 122
6.4.2.2 Performance of Sentinel-2 vegetation indices in CLR discrimination ... 123
6.4.2.3 Effect of variable optimization and algorithm on CLR discrimination ... 124
xiii
6.4.3 Severity modelling ... 124
6.4.3.1 Relationship between Sentinel-2 MSI spectral bands and CLR severity ... 124
6.4.3.2 Modelling CLR severity with spectral bands ... 125
6.4.4 Multispectral level remote sensing of biotic stress in coffee ... 126
6.5 Conclusion ... 126
6.6 Link to next chapter ... 127
SECTION 4: EMPIRICAL MODELLING OF COFFEE CONDITION USING MULTISPECTRAL REMOTE SENSING DATA ... 128
CHAPTER 7: LANDSCAPE SCALE MULTISPECTRAL REMOTE SENSING OF COFFEE TOTAL CHLOROPHYLL CONTENT ... 129
Abstract ... 130
7.1 Introduction ... 131
7.2 Materials and methods ... 133
7.2.1 Study area ... 133
7.2.2 Field data ... 134
7.2.3 Image acquisition and pre-processing ... 135
7.2.4 Machine learning modelling approach ... 137
7.2.5 Accuracy assessment and performance comparison ... 137
7.3 Results ... 138
7.3.1 Effect of biophysical and age characteristics ... 138
7.3.2 Total coffee leaf chlorophyll estimation with all coffee stands ... 139
7.3.3 Total coffee leaf chlorophyll estimation for mature coffee stands only ... 142
7.4 Discussion ... 145
7.4.1 Effect of biophysical and age characteristics ... 145
7.4.2 Effect of spectral settings and spatial resolution on coffee leaf Chl estimation ... 146
7.4.3 Influence of coffee stand age on coffee leaf Chl estimation ... 147
7.5 Conclusions ... 148
7.6 Link to next chapter ... 149
CHAPTER 8: LANDSCAPE SCALE MULTISPECTRAL REMOTE SENSING OF COFFEE FOLIAR NITROGEN CONTENT ... 150
Abstract ... 151
8.1 Introduction ... 152
8.2 Materials and methods ... 154
8.2.1 Study area ... 154
8.2.2 Field data ... 155
xiv
8.2.3 Foliar nitrogen determination ... 156
8.2.4 Image acquisition and preprocessing ... 156
8.2.5 Vegetation indices ... 158
8.2.6 Foliar N Prediction algorithm and its implementation ... 159
8.2.7 Accuracy assessment... 160
8.3 Results ... 161
8.3.1 Correlation between bands and vegetation indices with foliar N ... 161
8.3.2 Foliar N prediction with spectral bands ... 162
8.3.3 Foliar N prediction with Sentinel-2 vegetation Indices ... 164
8.3.4 Foliar N prediction with combination of bands and vegetation indices ... 166
8.3.5 Mapping of low foliar nitrogen areas in coffee plantations ... 168
8.4 Discussion ... 169
8.4.1 Identifying Sentinel-2 bands and vegetation indices related to coffee foliar N ... 169
8.4.2 Quantification and mapping coffee foliar N distribution ... 171
8.5 Conclusions ... 172
CHAPTER 9: MODELLING SPATIAL VARIABILITY OF COFFEE CROP CONDITION WITH MULTISPECTRAL REMOTE SENSING DATA: A SYNTHESIS ... 173
9.1 Introduction ... 174
9.2 Mapping coffee plantations and development of age-masks ... 175
9.3 Identification of anomalous patches in coffee plantations ... 176
9.4 Predicting plant water content in coffee plants using multispectral remote sensing ... 178
9.5 Modelling coffee leaf rust using multispectral remote sensing ... 178
9.6 Multispectral remote sensing of coffee chlorophyll content ... 179
9.7 Multispectral remote sensing of spatial variability of coffee foliar nitrogen ... 180
9.8 Implications for the coffee sector ... 181
9.9 Conclusions ... 182
9.10 Outlook for future research ... 183
References ... 184
xv LIST OF FIGURES
Figure 1. 1: Map of the study area showing (a) the location of the study area in Zimbabwe (b) the sites used to identify coffee areas (c) the sites used for anomalies and (d) the site used for field mapping of coffee condition. ... 9 Figure 2. 1: Distribution of number of published papers across different subjects in coffee (2007-2017) across the first 100 search results. Search term was coffee for Web of Science, EBSCOHost and Scopus and Coffee arabica for Google Scholar as there was a user named Coffee whose name affected results. Other refers to coffee waste, packaging materials and socio-economic studies.
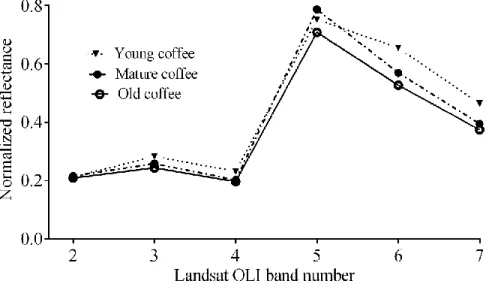
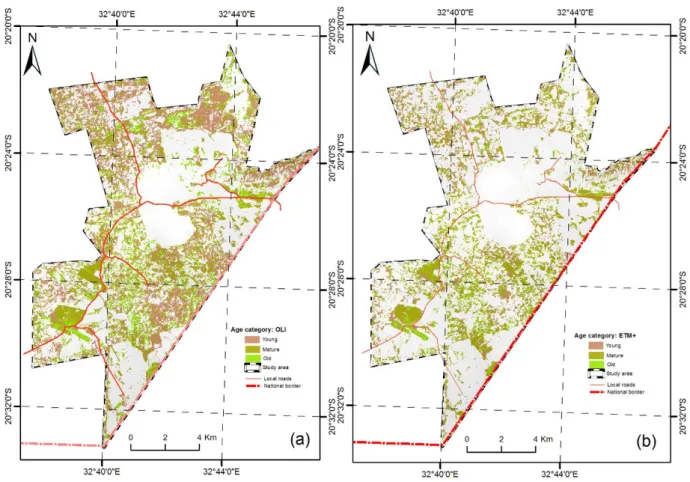
... 17 Figure 2.2: Physiological characteristics of coffee showing (a) planting arrangement in hedgerows, (b) flowering and (c) coffee fruits. Photo credits: A. Chemura (2017) ... 18 Figure 2.3: Map showing the coffee producing countries, types of coffee produced and the number of papers published on use of remote sensing in coffee production... 32 Figure 3.1: Map of the study area showing general landscape and roads. The insert shows the location of the study area in eastern Zimbabwe and in Southern Africa. ... 41 Figure 3.2: Mean reflectance of the coffee classes for the Landsat 8 OLI bands. ... 48 Figure 3.3: Importance of the spectral bands in class separation shown by decrease in training accuracy when the band is excluded for (3.3a) Scheme A samples on Landsat 8 OLI, (3.3b) Scheme B samples on Landsat 8OLI, (3.3c) Scheme A samples on Landsat ETM+ and (3.3d) Scheme B samples on Landsat 7 ETM+. The highest percentage increase in mean standard error (%IncMSE) corresponds to the decrease in accuracy when that band is excluded and therefore indicates the most important bands. ... 50 Figure 3.4: Thematic maps produced from random forest classification of the agricultural landscape using Landsat 8 OLI data using (a) Scheme A samples (b) Scheme B samples. ... 51 Figure 3.5: Thematic maps produced from random forest classification of the agricultural landscape using Landsat 7 ETM+ data using (a) Scheme A samples and (b) Scheme B samples. ... 52 Figure 3.6: Age specific thematic maps for coffee produced from (a) Landsat 8 OLI and (b) Landsat ETM+.
... 56 Figure 3.7: Comparison of classifier estimated area with reference data from three farms showing relationships between (a) Landsat 8 OLI data and farm record of area of the three age groups (b) Landsat 8 ETM+ data and farm record of area of the three age groups and (c) Landsat 8 OLI areas and Landsat ETM+ area of the three age groups. The dashed line is the 1:1 line. ... 57 Figure 4.1: Map of the study area showing the distribution of coffee ages used in the study adapted from Chemura and Mutanga (2016). The insert shows the location of the study area in Eastern Zimbabwe. ... 68 Figure 4.2: Flowchart of the methodology to detect and map incongruous patches in coffee plantations using time series global and age-adjusted Landsat 8 NDVI and LSWI anomalies. ... 73 Figure 4.3: Effect of age on mean (a) Landsat 8 Scene NDVI and (b) Landsat 8 Scene LSWI extracted from sample points for all the nine scenes. Means followed by the same letter are not significantly different after the Tukey HSD test (α ≤ 0.05). ... 74 Figure 4.4: Histogram plots of the percentage differences of coffee NDVI (a-c) and LSWI (d-f) values from their age-expected mean values for the 4th of December image scene. ... 75
xvi
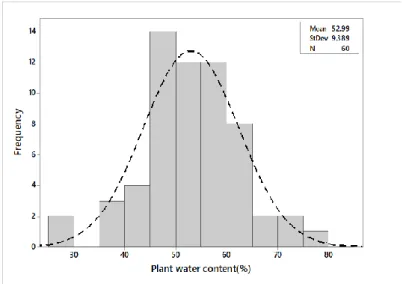
Figure 4.5: Spatial distribution of percentage deviation from age-expected NDVI mean over the study area across the nine Landsat 8 OLI image dates. ... 76 Figure 4.6: Spatial distribution of percentage deviation from age-expected LSWI mean over the study area across the nine Landsat 8 OLI image dates ... 77 Figure 4.7: Map showing the distribution of incongruent coffee patches because of excessive age-specific NDVI deviation from the mean for the nine Landsat 8 OLI Scenes. ... 78 Figure 4.8: Producer’s and user’s accuracy for normal and incongruous patches for all different types of anomalies. ... 79 Figure 4.9: Percentage area determined as incongruent from age-adjusted NDVI anomalies for all the nine Landsat 8 OLI image scenes. ... 80 Figure 5.1: Distribution of plant water content of coffee leaves used in the study. ... 95 Figure 5.2: Coefficient of determination for (5.2a) all wavebands between 400 and 900 and (5.2b) selected wavebands using the threshold R2. ... 96 Figure 5.3: The application of the reflectance difference and reflectance sensitivity for variable selection.
Figure 5.3a shows the variables selected using reflectance difference and Figure 5.3b shows the variables selected using reflectance sensitivity. ... 97 Figure 5.4: Variable importance of wavebands used in modelling plant PWC as selected by (5.4a) Cross-
correlation (5.4b) Reflectance Difference and (5.4c) Reflectance Sensitivity. ... 97 Figure 5.5: One-to-one plots showing performance of the RF model for predicting PWC from wavebands for selected through (5.5a) Cross-Correlation, (5.5b) RD and (5.5c) RS. ... 98 Figure 6.1: (a) The histogram showing distribution of leaf area of samples and (b) box plots of percent diseased area of leaves as measured on the day of reflectance measurements (N=63). ... 108 Figure 6.2: Mean spectral reflectance of CLR infection levels across the Sentinel-2 bands obtained from resampling hyperspectral imagery. ... 113 Figure 6.3: Optimization of Sentinel-2 variables for CLR discrimination through (a) RF-OOB error for spectral bands (b) PLS-DA for spectral bands (c) RF-OOB error for vegetation indices and (d) PLS-DA VIP for vegetation indices. The dotted line shows the cut-off point for variables. . 115 Figure 6.4: Effect of RF and PLS-DA model variable optimization on CLR discrimination accuracies using Sentinel-2 bands and vegetation indices. ... 116 Figure 6.5: Correlation between CLR severity and Sentinel-2 MSI (a) Band 2 reflectance, (b) Band 4 reflectance and (c) Band 6 Reflectance. ... 119 Figure 6.6: Determination of σ through cross-validated RMSE for use as Gaussian widths in the non-linear RBF-PLS models for (a) All Sentinel-2 MSI bands and (b) Selected Sentinel-2 MSI variables.
... 120 Figure 6.7: Relationship between measured and modelled CLR severity with RBF-PLS with (a) All Sentinel-2 MSI bands and (b) Selected Sentinel-2 MSI variables. ... 121 Figure 7.1: The study area showing the distribution of the coffee fields and stand ages. ... 134 Figure 7.2 Influence of stand age and variety on (a) coffee height (b) tree canopy area (c) total Chl obtained from field work (n=72). The numbers (3,4,6,7 and 8) are the ages while letters (A and B) are coffee varieties... 139 Figure 7.3: Relationship between measured and predicted coffee leaf chlorophyll using (a) all 9 bands at 20m resolution, (b) 4 bands originally at 10m resolutions (c) 5 bands originally at 20m resolutions and (d) all 9 bands at 10m resolutions. ... 140
xvii
Figure 7.4: Total coffee leaf Chl distribution maps obtained using the RF on (a) all 9 bands at 20m spatial resolutions and (b) all 9 bands at 10m spatial resolutions for all coffee stands. ... 141 Figure 7.5: Relationship between measured and predicted mature coffee leaf chlorophyll using (a) all 9 bands at 20m resolution, (b) 4 bands originally at 10m resolutions (c) 5 bands originally at 20m resolutions and (d) all 9 bands at 10m resolutions. ... 142 Figure 7.6: Total coffee leaf Chl distribution maps obtained from the RF using (a) all 9 bands at 20m spatial resolution and (b) all 9 bands at 10m spatial resolutions for mature fields. ... 143 Figure 7.7: Effect of coffee canopy area on total coffee Chl estimation accuracy as shown by (a) prediction difference and (b) absolute difference with all coffee data (n=29). ... 145 Figure 8.1: The study area showing the distribution of the coffee fields and stand ages ... 155 Figure 8.2: 1:1 plot showing the relationship between measured and predicted coffee foliar N using (a) all spectral bands and (b) optimized spectral bands. ... 163 Figure 8.3: Predicted distribution of foliar nitrogen levels in coffee leaves obtained from (a) modelling with all spectral bands and (b) modelling with optimized spectral bands. ... 163 Figure 8.4: Variable optimization for prediction of coffee foliar N using (a) spectral bands and (b) vegetation indices. ... 164 Figure 8.5: 1:1 plot showing the relationship between the measured and the predicted foliar N levels with (a) all nine vegetation indices and (b) five optimized vegetation indices. ... 165 Figure 8.6: Predicted distribution of foliar nitrogen levels in coffee leaves obtained from (a) modelling with all vegetation indices and (b) modelling with optimized vegetation indices. ... 166 Figure 8.7: 1:1 plot showing the relationship between the measured and the predicted foliar N levels using a combination of optimal bands and vegetation indices. ... 167 Figure 8.8: Predicted distribution of foliar nitrogen levels from combination of optimal bands and vegetation indices showing (a) variation in foliar N and (b) distribution of N levels. ... 167 Figure 8.9: Comparison of coffee area with positive (high foliar N) and negative (low N) anomalous foliar N levels from different modelling approaches. ... 168
xviii LIST OF TABLES
Table 2.1: Summary of major diseases of coffee, parts affected and author perceived potential for remote
sensing based on extend and coffee plant parts affected. ... 24
Tabl e 2.2: Summary of applications of remote sensing technology in coffee crop condition assessments showing the sensor types used, methods, maximum reported accuracy and the references. .... 30
Table 3.1: Description of the land cover classes used in the classification. ... 42
Table 3.2: Spectral and spatial characteristics of the Landsat 8 OLI and Landsat ETM+ data ... 42
Table 3.3: The number of training regions of interest (ROIs) and validation ROIs used for the classification by the two schemes with Landsat 8 OLI and Landsat 7 ETM+. Each ROI represents a field collected sample point. ... 47
Table 3.4: Transformed divergences indices showing pairwise interclass separability of coffee classes and other classes in the training samples... 49
Table 3.5: Confusion matrix and associated classification accuracies based on independent test data set for Scheme A produced from Landsat 8 OLI and Landsat 7 ETM+. The accuracies include overall accuracy (OA), kappa (Kc), user’s accuracy (UA) and producer’s accuracy (PA). ... 53
Table 3.6: Confusion matrix and associated classification accuracies based on independent test data set for Scheme B produced from Landsat 8 OLI and Landsat 7 ETM+. The accuracies include overall accuracy (OA), kappa (Kc), user’s accuracy (UA) and producer’s accuracy (PA). ... 54
Table 3.7: McNemar’s test results for comparison between Landsat ETM+ and Landsat 8 OLI for Scheme A an Scheme B classifications*. ... 55
Table 3.8: Area (ha-1) for each land cover class as obtained from the random forest classification of Landsat 8 Oli and Landsat 7 ETM+ with Scheme A and Scheme B samples. ... 57
Table 4.1: Detail on Landsat 8 Scenes used to derive NDVI ... 69
Table 4.2: Accuracy assessment of model performance ... 79
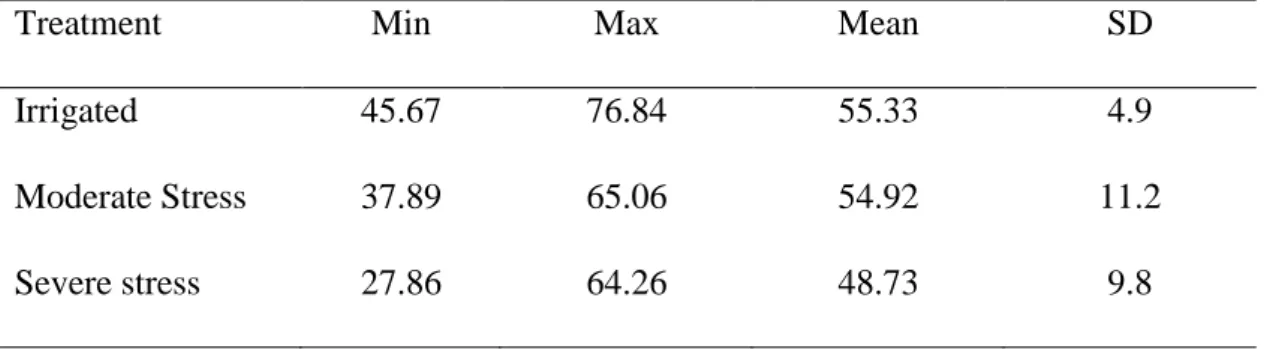
Table 5.1: Descriptive statistics of the PWC for the three stress levels. ... 95
Table 5.2: Summary model performance evaluation using test dataset (n=24) ... 98
Table 6.1: Description of levels of CLR infection levels, sample images and number of samples used in the study ... 108
Table 6.2: Specifications of the Sentinel-2 Multispectral Instrument (MSI) ... 109
Table 6.3: Selected vegetation indices (VIs) evaluated in the study. ... 110
Table 6.4: CLR discrimination accuracies obtained using Sentinel-2 MSI derived spectral bands and vegetation indices ... 114
Table 6.5: CLR discrimination accuracies derived using the most important selected model variables (i.e. spectral bands and optimized vegetation indices). ... 117
Table 6.6: Comparison of the performance of CLR discrimination accuracy results derived using RF and PLS-DA models with and without variable optimization ... 118
Table 6.7: Correlation coefficients (r) and significance of correlation (α<0.05) between Sentinel-2 MSI bands and CLR severity. ... 119
Table 6. 8: Error metrics for all models in predicting CLR severity from Sentinel-2 MSI variables with RBF-PLS ... 121
Table 7.1: Specifications of the Sentinel-2 Multispectral Instrument (MSI) ... 135
Table 7.2: Specifications of the Sentinel-2 Multispectral Instrument (MSI) band settings showing spatial/spectral combinations, number of bands and spatial resolution. ... 136
xix
Table 7.3: Performance evaluation of different band settings in predicting coffee leaf chlorophyll using all coffee stands. ... 140 Table 7. 4: Performance evaluation of different band settings in predicting coffee leaf chlorophyll using mature coffee stands only. ... 143 Table 7.5: Correlation coefficients (r) between predicted coffee leaf chlorophyll using different band settings*. ... 144 Table 8.1: Descriptive statistics of field data ... 156 Table 8.2: Specific details about the Sentinel-2 MSI image used. ... 157 Table 8.3: Specifications of the Sentinel-2 Multispectral Instrument (MSI) band settings showing centre wavelengths, band width and spatial resolution. ... 158 Table 8.4: Name, formula and Sentinel-2 bands utilized in selected vegetation indices (VIs) evaluated in the study. ... 159 Table 8.5: Relationship between Senitnel-2 MSI variables and coffee foliar N. ... 161 Table 8.6: Accuracy of coffee foliar N prediction with all and optimized Sentinel-2 bands. ... 162 Table 8.7: Performance of predicting coffee foliar N with all and optimized Sentinel-2 vegetation indices.
... 164 Table 8.8: Performance of predicting coffee foliar N with a combination of optimal bands and vegetation indices. ... 166 Table 8.9: Sizes (in ha) and % of low, sufficient and high coffee foliar N levels. ... 169
1
SECTION 1: INTRODUCTION AND OVERVIEW
2
CHAPTER 1: GENERAL INTRODUCTION
Photo credits: A. Chemura
3 1.1 Coffee and coffee production
The production of coffee (Coffea arabica L.), a perennial tree crop whose fruits are used for making coffee, a very popular non-alcoholic beverage, is an important agricultural activity in over sixty countries across four continents. The majority of producer countries are developing countries in sub-Saharan Africa, South East Asia and Central America. In these countries, over twenty million coffee farmers tend about three billion coffee trees to supply the global coffee demand of over two billion coffee cups consumed daily (Waston & Achinelli, 2008; ICO, 2015). Accordingly, coffee production contributes over US$20 billion annually to producer countries, with incomes cascading down to millions of smallholder farmers and farm workers for which coffee is a unique legal source of income and livelihoods. In addition to being a significant source of livelihoods, coffee plantations also contribute to landscape scale ecosystem processes such as carbon sequestration, erosion control and provision of other ecosystem services (Brauman et al., 2007).
Unlike annual crops, perennial crops such as coffee represent a long-term investment because they are in the field for a long period of time.
Evidence shows that there are increases in frequency, magnitude and impacts of production challenges in the coffee sector threatening livelihoods, economies and ecosystems in coffee producing areas (Jayathilaka et al., 2012; Rahn et al., 2013). Water stress, increasing pest incidences, more severe and frequent disease pressure, and limited soil nutrient supply, coupled with slow developments in technologies to deal with these challenges, are affecting productivity of coffee. For example, Hillocks et al. (1999) pointed that some pests such as coffee white stem borer (CWB) and coffee leaf miner (CLM) previously considered minor are having significant impacts on coffee production. Similarly, African Development Bank (2010) observed that the coffee sector is facing many production challenges that are limiting yields and quality, and consequently reducing farmers’ incomes.
Many studies have demonstrated that production challenges are increasingly becoming more pronounced, extended and severe because of climate change and variability (Ghini et al., 2011;
Jayathilaka et al., 2012; Kutywayo et al., 2013). Due to these challenges, productivity and area under coffee production of coffee are falling. In order to meet growing demand and export commitments, farmers have to expand their coffee fields, in some areas through conversion of environmentally sensitive land to crop land. This poses several environmental challenges
4
especially now that many coffee consumers are increasingly demanding sustainably produced coffee. Remote sensing can be used in enhancing coffee production to reduce production costs, increase productivity and safeguard ecosystem services in coffee producing areas.
1.2 Remote sensing in agronomic decision making
There is an urgent need to increase coffee production volume and quality to support livelihoods without adversely affecting the environment, which is the basis of productivity. To achieve this, there is need to increase productivity of coffee. One way of increasing productivity per unit area is through crop condition assessments and season-long monitoring to support agronomic decision making (Baret et al., 2007). Current agronomic decision making in coffee is based on calendar based management programs, spontaneous field inspections and sampling by trained and experienced personnel who scout the often large coffee plantations looking for signs of production challenges. These methods are not only labour intensive, but also conclusive once economic damage has been inflicted on the crop. In addition, these methods are not spatially explicit and since they are based on sampling, assume that the crop condition is uniform across coffee fields.
For example, if an identified pest is found to exceed the threshold on one tree, the whole field is sprayed. This is not only expensive to farmers who bear the cost of excessive agrochemical applications, but also to the environment that absorbs the excess chemicals.
There is overwhelming evidence that remote sensing utility in agriculture is significant especially under the broader goal of precision agriculture. For instance, it was demonstrated that remote sensing can provide automated routines for accurate and early detection and differentiation of plant diseases for farm-level decision making (Moshou et al., 2004; Rumpf et al., 2010; Mahlein et al., 2012a; Barbedo, 2013). Similarly, crop nutrient status can also be determined and mapped using remote sensing methods to identify anomalous areas and therefore ensuring uniform yields across fields (Scharf et al., 2002; Zhao et al., 2005). Furthermore, signs of plant water stress can also be detected using spectral bands and vegetation indices (Peñuelas et al., 1994; Barnes et al., 2000;
Eitel et al., 2006; Brillante et al., 2016; Dangwal et al., 2016). More generally, cropped area and plant populations can be accurately estimated together with indications of crop vigour that are directly related to yield (Maxwell et al., 2004; Gitelson et al., 2005; Atzberger, 2013). This indicates that the ability of remote sensing to enhance agricultural productivity has since moved from potential to reality with evidence of practical applications across the world.
5
1.3 Challenges of remote sensing application in coffee production
The majority of the studies on agricultural applications of remote sensing have been on annual crops, with many of the developed approaches difficult or impossible to transfer to perennial crops such as coffee and cocoa. This is attributed to the differences in physiology, functional photosynthetic pathways, phenological cycles, and type and extent of challenges between annual and perennial crops. For instance, many of the remote sensing applications in agriculture are reported for crop species in the grass family such as corn (Zea mays L) (Maxwell et al., 2004;
Freeman et al., 2007; Kuri et al., 2014), wheat (Triticum aestivum L)(Sembiring et al., 2000; Liu et al., 2003; Riedell et al., 2003; Atzberger et al., 2010; Dangwal et al., 2016) and rice (Oryza sativa L.) (Lee et al., 2008; Cao et al., 2015; Kanke et al., 2016; Zhou et al., 2016). Soybean (Glycine max L. Merr.) (Nutter Jr. et al., 2002; Venteris et al., 2015), and leafy vegetables (Mahlein et al., 2012b), annual field crops such as cotton (Gossypium hirsutum L.) (Zarco-Tejada et al., 2005; Ko et al., 2006) and sunflower (Helianthus annuus L.) (Gutierrez et al., 2008) also feature prominently in remote sensing applications in agriculture.
As a result, in published reviews of applications of remote sensing for different aspects of precision agriculture, reports on perennial tree crops are scarce, far in-between and in a few cases, they appear to be overshadowed by annual crops. For instance, very few perennial woody species- related applications appear in reviews of broad remote sensing in agriculture (Hatfield et al., 2008;
Ge et al., 2011; Mulla, 2013), unmanned aerial systems and precision agriculture (Zhang &
Kovacs, 2012; Sankaran et al., 2015) and remote sensing for disease detection (Mahlein et al., 2012a). There is thus a huge gap between the application of remote sensing in annual and perennial agricultural systems, particularly in coffee production. This gap has to be closed to advance the benefits of coffee production in ensuring local and national economic development and provision of ecosystem services.
There are a number of challenges that make remote sensing applications in perennial tree crops in general and for coffee in particular more complicated than in a natural grassland, forest and in annual crops. Firstly, coffee is in the field all year round for up to between 15 and 25 years of production. Because of this, there are no distinct phenological cycles that can be used for its characterisation as it does not shed its leaves completely. Secondly, coffee is planted in hedgerows or covas that produce a systematic spatial planting arrangement. In addition, coffee is managed to
6
ensure that there are gaps between rows for efficient scouting, fertilisation and harvesting operations which results in a permanent background spectral effect from soil or weeds (Brunsell et al., 2009). This challenge is exacerbated in areas where coffee is being produced under shade.
To ensure production continuity, farmers always grow coffee at different age groups and yet age has significant effects on the fractional components that influence the spectral signature of coffee plants (Netto et al., 2005). Furthermore, coffee has been shown to follow a specific biennial bearing effect that is related to its fruiting sequence that also has a bearing on remote sensing applications (Bernardes et al., 2012). There are also a number of coffee varieties produced and these have different growth and structural characteristics that may influence the remote sensibility of coffee plantations for crop biophysical and biochemical parameter assessment, and their relationship to yield.
In addition to the unique planting system used in coffee production system, and most importantly, production limiting factors in coffee plants are interrelated and thus may occur concurrently as confounding factors. For example, the coffee white stem borer (Monochamus leuconotus L.) is prevalent in areas of low soil fertility while Cercospora leaf spot is common in coffee with frequent water stress and nutrient imbalances (Logan & Biscoe, 1987; Kutywayo et al., 2013). Thus, it may be difficult to know exactly which factor is contributing to low agricultural productivity and what to deal with first in such instances. These broad challenges explain the limited application of remote sensing in perennial tree crops such as coffee and yet they are hugely important in that they are part of a few systems that simultaneously support economic development and ecosystem services.
1.4 Importance of multispectral remote sensing in coffee production
Remote sensing, particularly the use of hyperspectral sensors provides very promising options for early, objective and spatially resolved crop condition assessments in agricultural crops.
Hyperspectral remote sensing data consists of many, very narrow contiguous spectral wavebands located from the visible, near infrared, mid-infrared and thermal infrared portions of the electromagnetic spectrum (Blackburn, 2007; Knyazikhin et al., 2013). However, relying on the hyperspectral data for detecting and quantifying coffee condition assessments for field crop management presents challenges in data handling, dimensionality, high costs, noise and unavailability, all of which dissuade potential users from relying on this range of data for
7
determining crop condition assessments (Dube & Mutanga, 2015). New generation multispectral space-borne earth observation instruments, such as WorldView-2, RapidEye and Sentinel-2 multispectral imager have incorporated narrow wavebands including those in the red-edge position that were not available in predecessor sensors (e.g. Landsat series, MODIS, SPOT, ASTER etc).
These technological advancements therefore provide an opportunity for timely landscape or farm- based assessment of crop condition (that is health status and yield estimation). Unlike the hyperspectral sensors, multispectral sensors have a huge swath-width and are currently available at low or no costs for many developing countries where coffee is produced. They are also available sequentially, providing potential for temporal analysis of coffee condition which is important for long-term monitoring of perennial crops such as coffee.
1. 5 Aim and objectives 1.5.1 Aim
The overall aim was to develop a landscape scale approach to model spatial variability in coffee (Coffea arabica L.) condition using multispectral remote sensing data.
1.5.2 Objectives
The specific objectives were to:
1. Develop detailed age-specific thematic coffee plantation maps in heterogeneous agricultural landscapes.
2. Integrate coffee plantation age in identification and mapping of incongruous patches using multi-temporal remotely sensed data.
3. Evaluate the potential of multispectral remote sensing data for quantifying leaf water stress in coffee.
4. Assess the potential of multispectral remote sensing bands and vegetation indices for discriminating and predicting coffee leaf rust infection.
5. Determine the effects of spectral band settings, spatial resolution and crop canopy cover in predicting leaf chlorophyll content in coffee plantations.
6. Model the spatial variability in foliar nitrogen in coffee plantations with multispectral level data for agronomic decision making.
8 1.6 Description of the study area
Two study areas were used; one for experimental studies and the other for field studies.
1.6.1 Coffee Research Institute
For laboratory spectroscopy studies, research was carried out at Coffee Research Institute (CoRI) in Chipinge, Zimbabwe. CoRI is located at coordinates 20°14'4.11"S and 32°38'49.98"E at an altitude of 1100 meters above sea level (m.a.s.l.). The average annual rainfall at CoRI is 1180mm of which 80% falls in five months from November to March. The mean maximum daily temperature is 20˚C and minimum is 14˚C. Most of the soils in this area are leached and strongly weathered and in the Orthoferralitic group derived from Umkondo quartzite and sandstone (Chemura, 2014). Chipinge is in the main coffee production zone in Zimbabwe.
1.6.2: Ward 19 Chipinge District
Field studies were carried out in Ward 19 of Chipinge district, which consists of coffee estates and smallholder communal coffee farmers. The site is located in Mossurize sub catchment, South-east of Zimbabwe between latitude 32°36'1.00"E and 32°48'1.00"E, and longitude 20°20'1.00"S and 20°33'1.00"S in Chipinge district (Figure 1.1). The study site represents the current largest coffee producers in Zimbabwe in terms of volume and area. The climate of the area is subtropical with two distinct seasons, divided almost equally between months of the year (October to March is the growing season while April to September is the dry season). Compared to other parts of Zimbabwe, the area receives relatively high mean annual rainfall totals (1200-1300 mm/year) with mean annual temperatures around 22.5°C. Together with deep red clayey soils formed from mafic rocks, the climatic conditions make the area suitable for quality coffee production. As the area is dominated by large scale coffee farms, the coffee production system is sun-coffee, which means plantations are exclusively grown with coffee and not mixed with shade trees. In Chipinge district, the mean size of coffee farms is 25 ha and is dominated by Catimor varieties due to their resistance to coffee leaf rust (Chemura et al., 2015a).
9
Figure 1. 1: Map of the study area showing (a) the location of the study area in Zimbabwe (b) the sites used to identify coffee areas (c) the sites used for anomalies and (d) the site used for field
mapping of coffee condition.
1.7 Thesis structure
This thesis is presented in four sections, each with standalone chapters that can be independently read as research articles published in international journals but all aimed towards developing spatial models for coffee condition assessment. Section 1 provides an introduction and overview.
Section 2 sets the stage for coffee condition assessment where initial processes required for successful coffee characterisation are presented. Section 3 presents the experimental studies on dealing with potential biotic and abiotic confounding factors to coffee condition assessment.
Section 4 presents application of multispectral data in estimating coffee chlorophyll and nitrogen content, two important indicators of coffee condition together with the synthesis. Most of the
10
content and structure of the manuscripts submitted to peer-reviewed journals has been retained and thus each chapter has an abstract, introduction, materials and methods, results, discussion and conclusion sections. However, because of this, there are some duplications and overlaps, particularly in the introduction and methods sections of these chapters. This is assumed to be of little consequence since these chapters are independent but related peer-reviewed journal articles, that can be read separately, without losing the overall context of the study. This thesis is made up of nine chapters as summarized in the following section.
1.7.1 Section 1: Introduction and Overview 1.7.1.1 Chapter One: Introduction
This chapter serves as an introduction that gives the background and broad statement of the problem that underpins this study. It describes the importance of coffee production, its physiological and plant characteristics and how this affects remote sensing potential of the crop.
This chapter also explains the importance of multispectral level remote sensing in tropical field crops such as coffee. The aim and objectives of the study and a detailed description of the study area are also provided.
1.7.1.2 Chapter Two: Literature review
A state of the art literature review on crop condition assessments with remote sensing in coffee is presented in this chapter. A synopsis of the global coffee industry is provided together with the physiology of the coffee plant. An analysis of major coffee biotic and abiotic stressors that require monitoring is provided with an assessment of the application of remote sensing in their monitoring.
A review of reported applications of remote sensing in coffee crop management is presented together with sensors, algorithms and future perspectives.
1.7.2 Section 2: Setting the stage for coffee condition assessment
1.7.2.1 Chapter Three: Development of an age mask for coffee condition assessment
This chapter presents an approach for development of age-specific maps of coffee from multispectral remote sensing data in heterogeneous agricultural landscapes. These age-specific maps are important for use as age-masks for coffee condition assessment. The cost of producing
11
these age specific masks in terms of accuracy in comparison to general landcover maps is evaluated in relation to the utility of such a map for crop condition assessment.
1.7.2.2 Chapter Four: Identification of anomalous patches in coffee plantations
In this chapter, the age-masks produced from the preceding chapter are used to identify areas in coffee fields that are anomalous and therefore require attention. An approach using deviation from age-specific mean Normalised Difference Vegetation Index (NDVI) and Land Surface Water Index (LSWI) is developed using Landsat data and applied to monitor coffee condition over time.
The value of such an approach is analysed for field application in coffee condition assessment at various scales.
1.7.3 Section 3: Remote sensing individual coffee stressors
1.7.3.1 Chapter Five: Predicting plant water content in coffee plants using multispectral remote sensing
This chapter presents an experimental evaluation of the potential for remote sensing abiotic stress that contribute to anomalous patches in coffee plantation. A machine learning approach to predict plant water stress in coffee using multispectral level data is presented. Modelling plant water content using secondary water absorption features is presented as a promising approach for coffee condition assessment to explain anomalies.
1.7.3. 2 Chapter Six: Modelling coffee leaf rust using multispectral remote sensing
In this chapter, an experimental evaluation of the possibility to discriminate and quantify biotic factors that are responsible for causing anomalous conditions in coffee is presented. Coffee leaf rust, one of the major diseases of coffee, is discriminated into three levels (healthy, moderate and severe) using multispectral level band settings and derived vegetation indices. The severity of the infection is also quantitatively modelled. For both discrimination and severity modelling, machine learning algorithms are applied.
1.7.4 Section 4: Empirical modelling of coffee condition using multispectral data 1.7.4.1 Chapter Seven: Multispectral remote sensing of coffee chlorophyll content
Having successfully demonstrated the possibility to identify and quantify biotic and abiotic factors that can confound coffee condition assessment at field level in experimental studies, this chapter
12
presents field level application of multispectral data in estimating coffee chlorophyll content. The Sentinel-2 MSI data is used to map and quantify the spatial variability of chlorophyll in coffee fields that can be related to the biotic or abiotic factors discussed in Chapter 5 and 6.
1.7.4.2 Chapter Eight: Multispectral remote sensing of spatial variability of coffee foliar nitrogen
This chapter developed an approach for monitoring coffee foliar nitrogen, one of the most important determinants of crop productivity, with multispectral level remote sensing data. The role of spectral bands and vegetation indices and their optimisation is presented to identify important parameters for the task.
1.7.4.5 Chapter Nine: Synthesis
This chapter provides a synthesis of this research work. It presents a summary of the major findings of the study and their meaning for the coffee sector. Deductions are also made about the achievements and limitations of the presented project that feed into recommendations for future research in coffee crop condition assessment. A single reference list is provided at the end of the thesis.
13
CHAPTER 2: ADVANCES IN SENSOR APPLICATIONS FOR COFFEE (COFFEA ARABICA L.) CROP CONDITION
ASSESSMENTS AND MONITORING
This chapter is based on:
Chemura A and Mutanga O. (Under Review) Advances in sensor applications for coffee (Coffea arabica L.) crop condition assessments and monitoring, Agronomy for Sustainable Development.