Moringa oleifera crude aqueous leaf extract induces apoptosis in human hepatocellular carcinoma cells via
the upregulation of NF-kB and IL-6/STAT3 pathway
By
Letitia Shunmugam B. Sc. B. Med. Sc. (Hons) (UKZN)
Submitted in fulfilment of the requirements for the degree of Master of Medical Science In the
Discipline of Medical Biochemistry and Chemical Pathology School of Laboratory Medicine and Medical Sciences
College of Health Sciences University of KwaZulu-Natal
Durban 2016
i
DECLARATION
This dissertation contains the original work by the author and has not been submitted in any form to another university. The use of work by others has been duly acknowledged in the text. The research described in this study was carried out in the Department of Medical Biochemistry and Chemical Pathology, School of Laboratory Medicine and Medical Science, Faculty of Health Sciences, University of KwaZulu-Natal, Durban, under the supervision of Professor Anil A.
Chuturgoon and Dr Charlette Tiloke.
_____________________________ _____21 February 2017________
Letitia Shunmugam Date
ii
ACKNOWLEDGEMENTS
Firstly, all praises and thanks be to God, without his assistance and grace, nothing can be possible.
I would also like to thank:
My family, for the love, support and patience without which the completion of this thesis would not have been possible. To my Dad, I am truly grateful for all the knowledge you have instilled in me, the sacrifices you have made and the wisdom you have imparted upon me. I would not be the person I am today if it had not been for you.
Professor Anil A. Chuturgoon and Dr Charlette Tiloke for your unwavering encouragement, support and guidance, throughout the course of this thesis.
Miss Nikita Devnarain, Miss Pritika Ramharack, Miss Denelle Moodley, Miss Terisha Ghazi, Miss Bestinee Naidoo, Mr Naeem Sheik and the rest of Masters class of 2015/2016 the friends who have become family, thank you for your friendship, support and assistance.
Mrs Rene Myburg for your words of wisdom, support, advice and encouragement.
National Research Foundation and UKZN College of Health Science for the scholarship that provided financial assistance for completion of this degree.
Staff and postgraduate students of Medical Biochemistry and Chemical Pathology for their support and assistance throughout this thesis.
iii
TABLE OF CONTENTS
DECLARATION ... i
ACKNOWLEDGEMENTS ... ii
TABLE OF CONTENTS ... iii
LIST OF ABBREVIATIONS ... vi
LIST OF FIGURES ... xi
LIST OF TABLES ... xiii
ABSTRACT ... xiv
CHAPTER 1 ... 1
1.1 Introduction ... 1
1.2 Aims and Objectives ... 1
1.3 Literature Review ... 3
1.3.1 Moringa oleifera ... 3
1.3.1.1 Botanical characterisation ... 3
1.3.1.2 Distribution... 3
1.3.1.3 Traditional uses ... 3
1.3.1.4 Phytochemistry ... 4
1.3.1.5 Pharmacological activities ... 5
1.3.2 Liver ... 6
1.3.2.1 Structure and function ... 6
1.3.2.2 Cells of the liver ... 6
1.3.2.3 Xenobiotic metabolism ... 7
1.3.2.4 Cytochrome P450 ... 7
1.3.2.4.1 CYP3A4 ... 8
1.3.3 Cancer ... 9
1.3.3.1 Hepatocellular carcinoma ... 9
1.3.3.2 In-vitro model ... 10
1.3.4 Inflammation ... 10
1.3.4.1 Mediators of inflammation ... 10
1.3.4.1.1 Nuclear factor kappa -light-chain-enhancer of activated B cells (NF-kB) ... 11
1.3.4.1.2 Interleukin-6 ... 12
1.3.4.1.3 Signal transducer and activator of transcription 3 (STAT3) ... 12
1.3.5 Oxidative stress ... 14
1.3.5.1 Reactive oxygen and nitrogen species ... 14
1.3.5.2 Consequence of oxidative stress... 15
1.3.6 Fate of the cell ... 15
1.3.6.1 Poly (ADP-ribose) polymerase ... 15
iv
1.3.6.2 Apoptosis: Programmed cell death... 16
1.3.6.2.1 Extrinsic apoptosis: Death-receptor mediated pathway ... 16
1.3.6.2.2 Intrinsic apoptosis: Mitochondrial- mediated pathway ... 17
1.3.6.2.3 Execution of cell death ... 18
CHAPTER 2 ... 19
Materials and Methods ... 19
2.1 Materials: ... 19
2.2 Leaf extract preparation ... 19
2.3 Cell culture and treatment ... 19
2.4 MTT Assay ... 19
2.4.1 Introduction ... 19
2.4.2 Protocol ... 20
2.5 ATP assay ... 21
2.5.1 Introduction ... 21
2.5.2 Protocol ... 22
2.6 Cytochrome P450 3A4 activity ... 22
2.6.1 Introduction ... 22
2.6.2 Protocol ... 23
2.7 Lipid peroxidation ... 23
2.7.1 Introduction ... 23
2.7.2 Protocol ... 24
2.8 Nitrates and nitrites assay ... 24
2.8.1 Introduction ... 24
2.8.2 Protocol ... 25
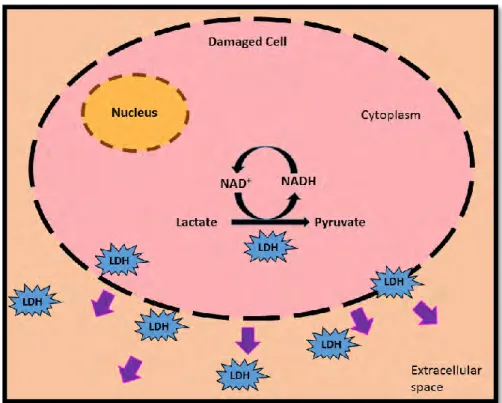
2.9 LDH Assay ... 25
2.9.1 Introduction ... 25
2.9.2 Protocol ... 26
2.10 ELISA assay ... 27
2.10.1 Introduction ... 27
2.10.2 Protocol ... 27
2.11 Caspase activity ... 28
2.11.1 Introduction ... 28
2.11.2 Protocol ... 29
2.12 Single cell gel electrophoresis (SCGE) assay ... 29
2.12.1 Introduction ... 29
2.12.2 Protocol ... 29
2.13 Hoechst assay ... 30
2.13.1 Introduction ... 30
v
2.13.2 Protocol ... 30
2.14 Western Blot ... 31
2.14.1 Protein preparation ... 31
2.14.2 Electrophoresis and Transfer ... 31
2.14.3 Immunodetection ... 32
2.15 Statistical Analysis ... 33
CHAPTER 3 ... 34
Results ... 34
3.1 Metabolism ... 34
3.1.1 MTT assay ... 34
3.1.2 ATP Assay: ... 34
3.1.3 Cytochrome P450 3A4 activity ... 35
3.2 Oxidative stress ... 36
3.2.1 TBARS assay ... 36
3.2.2 Nitrates and nitrites assay ... 36
3.2.3 LDH assay: ... 37
3.2.4 SCGE Assay ... 37
3.3 Inflammation ... 38
3.3.1 Western blot ... 38
3.3.2 ELISA ... 39
3.4 Cell death ... 39
3.4.1 Caspase activation ... 39
3.4.2 Hoechst assay ... 39
CHAPTER 4 ... 41
Discussion ... 41
CHAPTER 5 ... 45
Conclusion... 45
REFERENCES ... 46
APPENDICES ... 56
APPENDIX A ... 56
APPENDIX B ... 57
APPENDIX C ... 58
APPENDIX D ... 59
APPENDIX E ... 64
APPENDIX F ... 66
vi
LIST OF ABBREVIATIONS
% Percentage
µg Microgram
µm Micrometre
ADP Adenine diphosphate
AFB1 Aflatoxin B1
AP-1 Activator protein-1
Apaf-1 Apoptotic protease activating factor-1
APS Ammonium persulfate
ARE Antioxidant response elements
ATP Adenosine triphosphate
BCA Bicinchoninic acid
Bcl-2 B-cell lymphoma-2
Bcl-x B-cell lymphoma-2-extra-large
BH B-cell lymphoma-2 homology domain
BHT Butylated hydroxytoluene
Bid Bcl-2 homology domain-3 interacting death domain agonist
BSA Bovine serum albumin
Caco-2 Colorectal adenocarcinoma cell
CAD Caspase DNase
CARD Caspase recruitment domain
CCM Complete culture medium
cDNA Complimentary DNA
c-FLIP Cellular flice inhibitory protein
CO2 Carbon dioxide
COX-2 Cyclo-oxygenase 2
Cu+ Cuprous ion
Cu2+ Cupric ion
CYP Cytochrome P450
DD Death domain
DED Death effector domain
Dex Dexamethasone
vii
DISC Death inducing signalling complex
DM Diabetes mellitus
DMSO Dimethyl sulphoxide
DNA Deoxyribose nucleic acid
dNTP Deoxynucleotide triphosphate
EDTA Ethylenediaminetetraacetic acid
ELISA Enzyme-linked immunosorbent assay
ER Endoplasmic reticulum
ETC Electron transport chain
FAD2+ Flavin adenine dinucleotide
FADD Fas associated protein with death domain
FADH2 Flavin adenine dinucleotide
Fe3+ Ferric iron
FeO3+ Perferryl FeO3+ species
g Gram
h Hour
H+ Hydrogen
H2O2 Hydrogen peroxide
HBV Hepatitis B virus
HBx Hepatitis B viral proteins
HCC Hepatocellular carcinoma
HCl Hydrogen chloride
HepG2 Hepatocellular carcinoma cell
HRP Horseradish peroxidase
HSC Hepatic stellate cell
IAP Inhibitors of apoptosis proteins
IC50 Half maximal inhibitory concentration
ICAD Inhibitors of caspase DNase
IKB Inhibitor of Nuclear factor kappa-light-chain-enhancer of activated B-cells
IKK Inhibitor of Nuclear factor kappa-light-chain-enhancer of activated B-cells complex
IL Interleukin
viii
iNOS Inducible nitric oxide synthase
kDa Kilodaltons
LDH Lactate dehydrogenase
LMPA Low melting point agarose
LPS Lipopolysaccharide
M Molar
mA Milliampere
MCF-7 Breast adenocarcinoma cell
Mcl-1 Induced myeloid leukaemia cell differentiation protein-1
MDA Malondialdehyde
mg Milligram
Mg2+ Magnesium ion
Min Minutes
ml Millilitres
mM Millimolar
MO Moringa oleifera
MOE Moringa oleifera crude aqueous leaf extract
mRNA Messenger ribonucleic acid
mt Mitochondria/mitochondrial
MTT 3-(4, 5-Dimethyl-2-thiazolyl)-2, 5-diphenyl-2H-tetrazolium bromide
Na2EDTA Disodium ethylenediaminetetraacetic acid
NaCl Sodium chloride
NAD+ Nicotinamide adenine dinucleotide
NADH Nicotinamide adenine dinucleotide hydrogen
NADP+ Nicotinamide adenine dinucleotide phosphate
NADPH Nicotinamide adenine dinucleotide phosphate hydrogen
NaOH Sodium hydroxide
NEDD N-(1-naphthyl)ethylenediamine
NF-kB Nuclear factor kappa-light-chain-enhancer of activated B-cells
nm Nanometres
NO Nitric oxide
ix
Nrf2 nuclear erythroid factor 2
O2 Molecular oxygen
O2.- Superoxide
ºC Degrees Celsius
OD Optical density
P53 Protein 53
Panc-1 Pancreatic cancer cells
PARP-1 Poly (ADP-ribose) polymerase-1
PBS Phosphate buffer saline
pg Picogram
pH Potential hydrogen
Pi Phosphate
PMS Phenazine melosulfate
PUFAs Polyunsaturated fatty acids
Q-PCR Quantitative polymerase chain reaction
RBD Relative band density
RH Substrate
RHD Rel homology domain
RIP Receptor-interacting protein
RLU Relative light unit
RNA Ribose nucleic acid
RNS Reactive nitrogen species
R-OH Oxidised xenobiotic metabolite
ROS Reactive oxygen species
rpm Revolutions per minute
RT Room temperature
SA South Africa
SCGE Single cell gel electrophoresis
SDS Sodium dodecyl sulphate
SDS-PAGE Sodium dodecyl sulphate - polyacrylamide gel electrophoresis
SEC Sinusoidal endothelial cell
SEM Standard error of the mean
x
Smac/DIABLO Second mitochondria-derived activator of caspases/DIABLO STAT3 Signal transducer and activator of transcription 3
SULF Sulphanilamide
TBA Thiobarbituric acid
TBA/BHT Thiobarbituric acid/ butylated hydroxytoluene TBARS Thiobarbituric acid reactive substances
tBid Truncated Bcl-2 homology domain-3 interacting death domain agonist
TBST Tris buffer saline tween 20
TCA cycle Tricarboxylic acid cycle
TEMED Tetremethylethylenediamine
TNF- Tumour necrosis factor alpha
TNFR1 Tumour necrosis factor-receptor 1
TNF-α Tumour necrosis factor-α
TRADD Tumour necrosis factor –receptor 1 associated protein with death domain
TRAIL-1 Tumour necrosis factor-related-apoptosis-inducing-ligand- receptor
UDP Uridine diphosphate
USA United States of America
V Voltage
VCl3 Vanadium (III) chloride
β-actin Beta-actin
xi
LIST OF FIGURES CHAPTER 1
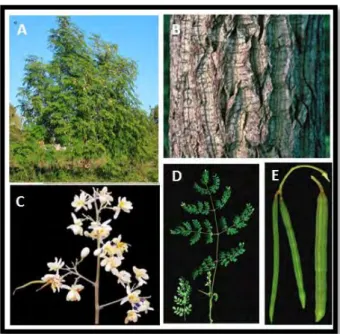
Figure 1.1: A. Moringa oleifera tree, B. Mature bark, C. Flower cluster, D. Leaves and E. Fruit
[Adapted from (Leone et al., 2015; Roloff et al., 2009)]. ... 3
Figure 1.2: Cytochrome P450 catalysed chemical reaction (Kalra, 2007). RH, O2, nicotinamide adenine dinucleotide phosphate (NADP+) and R-OH represents the xenobiotic compound, oxidant, reducing agent and oxidised xenobiotic metabolite respectively. ... 7
Figure 1.3: The catalytic cycle of cytochrome P450 3A4 (Guengerich, 1999). ... 8
Figure 1.4: Risk factors of HCC development (Prepared by author). ... 10
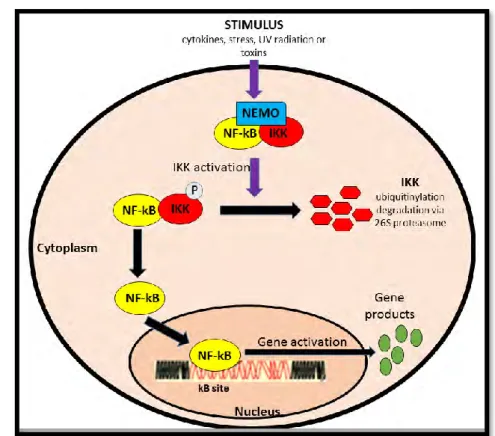
Figure 1.5: The pathway of NF-kB activation (Prepared by author). ... 12
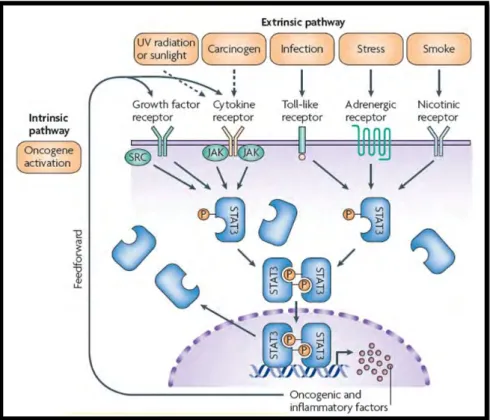
Figure 1.6: The intrinsic and extrinsic pathway of STAT3 activation linking inflammation and cancer (Yu et al., 2009). ... 13
Figure 1.7: Representation of the mitochondrial electron transport chain (Nussbaum, 2005). .. 14
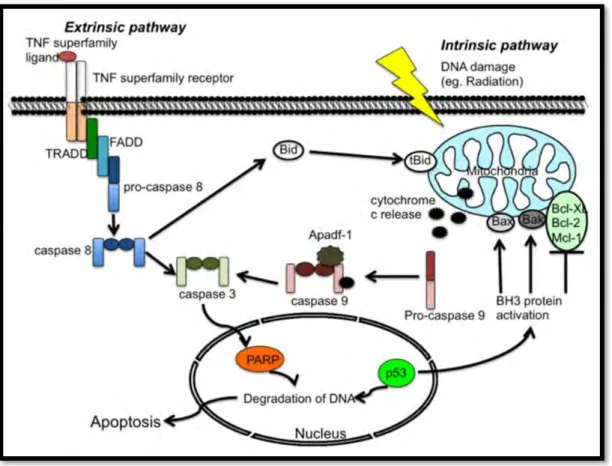
Figure 1.8: Extrinsic and intrinsic induction of apoptosis (Yuan et al., 2012). ... 17
CHAPTER 2 Figure 2.1: Reduction of MTT yellow salt to insoluble purple formazan by metabolically active cells [Adapted from (Riss et al., 2015)]. MDH: mitochondrial dehydrogenase. ... 20
Figure 2.2: Bioluminescent reaction catalysed by luciferase in the presence of ATP, magnesium and molecular oxygen [Adapted from (Riss et al., 2015)]. ... 21
Figure 2.3: Bioluminescent assessment of CYP3A4 activity [Adapted from (Cali et al., 2012)]. ... 22
Figure 2.4: Schematic representation of TBARS reaction between MDA and TBA/BHT [Adapted from (Janero, 1990). ... 24
Figure 2.5: The Griess Reaction [Adapted from (Tarpey et al., 2004)]. This involves a two-step diazotisation reaction, NO2- reacts with sulphanilamide (SULF) to produce a diazonium cation which couples to N-(1-napthyl)ethylenediamine (NEDD) to form a red-violet chromophoric diazo product (Tsikas, 2007)... 25
Figure 2.6: Schematic representation of LDH release from a damaged cell [Adapted from (Forest et al., 2015)]. ... 26
Figure 2.7: Sandwich ELISA [Adapted from (Cox et al., 2014)]. Post coating of wells, analytes binds to their respective antibodies, the biotinylated secondary antibodies are added and bind to the analytes. This is followed by the interaction of the streptavidin labelled enzyme to the biotin molecule. Lastly, an enzyme substrate is added and subsequently converted to generate a colour directly proportional to the cytokine concentration (Cox et al., 2014). ... 27
Figure 2.8: Bioluminescent quantification of caspase 8, 9 and 3/7 activity [Adapted from (Brunelle and Zhang, 2010; Riss et al., 2015)]. X represents the peptide sequence: LETD (caspase 8), LEHD (caspase 9) or DEVD (caspase 3/7). ... 28 Figure 2.9: Formation of comet tails after electrophoresis (Kumar et al., 2012). A. The head of the comet contains intact, undamaged high molecular weight DNA. B. If breaks are present in the
xii
DNA, the DNA supercoil becomes relaxed allowing the smaller DNA fragments to migrate out of the nucleus during an applied current thus forming a ‘tail’. Comet tail length indicates extent of DNA damage (Olive and Banáth, 2006). ... 29 Figure 2.10: Nuclear staining of metabolically active cell using Hoechst 33342 (Prepared by author). ... 30 Figure 2.11: Transfer of proteins from the SDS gel to the nitrocellulose membrane (Mahmood and Yang, 2012). ... 32 Figure 2.12: Overview of indirect immunodetection involving antigen-antibody interactions (Prepared by author). ... 33
CHAPTER 3
Figure 3.1: Cell viability of HepG2 cells treated with MOE for 72h. Data is represented as viable cell percentage relative to the untreated control. A dose-dependent decline was observed in HepG2
cell viability after MOE treatment. ... 34 Figure 3.2: Intracellular ATP levels were significantly depleted in MOE treated cells after 72 h (* p < 0.0441). RLU: relative light units. ... 35 Figure 3.3: MOE decreased CYP3A4 activity in HepG2 cells in comparison to the control following 72 h (*** p < 0.0004; ** p < 0.0012). ... 35 Figure 3.4: Extracellular MDA levels in Control and MOE treatment (* p < 0.05). ... 36 Figure 3.5: The nitrates and nitrites concentration in HepG2 cells following treatment with MOE (72 h) (p > 0.05).. ... 36 Figure 3.6: Extracellular LDH levels in MOE treated supernatant versus Control (** p < 0.0035).
... 37 Figure 3.7: A. Comet tails of HepG2 cells (a) prior to MOE exposure and (b) after 72 h MOE treatment (p < 0.0001). B. Comet tail length was significantly higher in MOE treated cells compared to control (*** p < 0.0001). ... 38 Figure 3.8: Western Blot images and graphs of NF-kB, p-STAT3 and cleaved PARP. Protein expression analysis showed a significant increase in A. NF-kB (* p < 0.05) and B. p-STAT3 (* p
< 0.05) in MOE treatment. MOE treated cells depicted a significant decrease in C. 89 kDa fragment (* p < 0.05) and an increase in the D. 24 kDa fragment (* p < 0.05). RFC: Relative fold change. ... 38 Figure 3.9: Hoechst 33342 stained HepG2 cells displaying cell cycle morphology. A. HepG2
control cells showing (a) metaphase, (b) anaphase, (c) early telophase and (d) interphase. B and C. MOE induced (e) chromatin hypercondensation, (f) cell shrinkage, (g) formation of apoptotic bodies and (h) apoptotic cells. ... 40
CHAPTER 4
Figure 4.1: Schematic overview of the biochemical effects of MOE in human HepG2 cells (Prepared by Author). ... 44
xiii
LIST OF TABLES CHAPTER 3
Table 3.1: Cytokine concentrations in MOE treated cells………...39 Table 3.2: Intracellular caspase 8, 9 and 3/7 activities in MOE treated cells………..39
xiv ABSTRACT
Introduction: Moringa oleifera (MO) is a highly nutritional medicinal plant mainly located in Africa and Asia. It is traditionally used to treat a diverse array of illnesses. Hepatocellular carcinoma (HCC) is one of the most common cancers worldwide and the second leading cause of cancer related deaths. This study investigated the antiproliferative and cytotoxic effect of Moringa oleifera crude aqueous leaf extract (MOE) in the HepG2 cell line.
Materials and Methods: HepG2 cells were treated with a range of MOE concentrations (0-4 000 µg/ml) over 72 h. An IC50 was obtained from the MTT assay and used in all subsequent assays.
The cells were then assayed for oxidative stress and membrane damage (TBARS and LDH cytotoxicity), apoptotic induction (ATP levels, 3/7 activities), cytochrome P450 3A4 activity (Luminometry), DNA and nuclear fragmentation (Comet and Hoechst assay). Additionally, cytokine production of IL-6 was quantified (ELISA) and relative protein expression of NF-kB, phospho-STAT3 and cleaved PARP-1 was evaluated (Western Blotting).
Results: MOE caused a dose-dependent decrease in cell viability (IC50 of 754.0 µg/ml), a significant increase in ROS-induced lipid peroxidation (1.23-fold, p < 0.05), extracellular LDH levels (1.17-fold, p < 0.0035) and significant decrease in intracellular ATP levels (1.46-fold, p <
0.0441). DNA integrity was compromised as indicated by increased DNA fragmentation (p <
0.0001). MOE increased protein expression of NF-kB (1.31-fold, p < 0.0112) and p-STAT3 (2.78-fold, p < 0.0277) whilst increasing cytokine production of IL-6 (1.20-fold, p < 0.0292).
MOE induced apoptosis by significantly increasing caspase 3/7 activity (2.83-fold, p < 0.0469).
Furthermore, MOE induced PARP-1 cleavage (1.11-fold, p < 0.0354) and apoptotic body formation in HepG2 cells.
Conclusion: MOE does not act via the inflammatory pathway in HepG2 cells however it exerts its antiproliferative, cytotoxic and genotoxic effects in human HepG2 cancer cells by affecting mitochondria activity, DNA and membrane integrity and induces apoptosis in a ROS-mediated manner.
1 CHAPTER 1 1.1 Introduction
Moringa oleifera (MO) is an edible plant, native to Northern Indian subcontinents but is now commonly distributed throughout Asia and Africa (Ramachandran et al., 1980; Anwar et al., 2007; Mbikay, 2012;). It is a highly nutritious plant consumed in many countries and is also utilised in traditional medicine but in western societies, MO remains a relatively novel food substance (Anwar et al., 2007; Shanker et al., 2007).
Almost every part of the MO plant from the leaves to the fruit, bark and seeds can be used to treat a diverse array of ailments. The leaves are the most widely cultivated part of MO due to its phytochemical composition and their associated medicinal properties. MO leaves are a rich source of kaempferol, quercetin, alkaloids, gallic acid, tannins, saponins, vitamins and minerals (Ferreira et al., 2008; Kasolo et al., 2010; Leone et al., 2015), all of which contribute to the anticancer, antiproliferative, antioxidant and anti-inflammatory properties of MO. In previous studies MO aqueous crude leaf extracts has expressed anticancer effects in both A549 lung cancer cells and SNO oesophageal cancer cells (Tiloke et al., 2013, 2016) as well as KB tumour cells (Sreelatha et al., 2011) in a ROS-dependent manner.
Inflammation is an important physiological process required to protect against infection and restore injuries sustained by tissues. Nevertheless, chronic inflammation can trigger a variety of inflammatory-associated diseases. One such disease is hepatocellular carcinoma (HCC), which is the fifth most frequent neoplasm worldwide and the second leading cause of cancer-related mortality. Primary liver malignancies account for approximately 7% of all cancers and HCC signifies more than 90% of all primary cancers (Yan et al., 2015). Chronic hepatitis B virus (HBV) infection and prolonged exposure to dietary fungal toxin, aflatoxin B1 (AFB1) are prominent factors influencing the development of HCC amongst sub-Saharan black Africans (Kew, 2010).
Other factors contributing to HCC development includes alcohol consumption, westernised diets and genetic predispositions (Sherlock and Dooley, 2008). Despite the development of new treatment modalities, HCC still remains an escalating burden in many developing countries such as South Africa and is becoming widespread throughout wealthy westernised nations (Fan et al., 2014).
This study investigated the antiproliferative and cytotoxic effects of Moringa oleifera crude aqueous leaf extract and its effect on inflammation in the HepG2 cell line after 72 hour (h) chronic exposure.
1.2 Aims and Objectives
The null hypothesis of this study is stated that MOE does not have an antiproliferative and cytotoxic effect on HepG2 cells following a chronic exposure (72 h).
The aim:
To determine the antiproliferative and cytotoxic effects of MOE on human hepatocellular carcinoma (HepG2) cells by investigating the biochemical molecular mechanisms contributing to cell death following chronic exposure.
The objectives of the study were to investigate the effects of MOE on:
Cell viability and metabolic activity in HepG2 cells using the MTT assay.
Cytochrome P450 activity and drug metabolism using luminometric quantification.
The magnitude of ROS-induced lipid peroxidation and RNS in HepG2 cells exposed to MOE by quantification of the biomarker, malondialdehyde (MDA) using the TBARS assay and the Nitrates and nitrites assay.
2
Cell membrane integrity using the lactate dehydrogenase (LDH) cytotoxicity detection assay to determine the presence of extracellular LDH and intracellular luminometric quantification of adenosine triphosphate (ATP).
The regulation, induction or inhibition of inflammatory mediators using western blotting to determine protein expression of transcription factors (NF-kB and STAT3) and ELISA to quantify cytokine production (IL-6, TNF-, IL-10 and IL-1β).
The apoptotic pathways induced using luminometric quantification of intracellular caspase (8, 9 and 3/7) activities.
DNA integrity by assessing DNA fragmentation via the comet (SCGE) assay and DNA repair enzyme PARP-1 protein expression using western blotting.
Cellular and nuclear morphological features using Hoechst nucleic stain assay.
Experimental approach:
The human hepatocellular carcinoma HepG2 cell line was used as cell toxicity model to investigate the antiproliferative and cytotoxic effects of MOE against liver cancer. Cells were treated over a 72 h period with a range of concentrations to determine cell viability. This resulted in a concentration-dependent decrease in viability and the concentration which was half the maximum inhibition (IC50) was deduced. This concentration was used to test the mechanisms underlying the biochemical effects of MOE.
3 1.3 Literature Review
1.3.1 Moringa oleifera
1.3.1.1 Botanical characterisation
The monogeneric Moringaceae plant family consists of a single Genus and 13 species (Dangi et al., 2002; Leone et al., 2015). Moringa oleifera (MO) is the most well-known and extensively studied member of the family (Ramachandran et al., 1980; Sakpere, 2016) and is commonly referred to as the “Drumstick”, “Horse radish” or “Ben oil” tree (Fahey, 2005; Spandana and Srikanth, 2016). This medium-sized, deciduous tree is rapid growing, often reaching heights between 10 to 12 metres. The thick, softwood bark appears whitish grey, branches are brittle and wide spread, surrounded by feathery greenery of tripinate leaves. It also bares bisexual yellow- white flowers in lateral clusters and pensile linear fruits (Figure 1.1) (Parrotta, 1993; Amabye and Tadesse, 2016).
Figure 1.1: A. Moringa oleifera tree, B. Mature bark, C. Flower cluster, D. Leaves and E.
Fruit [Adapted from (Roloff et al., 2009; Leone et al., 2015)].
1.3.1.2 Distribution
Classified as a perennial tree, MO has a life span greater than two years and favourably grows in tropical and subtropical geographical locations that experience dry to moist climate conditions (Leone et al., 2015). The MO tree is indigenous to the sub-Himalayan areas of India, Afghanistan, Bangladesh and Pakistan. Once utilised by ancient Egyptians, Greeks and Romans, it has now become naturalised in many tropical locations and is an important crop cultivated throughout North and South America, Asia and Africa (Ramachandran et al., 1980; Anwar et al., 2007;
Mbikay, 2012).
1.3.1.3 Traditional uses
The entire MO plant can be implemented in non-medicinal practises. The honey collected from the nectar of the flowers can be consumed, seeds are crushed and used as coagulants for water treatment and the oils are extracted and used as machine lubrication or in the production of
4
cosmetic products. The leaves are commonly crushed and used as organic domestic cleaning agents or as gaseous fuels (Fahey, 2005; Pereira et al., 2016). Worldwide, MO has mainly been associated with traditional medicine, with the leaves being utilised the most. MO leaves have high nutritional status and are therefore used as a nutritional supplement incorporated within food in developing countries plagued by malnutrition (Kasolo et al., 2010). They can also be used to treat fever, malaria, skin diseases (Stevens et al., 2013), wounds (Rathi et al., 2006), diarrhoea (Lakshminarayana et al., 2011), indigestion and eye infections (Muthu et al., 2006).
1.3.1.4 Phytochemistry
Several bioactive phytochemical compounds have been positively identified in MO leaves including vitamins, flavonoids, alkaloids, tannins, saponins, oxalates and phytates (Kasolo et al., 2010; Leone et al., 2015).
Fresh MO leaves are a rich source of vitamin A, B, C and E. Vitamin A (βeta-carotene) has major roles in several physiological processes such as cell proliferation, differentiation, apoptosis, embryonic growth and development, vision, immune proficiency and brain function (Kidmose et al., 2006). In developing countries, vitamin A deficiency is a common occurrence and may be responsible for mortality amongst women and children (Álvarez et al., 2013). Among group B vitamins, only biotin, niacin, riboflavin, thiamine and pyridoxine appear to be present in MO leaves. These vitamins principally act as enzyme cofactors involved in energy production and nutrient metabolism (Moyo et al., 2011; Leone et al., 2015). Vitamin C is a mediator of synthesis and metabolism of many compounds, like lysine, proline, glycine hydroxylation, tryptophan, folic acid and tyrosine. Additionally, it increases gastrointestinal iron absorption by reducing ferric to ferrous state and it expedites the conversion of cholesterol into bile acids to reduce blood cholesterol levels. Vitamin C serves as an antioxidant in a bid to protect the body from various destructive effects of free radicals, toxins and pollutants (Chambial et al., 2013). Vitamin E predominately functions as a lipid soluble antioxidant and modulates expression of genes. It also has an inhibitory role during cell proliferation, monocyte adhesion, platelet aggregation and bone mass regulation (Borel et al., 2013). An important component of vitamin E is -tocopherols, an antioxidant that prevents lipid peroxidation caused by the generation of free radicals. Peroxides damage cell membranes, tocopherols metabolise peroxides thus maintaining the redox state within cells. Disruption of intracellular redox state promotes oxidative stress resulting in diseases such as cancer and atherosclerosis. Elevated levels of tocopherols are found throughout the plant (Ferreira et al., 2008).
Flavonoids are omnipresent, polyphenolic plant compounds containing a benzo-γ-pyrone structure and are synthesized in response to microbial infections (Kumar and Pandey, 2013).
Epidemiological studies have shown that high flavonoid intake has protective effects against cancers, cardiovascular diseases and viral and bacterial infections (Pandey and Rizvi, 2009;
Kumar and Pandey, 2013). The two main flavonoids found in MO leaves are quercetin and kaempferol (Leone et al., 2015). Both flavonoids contain phenolic hydroxyl groups, possess antioxidant activities and provide protection against damage caused by radiation, inhibition of prostaglandin synthesis and cell cycle progression as well as mutations and carcinogenesis (Ferreira et al., 2008).
Alkaloids are a group of basic plant chemical compounds existing in nature containing oxygen, nitrogen, hydrogen and carbon atoms (Goss, 2012). A great interest has been generated with regards to alkaloids due their pharmacological activities; these plant products exert antimicrobial effects through intercalation with the DNA of microorganisms. The presence of alkaloids has been positively identified in MO leaves (Sreelatha and Padma, 2009; Kasolo et al., 2010).
5
Phenolic acids are a sub-group of naturally occurring phenol compounds derived from hydroxycinnamic and hydroxybenzoic acid (Prakash et al., 2007). Gallic acid and tannins are two important phenolic compounds present in MO leaves. Gallic acid (GA) (3,4,5-tri-hydroxybenzoic acid) is a natural triphenolic compound. It provides defence against reactive oxygen species (ROS)-induce oxidative damage and is considered to be the main contributing component responsible for antioxidant properties of MO ( Prakash et al., 2007; Badhani et al., 2015). Tannins, an important water soluble phenolic compound, bind and precipitate alkaloids and a wide variety of proteins. They have been shown to exhibit anti-hepatotoxic, anti-inflammatory and anti-cancer properties (Kancheva and Kasaikina, 2013).
Saponins are a group of natural bioactive glycoside compounds that consist of an isoprenoidal- derived aglycone, designated genin or sapogenin, linked covalently to one or more sugar molecules (Leone et al., 2015). They have anti-inflammatory, antioxidant, anticancer and immunostimulatory properties (Moses et al., 2014). Previous studies by Bauman et al. (2000) indicated saponins induced cytotoxicity in human erythrocytes by forming complexes with cholesterol present in the cell membrane leading to pore formation and permeabilisation of the cell (Baumann et al., 2000; Devisetti et al., 2016). MO leaves also possess a rather high content of oxalates and phytates, these compounds are anti-nutritional and inhibit minerals reabsorption in the intestines (Leone et al., 2015).
1.3.1.5 Pharmacological activities
Earlier studies have confirmed the pharmacological activities associated with MO such as its hypoglycaemic (Jaiswal et al., 2009), hypolipidemic (Mehta et al., 2003; Yadav and Srivastava, 2016), hypotensive (Dangi et al., 2002; Stohs and Hartman, 2015), hepato and kidney protective abilities , all of which are mainly attributed to its leaves (Leone et al., 2015).
A study by Coppin et al. (2013) confirmed the anti-inflammatory activity of three randomly selected samples of MO leaves and found that two samples actively attenuated the production of nitric oxide (NO) by bacterial lipopolysaccharide (LPS)-stimulated macrophage cells whilst the third sample was found to be non-active. The authors credited this variance to the plants chemical composition and genotype which can vary within the species (Coppin et al., 2013). An experimental study carried out by Waterman et al. (2014) utilised concentrated MO leaf derived isothiocyanates on macrophages and observed a significant decrease in the gene expression of interleukin-1 beta (IL-1β) and inducible nitric oxide synthase (iNOS). In addition, the production of NO and tumour necrosis factor alpha (TNF-) was also inhibited by both isolates (Waterman et al., 2014). Kooltheat et al. (2014) identified that the ethyl acetate extract of MO leaves prohibited interleukin-6 (IL-6), interleukin-8 (IL-8) and TNF- cytokine production by human macrophages (Kooltheat et al., 2014). Fard et al., (2015) evaluated the anti-inflammatory effect of MO hydroethanolic bioactive leaves extract and showed that it significantly inhibited the production of NO, TNF-, IL-6, and IL-1β. The bioactive compound had induced interleukin-10 (IL-10) production in a dose-dependent manner. Additionally, the extract had efficiently inhibited the expression of nuclear factor kappa-light-chain-enhancer of activated B-cells p65 (NF-kB p65), iNOS and cyclooxygenase 2 (COX-2) in LPS-induced RAW264.7 macrophages in a dose- dependent manner (Fard et al., 2015).
MO leaves also possess the capability to protect an organism against oxidative DNA damage associated with cancer. Numerous studies analysed the anticancer properties of ethanolic and water extracts of MO leaves on different types of cancer cells. The intracellular activity of MO leaves aqueous extract was a subject of interest in human KB tumour cell lines. Sreelantha and co-workers showed that MO leaves inhibit cell proliferation in a dose dependent manner (Sreelatha et al., 2011). The antiproliferative effect was accompanied by apoptosis induction, morphological cellular alterations and fragmentation of DNA. In 2013, Tiloke et al. observed a
6
significant increase in ROS concurrent with diminished intracellular glutathione levels in human A549 lung cancer cells treated with MOE (166.7 μg/ml ) brought about by the reduced expression and activation of antioxidant protein, Nrf-2. The apoptotic inducing properties of MO leaves was confirmed by significant increases in the activity of initiator caspase 9, effector caspase 3/7, p53 protein and elevated Smac/DIABLO expression in MO treated cells. MO leaves extract has also been pin pointed in the proteolytic cleavage and subsequent activation of poly (ADP-ribose) polymerase 1 (PARP-1) into 24 kDa and 89 kDa fragments. Hence, MOE exerts antiproliferative effects in A549 lung cells through the upregulation of oxidative stress, DNA fragmentation and apoptosis induction (Tiloke et al., 2013). A study carried out by Jung et al. (2015) not only confirmed the antiproliferative and apoptotic induction of tumour cell but also revealed MO leaves heightened cytotoxicity on tumour cells in comparison to normal healthy cells (Jung et al., 2015). In pancreatic cancer cells (Panc-1), MO leaves inhibited cell survival through cumulative cell apoptosis partially due to the down-regulation of NF-KB key signalling proteins (Berkovich et al., 2013). The ethanolic extract of MO leaves inhibited cell survival and proliferation of colon cancer cell lines, hepatocellular carcinoma (HepG2) , acute lymphoblastic leukaemia and acute myeloid leukaemia cells (Khalafalla et al., 2010; Pamok et al., 2012). A relatively recent cytotoxicity study by Charoensin demonstrated the cytotoxic effect of the dichloromethane extract of MO against several human cancer cell lines including breast adenocarcinoma (MCF- 7), colorectal adenocarcinoma (Caco-2) and HepG2. It was also established that the dichoromethane extract had a greater potency than the methanolic extract but both extracts were deemed non-toxic when tested on human fibroblast (Charoensin, 2014).
1.3.2 Liver
1.3.2.1 Structure and function
The liver is the largest organ of the human anatomy, it has a functional purpose in essential biological processes including bile secretion, iron and vitamin storage, plasma protein synthesis and degradation, regulation of hormones, amino acid, lipid and xenobiotic metabolism (Baynes and Dominiczak, 2007; Akhter, 2013). The human liver is comprised of four lobes and several lobules containing bile ducts, blood sinusoids and hepatocytes. The central hepatic vein passes through each lobule, surrounded by the hepatic portal vein and artery which promotes a tightly regulated communication between the liver and both the lymphatic and vascular system (Malarkey et al., 2005; Zatloukalová, 2008).
1.3.2.2 Cells of the liver
Hepatocytes are the primary cell population located within the liver, other cells include hepatic stellate cells, Kupffer cells and Sinusoidal endothelial cells (Malarkey et al., 2005). Hepatocytes are parenchymal cells representing 80% of all liver cells (Akhter, 2013). They actively partake in the hepatic production of bile as well as in the metabolism of vitamins, metals, lipids, glycides and proteins. Furthermore, these cells assist in energy storage, detoxification and excretion processes (Zatloukalová, 2008). Hepatic stellate cells (HSC) are storage cells for fats and vitamin A. In response to liver damage, HSC participate in the commencement and progression of hepatic fibrosis and thus may contribute toward hepatic carcinogenesis (Kmieć, 2001; Akhter, 2013).
Kupffer cells are hepatic macrophages activated by gastrointestinal endotoxins. These cells are known to have high secretory, endocytic and phagocytic activities (Kmieć, 2001; Choi et al., 2011). Sinusoidal Endothelial cells (SEC) are non-parenchymal cells and function as the communication mediator between the inner sinusoidal space and hepatocytes (Kmieć, 2001;
Akhter, 2013). Endothelial cells also prevent the hepatic parenchymal infiltration of pathogens.
7
Additionally sinusoidal cells participate in the regulation of blood flow, degradation of toxic agents and in metabolic exchanges between the hepatocytes and plasma (Akhter, 2013).
1.3.2.3 Xenobiotic metabolism
The liver plays a pivotal role in xenobiotic metabolism. This mechanism of detoxification facilitates excretion of foreign chemicals from the body, however this process may lead to the unintentional rise in reactive metabolite production (Zatloukalová, 2008). Pollutants present in the environment, toxins, additives in food and drugs are just a few xenobiotics that may be encountered daily through absorption via the skin or inhalation, which leads to multiple organs being exposed to toxic xenobiotic metabolites. Xenobiotics gain access to cells by either specialised protein or passive transport. Once inside the cell, the xenobiotic is metabolised by phase I and II enzymes. Phase I enzymes include cytochrome P450 enzymes(Zatloukalová, 2008), which catalyses peroxidation, epoxidation, dehalogenation, deamination and hydroxylation reactions. Phase II enzymes also known as conjugation enzymes, catalyse the conjugation of phase I metabolites for the sole purpose of creating a water soluble complex which can be efficiently excreted from the body. Glutathione, adenosine-3´- phosphate-5´-phosphosulfate and uridine diphosphate (UDP)-glucuronate serve as conjugation donors (Nebert and Dalton, 2006;
Zatloukalová, 2008).
Figure 1.2: Cytochrome P450 catalysed chemical reaction (Kalra, 2007). RH, O2, nicotinamide adenine dinucleotide phosphate (NADP+) and R-OH represents the xenobiotic compound, oxidant, reducing agent and oxidised xenobiotic metabolite respectively.
1.3.2.4 Cytochrome P450
Cytochrome P450 (CYP) proteins are a superfamily of heme-containing mono-oxygenases and they have a well-established role in drug discovery and development (Guengerich, 1999; Zangar et al., 2004). CYP enzymes are dynamically involved in regulating the synthesis and metabolism of eicosanoids, retinoic acid hydroxylation, bile acids, cholesterol, vitamin D3, biogenic amines and steroids (Nebert and Russell, 2002; Nebert and Dalton, 2006). Phase I reactions involved in the mechanism of detoxification are catalysed by CYP enzymes whereby they facilitate the addition of functional groups or modify existing functional groups located on the xenobiotics in order to create a more polar compound to aid phase II reactions (Westerink and Schoonen, 2007).
In humans, the distribution of CYPs is widespread. They can be located in the vascular smooth muscle tissues, nasal mucosa, lungs, intestine and liver. Intestinal and hepatic CYPs play fundamental roles in oxidation of xenobiotics (Zanger et al., 2004; Mukherjee et al., 2011; Pillay et al., 2013). These enzymes also have a major role in pro-carcinogen metabolic activation and the subsequent activation to carcinogens that contribute to tumorigenesis or are capable of inducing mutations within the DNA. Thus mutations arising in CYP enzymes or dysregulation of CYP associated signalling pathways may contribute toward cancer development and disorders in organs such as the liver (Nebert and Russell, 2002; Nebert and Dalton, 2006).
8 1.3.2.4.1 CYP3A4
The CYP3A enzyme subfamily is the most abundantly expressed CYP and comprises of three isoforms, CYP3A7, CYP3A5 and CYP3A4. The most highly expressed CYP is CYP3A4 within the liver and small intestine where it represents 50% of the CYP total content and it plays a significant role in the metabolism of xenobiotic and drugs (Guengerich, 1999; Basheer and Kerem, 2015). The CYP3A4 enzyme is expressed to a lesser extent in extrahepatic tissues such as the lung (Pillay et al., 2013). The CYP catalytic cycle involves molecular oxygen (O2) reduction and oxidation. The enzyme, nicotinamide adenine dinucleotide phosphate hydrogen (NADPH)-P450 reductase provides electrons for the oxidation of NADPH. Generally, the cycle is initiated by the binding of substrate (RH) to the CYP’s active heme-centre. The ferric iron (Fe3+) is reduced, followed by the binding of O2, reduction of O2 and cleavage of O2 at the O-O bond leading to the formation of water. The substrate undergoes reaction with the active perferryl FeO species (FeO3+) and finally the product is released, as seen in Figure 1.3 (Guengerich, 1999; Pillay et al., 2013). The CYP catalytic cycle produces ROS as a by-product. Electrons are leaked out during the cycle at various steps causing the continuous formation of ROS. Puntarulo and Cederbaum (1998) conducted a study investigating CYPs ability to generate ROS and found that CYP3A4 was the most active CYP isoform in catalysing NADPH oxidation and producing superoxide (O2·-) (Puntarulo and Cederbaum, 1998; Pillay et al., 2013).
Figure 1.3: The catalytic cycle of cytochrome P450 3A4 (Guengerich, 1999).
Drug-drug interactions that alter the activity of CYP3A4 have been extensively studied.
Consumption of drugs in combination may lead to one drug proficiently controlling the metabolism of the second drug through CYP3A4 induction or inhibition. This may result in either toxic levels of the drug or sub-therapeutic levels. In the same way, phytochemical compounds found in medicinal plants may inhibit or induce CYP3A4 and are therefore vulnerable to alterations arising in co-administered drug metabolism which may contribute to the risk of severe adverse reactions (Mukherjee et al., 2011; Pillay et al., 2013). On the other hand, CYP3A4 induction may lead to amplified drug elimination resulting in reduced drug plasma concentrations, diminished efficiency and effectiveness and failure of treatment (Mukherjee et al., 2011).
9
Another possibility that may arise is increased xenobiotic metabolism such as carcinogens. This may lead to the bioactivation and transformation of substances resulting in toxic and highly reactive metabolites being formed (Westerink and Schoonen, 2007; Pillay et al., 2013).
1.3.3 Cancer
1.3.3.1 Hepatocellular carcinoma
Cancer is defined as “a group of diseases characterised by unregulated division and spread of abnormal cells” (Auyang, 2006). Solid malignant tumours are a common occurrence and develop within various bodily tissues including the prostrate, breast, colon and liver. Usually malignant tumours can be treated or removed if it remains localised however they often tend to metastasise.
Metastasis is a process involving the evasion of the cancer cells from the immune response, in doing so, the cancer cells survive and migrate away from the parent mass, gaining access to the blood or lymphatic circulation. They invade surrounding tissues and organs where they form lethal secondary tumours (Auyang, 2006).
In spite of the liver’s detoxification and regenerative capacity, it remains the main target for toxin- induced liver damage by xenobiotic agents. Congenital and genetic predispositions, drugs, hepatitis viruses, diabetes mellitus type 2, westernised diets, alcohol and chronic inflammation are a few main factors that facilitate the development and progression of hepatic diseases ranging from fibrosis and cirrhosis to acute liver failure (Sherlock and Dooley, 2008; Koh et al., 2013).
These hepatic diseases are prominent predispositions for the development of hepatocellular carcinoma (HCC) (Figure 1.4). Worldwide, HCC is the most common occurring cancer and is mainly associated with hepatic cirrhosis and hepatitis B viral infections. Several cellular mechanisms and molecular pathways are evidently modified during hepatic carcinogenesis (Zatloukalová, 2008). Chronic viral infections such as hepatitis B virus (HBV) and continuous long term exposure to dietary fungal toxin, aflatoxin B1 (AFB1) are eminent factors in development of HCC amongst sub-Saharan black Africans (Kew, 2010). HBV association with HCC development is through its various mechanism some of which include gene expression deregulation of important cell survival (p53), differentiation (E-cadherin) and proliferation (AP- 1, NF-κB and Wnt/β-catenin) genes. It also has the ability to activate or deactivate of retinoic acid β-receptor or cyclin A. additionally, HBV prompts epigenetic modifications and causes instability of chromosomes which arises from the insertion or deletion of provirus or by the direct effects exerted by the viral HBx proteins (Zatloukalová, 2008). AFB1 exerts is tumorigenic effect through inactivation of cell cycle regulation, gene expression of p53 protein and by directly reacting with DNA molecules ultimately resulting in the formation of DNA adduct and tumour initiation (Zatloukalová, 2008). Even though the pathogenesis of HCC has been extensively studied, the molecular mechanisms underlying the aetiology of HCC remain poorly understood, particularly in regard to the role and influence of xenobiotics in the initiation of hepatic carcinogenesis (Zatloukalová, 2008).
10
Figure 1.4: Risk factors of HCC development (Prepared by author).
1.3.3.2 In-vitro model
The attenuation of prospective drugs during the late stages of drug development is commonly attributed to drug-induced hepatic injury. Accordingly, early detection of drug-induced hepatotoxicity is a necessity prior to compounds being tested in animals and clinical trials in effort to save resources and time (Gerets et al., 2012). In vitro model systems are often utilised in toxicity studies as it allows the study of dose-response relationships, enzyme kinetics, mechanisms of toxicity and chemical metabolism (Soldatow et al., 2013). In vitro models have many advantages including reduced time requirements, small quantities of reagents are needed, number of animal test subjects are reduced as well as the minimised cost of animal care and maintenance (Soldatow et al., 2013).
Hepatocellular carcinoma (HepG2) cells are endothelial cells derived from the liver of a 15 year old Caucasian male. They are highly differentiated cells that exhibit many of the genotypic characteristics of normal hepatocytes. Hence, HepG2 cells are considered as a good cell model system for studies pertaining to drug design and development, mechanisms underlying hepatocarcinogenesis, xenobiotic metabolism, cytotoxicity and genotoxicity (Soldatow et al., 2013).
1.3.4 Inflammation
1.3.4.1 Mediators of inflammation
Inflammation is a fundamental part of wound healing in response to hepatic injury. Acute inflammation is beneficial as it promotes regeneration following traumatic injuries to the liver or induces the immune response to target and eradicate abnormal cells. However chronic inflammation is pernicious as persistent hepatic injury and its associated regenerative wound healing responses lead to the sequential development of fibrosis, cirrhosis and eventually
11
hepatocellular carcinoma (Luedde and Schwabe, 2011; Hoesel and Schmid, 2013; Bishayee, 2014). The three distinct mediators of inflammation are nuclear factor kappa-light-chain-enhancer of activated B cells (NF-kB), interleukin-6 and signal transducer and activator of transcription 3 (STAT3).
1.3.4.1.1 Nuclear factor kappa -light-chain-enhancer of activated B cells (NF-kB)
NF-kB is a dimeric complex consisting of subunits belonging to the Rel family of DNA binding proteins: p105/p50, p100/p52, RelB, c-Rel and p65 (RelA) which regulates the transcription of genes involved in cell survival, growth and differentiation, immune responses and inflammation (Beinke, 2004). NF-kB proteins have the Rel homology domain (RHD) enabling binding to DNA, dimerisation and nuclear localisation. Under normal physiological conditions, subunits p50 and RelA of dimerised NF-kB are cloistered in the cytoplasm by binding to the inhibitor of NF-kB (I-kB) proteins which consists catalytic subunits, IKK and IKKβ and a regulatory subunit IKK γ/NEMO (Ben-Neriah and Karin, 2011). Upon a specific stimulation such as chemotherapeutic agents, stress inducers or cytokines, I-kB is phosphorylated thereby triggering its ubiquitination and degradation by the 26S proteasome. Liberated NF-kB dimer translocates to the nucleus to initiate gene transcription by binding to the kB site also identified as the consensus DNA sequence 5'-GGGRNNYYCC-3' where N is any base, Y indicates cytosine or thymine and R indicates adenine or guanine (Antonaki et al., 2011). NF-kB dimerised complex is further regulated by protein phosphorylation as well as post translational modifications including protein acetylation.
It also is responsible for activation of genes involved in cell death inhibition, promotion of migration and invasion of transformed cells and tumorigenesis associated mesenchymal stem cell formation (Figure 1.5) (Ben-Neriah and Karin, 2011). A possible link between cancer and NF-kB first became evident during the cloning of the p65 encoding gene, RelA. It was identified to be homologous to v-Rel, a viral oncogene. Constitutively activated NF-kB is observed in most lymphoid and solid tumours. In majority of cancer cells, NF-kB activation is maintained as a response to extracellular stimulus within the tumour microenvironment or through mutations of signalling molecules upstream of active NF-kB (Ben-Neriah and Karin, 2011). The RelA and p50 NF-kB heterodimeris crucial in the induction of inflammatory response and NF-kB -mediated pro-oncogenic activities (Yu et al., 2009).
12
Figure 1.5: The pathway of NF-kB activation (Prepared by author).
1.3.4.1.2 Interleukin-6
Within the tumour microenvironment, STAT3 activation is dependent on NF-kB. As in most tumours, persistent activation of RelA requires continuous STAT3 signalling. Thus STAT3 signalling increases NF-kB activity. This reciprocal relationship existing between STAT3 and RelA stems from the fact that growth factors and cytokines encoded by RelA are activators of STAT3. The most crucial and important STAT3 activator downstream of NF-kB is interleukin- 6 (IL-6) (Yu et al., 2009; Wang et al., 2011). Interleukin-6 is a pleiotropic cytokine exhibiting both pro and anti-inflammatory characteristics. This cytokine is able to exert its effects on different cell populations within the inflammatory and immune systems. IL-6 is functionally involved in B cell differentiation, T-cell activation, malignancy development and progression and chronic inflammation (Choi et al., 1994; Hunter and Jones, 2015).
1.3.4.1.3 Signal transducer and activator of transcription 3 (STAT3)
STAT proteins have a central role in cytokine signalling pathways involved in cellular growth, proliferation and differentiation. The STAT family comprises of seven members: STAT1, STAT2, STAT3, STAT4, STAT5a, STAT5b, and STAT6. A distinguishable feature of STAT proteins is their dual role: in the nucleus they function as transcription factors and transduce signals through the cytoplasm (Yu et al., 2009). Among the STAT members, STAT3 has garnered great interest in regard to its role in oncogenic signalling pathways and its influence in the regulation of signal transduction pathways of pro-inflammatory cytokines functional in hepatic damage and repair mechanisms (Bishayee, 2014). Inflammation and cancer are interconnected through both the intrinsic and extrinsic pathway of STAT3 activation. In transformed cells, the intrinsic pathway also known as the oncogenic pathway is activated by epigenetic or genetic
13
alterations such as persistent activation or overexpression of cytokine receptors with accompanying Janus kinase (JAK) family of tyrosine kinases and growth factor receptors with intrinsic activity of tyrosine kinase. Inducers of the extrinsic or environmental pathway include cigarette smoking, stress, UV radiation or carcinogens (Schmidt-Arras and Rose-John, 2016). The IL-6-STAT3 signalling pathways is initially activated by the ligation of IL-6 to its corresponding receptor. Signalling is then activated upon IL-6/IL-6R complex association with glycoprotein receptor, GP130. The GP130 receptor undergoes dimerisation and in doing so, activates tyrosine kinase JAK1 causing the phosphorylation of STAT3 protein (Schmidt-Arras and Rose-John, 2016). Phosphorylated STAT3 forms dimers and then translocates to the nucleus for direct regulation of gene expression cell proliferation, survival, invasion and metastasis. Additionally STAT3 induces the expression of inflammatory mediators including cyclo-oxygenase 2, IL-10 and IL-6, the latter of which results in further activation of STAT3 thus forming an autocrine and paracrine feedback mechanism ultimately resulting in alterations of the genetic programme and advancement of cancer associated inflammation (Figure 1.6) (Yu et al., 2009).
Figure 1.6: The intrinsic and extrinsic pathway of STAT3 activation linking inflammation and cancer (Yu et al., 2009).
Hepatocellular carcinoma as the result of chronic inflammation is mainly induced by viral exposures, environmental pollutants, cigarette smoking and alcohol consumption (Aggarwal et al., 2006). It has been established that although inflammation aids in immune responses, on a chronic level, it appears to have pro-oncogenic properties (Grivennikov et al., 2010). Chronic inflammation is responsible for the overproduction of ROS, reactive nitrogen species (RNS), and inflammatory cytokines. This excessive production of ROS and RNS can eventually lead to oxidative stress and cellular DNA damage (Zhang, 2011).
14 1.3.5 Oxidative stress
1.3.5.1 Reactive oxygen and nitrogen species
ROS typically exist at low levels in aerobic cells and is formed during the metabolism of molecular oxygen (Waris and Ahsan, 2006). However, ROS can also be generated during exposure to ultraviolet (UV) radiation, reactions catalysed by metals or produced by phagocytes during inflammation (Waris and Ahsan, 2006; Rahman, 2007).
Mammalian cells depend on the mitochondria to generate energy in the form of ATP through oxidative phosphorylation, a process involving the transfer of electrons through the electron transport chain (ETC) (Martinou and Youle, 2011). The ETC is made up of enzyme-dependent complexes: complex I (NADH-Q oxidoreductase), II (succinate-Q reductase), III (Q- cytochrome c oxidoreductase), IV (cytochrome c oxidase) and V (mitochondrial ATP synthase) (Berg et al., 2002). Briefly, nicotinamide adenine dinucleotide (NADH) donates a free proton to complex I which then transfers it to flavin mononucleotide (FMN) to produce flavin mononucleotide (reduced form), during this process electrons are released from NADH. Complex I transfers electrons to Flavin-adenine dinucleotide (FAD) from succinate. Electrons from both complexes are transferred to complex III via ubiquinone (co-enzyme Q). Ubiquinone carries electrons to complex III through redox reactions together with the generation of a proton gradient across the inner mitochondrial membrane. Complex IV produces a proton gradient against the transmembrane by receiving electrons from cytochrome c. Electrons are received at the active sites of complex IV with molecules of iron, copper and haem. Using the proton gradient provided, oxygen is reduced to two molecules of water by complex IV and ATP is synthesised from adenosine diphosphate (ADP) and orthophosphate (Pi) through complex V(Figure 1.7) (Berg et al., 2002).
Figure 1.7: Representation of the mitochondrial electron transport chain (Nussbaum, 2005).
Within living cells, the main source of ROS is superoxide anion and hydrogen peroxide, both of which are produced as by-products of mitochondrial respiration (Waris and Ahsan, 2006). These highly reactive molecules have a dual effect as they can either be beneficial or harmful. When tightly regulated, ROS can provide added defence against infectious substances and is a functional component of cell to cell communication systems, however during adverse conditions, the balance between ROS and their elimination may be disrupted causing a significant increase in the level of
15
ROS, mediating damage to cellular membranes, lipids and proteins. This damage is classified as
“oxidative stress” (Wei et al., 2000; Rahman, 2007). DNA damaged induced by ROS has been widely recognised as a major cause of cancer (Waris and Ahsan, 2006).
Reactive nitrogen species (RNS) is another variation of oxidants derived from nitric oxide (NO), which include nitrogen dioxide (NO2), peroxynitrite (ONOO-), nitrosoperoxycarbonate (ONOOCO2-) (Nash et al., 2012). A reaction between O2- and NO2 actively generates ONOO- and is deemed the most highly reactive RNS. It is primarily responsible for the oxidative and nitrative damage to biological cellular components including proteins, lipids and DNA (Dedon and Tannenbaum, 2004).
1.3.5.2 Consequence of oxidative stress
In pathological conditions, ROS and RNS are generated at a substantially higher rate than in the normal physiological state, and as a consequence, lipid peroxidation occurs. Lipid peroxidation is initiated by abstraction of hydrogen atoms from lipids containing two or more carbon atoms or by the addition of oxygen radicals resulting in undue oxidative damage towards polyunsaturated fatty acids (PUFAs) (Halliwell, 2006; Repetto et al., 2012; Ayala et al., 2014). This results in a single unpaired electron on the carbon atom forming a “carbon-centred radical” (Repetto et al., 2012). The lipid radical firstly undergoes a molecular rearrangement to stabilise the double carbon bonds and then subsequently reacts with O2 to form peroxyl radicals. The peroxyl radical by itself, is capable of removing a hydrogen atom from another PUFA and so starts a chain reaction (Repetto et al., 2012). Peroxyl radicals readily attack adjoining side-chains and mediate the oxidation of proteins within the cell membrane (Halliwell, 2006) leading to the eventual destruction of the lipid membrane accompanied with the generation of a variety of decomposition products including ethers, aldehydes ketones and hydroperoxides which exerts genotoxic and cytotoxic effects (Esterbauer, 1993; Niki et al., 2005; Repetto et al., 2012). Lipid peroxidation, is thus the main molecular mechanism responsible for cellular oxidative damage and through the toxicity process, it is capable of inducing cell death (Repetto et al., 2012; Ayala et al., 2014).
1.3.6 Fate of the cell
1.3.6.1 Poly (ADP-ribose) polymerase
DNA damage is repaired by numerous proteins including those that cause cell death to prevent the future transmission of mutations or disrupt the cell cycle. Poly (ADP-ribosyl)ation is a post- translation modification of nuclear proteins consisting of the synthesis of ADP-ribose polymers on target proteins, in response to DNA damage. Synthesis of poly (ADP-ribose) is solely carried out by members of the poly (ADP-ribose) polymerase family but majority is by the most active and abundant member, poly (ADP-ribose) polymerase-1 (PARP-1). PARP-1 is a 113 kDa, zinc fingered protein consisting of 1014 amino acids. It has been implicated in several biological cellular processes including genome stability, DNA transcription, replication and repair, signalling for degradation of protein, energy source required for base excision repair and regulation of telomerase activity. Typically, in the absence of DNA damage, poly (ADP- ribosyl)ation levels are relatively low in the absence of DNA damage however in response to double or single stranded DNA breaks, PARP-1 becomes rapidly activated. In response to DNA strand breaks, PARP-1 becomes active and subsequently prompts poly (ADP-ribose) synthesis at the expense of nicotinamide adenine dinucleotide (NAD+) which is cleaved into nicotinamide and ADP-ribose. On the target acceptor protein, PARP-1 catalyses ADP-ribose binding at the glutaminic residue thereby facilitating the elongation and branching of the protein. Inversely, decreased levels of NAD+ results in an unbalanced NAD+/NADH ratio which affect the Kreb’s cycle, pentose shunt and glycolysis due to aberrant activation of enzymes. The redox state of cells
16
are also significantly altered as the cell attempts to revive the NAD+ stores by recycling nicotinamide with two ATP molecules. However during this process, excessive PARP-1 activation leads to the depletion of intracellular ATP and NAD+. As a result, majority if not all energy-dependent cellular processes are suddenly disrupted. Therefore, in incidences of widespread DNA damage, excessive poly(ADP-ribose) synthesis drives the cell to its death (Bouchard et al., 2003). During apoptosis, executioner capase 3/7 cleaves PARP-1 into two fragments, an 89 kDa and 24 kDa fragment. This cleavage prevents the repair of DNA strand breaks, ultimately resulting in cell death (Erener et al., 2012).
1.3.6.2 Apoptosis: Programmed cell death
Multicellular organisms maintain their functionality through the regulation of homeostasis and developmental processes by maintaining the appropriate balance between cell proliferation and death. Billions of cells on a daily basis undergo programmed cell death as it allows the cell numbers to be closely regulated (Hengartner, 2000; Sreelatha et al., 2011; Govender, 2012).
Apoptosis is a process by which cells are extracellularly or intracellularly signalled to their demise as a cellular defence mechanism used to eliminate cells damaged by toxic agents, normal metabolic processes or disease (Elmore, 2007; Sreelatha et al., 2011). Apoptotic cell death is energy-dependent and consists of an orchestrated set of events involving multiple caspase activation and a multiplex cascade that relates the initial stimuli to the death of the cell (Elmore, 2007). Intracellular caspases are cysteine-rich proteases that govern programmed cell death (Circu and Aw, 2010; Govender, 2012). They are synthesised as procaspases and require proteolytic cleavage for activation (Ashe and Berry, 2003). In humans, more than twelve caspases have been identified and about two thirds have been involved in the function of apoptosis (Hengartner, 2000). Caspases are classified into two groups: initiators and executioners (Govender, 2012).
Both of the caspase groups, the initiator caspases (caspases 8 and 9) become activated through homodimerisation and they subsequently cleave and activate the executioner caspases (caspase 3 and 7). Caspase 3/7 are responsible for the morphological changes characteristic of apoptotic cell death, such as shrinkage of cells, chromatin condensation, DNA fragmentation, membrane blebbing and apoptotic body formation (Hengartner, 2000; Circu and Aw, 2010; Govender, 2012).
Apoptosis is divided into two pathways: extrinsic and intrinsic but ultimately both pathways converge to execute the final phase of cell death (Elmore, 2007). The extrinsic apoptotic pathway is activated through death receptor-ligand binding. The intrinsic pathway initiates apoptosis through a variety of stimuli including hypoxia, radiation, growth factor deprivation, DNA damage or oxidative stress (Mukhopadhyay et al., 2014).
1.3.6.2.1 Extrinsic apoptosis: Death-receptor mediated pathway
The extrinsic pathway is induced by the interaction between the Tumour necrosis factor (TNF) superfamily and a specific associated ligand. FAS (CD-95), TNF receptor 1 (TNFR1), TNF- related apoptosis-inducing ligand-receptor 1 and 2 (TRAIL 1 and 2) are the most understood and best characterised members of the TNF superfamily (Ashe and Berry, 2003). Ligation of TNFR1 and TNF- α causes the trimerisation of the death receptor followed by the clustering of the death domains (DD) (Ashe and Berry, 2003; Elmore, 2007). The DD transmits a death signal from the cellular surface to the signalling pathways within the cell. TNFR1- associated death domain (TRADD) is recruited and binds to the DD followed by FAS-associated death domain (FADD) and receptor-interacting protein (RIP). FADD contains a death effector domain (DED) that associates with procaspase 8 via dimerization and the death inducing signalling complex (DISC) is then formed. This results in procaspases 8 being auto-catalytically cleaved for activation thereby triggering the execution step of apoptosis involving the cleavage and activation of

![Figure 2.2: Bioluminescent reaction catalysed by luciferase in the presence of ATP, magnesium and molecular oxygen [Adapted from (Riss et al., 2015)]](https://thumb-ap.123doks.com/thumbv2/pubpdfnet/10717106.0/36.892.186.703.510.1007/bioluminescent-reaction-catalysed-luciferase-presence-magnesium-molecular-adapted.webp)
![Figure 2.3: Bioluminescent assessment of CYP3A4 activity [Adapted from (Cali et al., 2012)]](https://thumb-ap.123doks.com/thumbv2/pubpdfnet/10717106.0/37.892.200.688.589.1048/figure-bioluminescent-assessment-cyp3a4-activity-adapted-cali-2012.webp)
![Figure 2.4: Schematic representation of TBARS reaction between MDA and TBA/BHT [Adapted from (Janero, 1990)]](https://thumb-ap.123doks.com/thumbv2/pubpdfnet/10717106.0/39.892.171.705.122.546/figure-schematic-representation-tbars-reaction-mda-adapted-janero.webp)
![Figure 2.7: Sandwich ELISA [Adapted from (Cox et al., 2014)]. Post coating of wells, analytes binds to their respective antibodies, the biotinylated secondary antibodies are added and bind to the analytes](https://thumb-ap.123doks.com/thumbv2/pubpdfnet/10717106.0/42.892.227.663.407.778/sandwich-adapted-analytes-respective-antibodies-biotinylated-secondary-antibodies.webp)