UNIVERSITY OF KWAZULU-NATAL
MUNICIPAL COST RECOVERY: TAX EXEMPTION AS AN INCENTIVE FOR CONSUMER PAYMENT AT UGU DISTRICT MUNICIPALITY
BY
NOEL NYAWADE
STUDENT NUMBER: 214580183
A DISSERTATION SUBMITTED IN PARTIAL FULFILLMENT OF THE REQUIREMENTS FOR THE DEGREE OF MASTER OF BUSINESS
ADMINISTRATION
GRADUATE SCHOOL OF BUSINESS & LEADERSHIP COLLEGE OF LAW AND MANAGEMENT STUDIES
SUPERVISOR:
DR. PFANO MASHAU YEAR: 2018
ii
ACKNOWLEDGEMENTS
First and foremost, I would like to thank my supervisor, Dr Pfano Mashau, for his outstanding support, encouragement, willingness and his precious time to assist in guiding me to carry out this research.
Special mention goes to the Ugu District Municipality and its officials, for affording me the privilege to carry out this project within their systems.
Special mention also goes to all the respondents of the questionnaire, without whom data could not have been obtained.
I would also like to express my appreciation and gratitude to Mr Layton Ruredzo, for the support given to me in order for this research to be a success.
Heartfelt gratitude goes to my lovely family members, wife Mrs Letta Nyawade and our princess Uhuru Nyawade, for the patience and support that they gave me in pursuing my studies and accepting the clutter of paperwork all over your home.
iii ABSTRACT
The aim of the study was to establish whether tax exemption would serve as an incentive for consumers to pay for municipal water services. The Ugu District Municipality, as water service provider, was selected for case study. Due to poor cost recovery for services rendered, the purpose of the study was to establish the whether such an incentive can improve recovery rate.
In order to fulfil the objective of the study, a quantitative approach to methodology was employed. In this view, a random sample of 381 consumers was selected to participate in the study. An online questionnaire was distributed through social networks Facebook and WhatsApp applications to reach the participants of the study.
The findings of the study revealed that consumers in the low-income bracket do not pay for water services because they cannot afford to do so, which often results in some of them resorting to illegal connections of the water services. It was also revealed that the consumers do not trust the billing system by the municipality, believing that they are being charged for excessive amounts of water volumes compared to their actual consumption. As a result of the perceived over-charging, the consumers end up not paying for the water services. The participants of the study also noted that tax exemption can serve as an incentive to allow them to pay for water services. The results also highlighted that the municipality does not consult the registered consumers with regards to tariff structures, which makes them feel not being recognized and involved in municipal affairs that affect them. This demoralizes them and encourage them not to pay for municipal services. Based on the findings of the study, it was recommended that the municipality should undergo organizational regeneration in order to gain acceptance as an efficient organization delivering the correct bills, and that it should increase consumer participation in tariff structure reviews. It was also recommended that the municipality lacks adequate capacity to deal with defaulters, to prevent further illegal connections. The study also indicated that the majority of the participants would be more willing to pay for municipal services if the money spent can be exempted from tax.
Key words: tax exemption; incentives; water services; cost recovery.
iv
Table of Contents
DECLARATION ... i
ACKNOWLEDGEMENTS... ii
ABSTRACT ... iii
CHAPTER ONE ... 1
1 Introduction ... 1
1.1 Motivation for the Study ... 2
1.2 Focus of the Study ... 3
1.3 Problem Statement ... 4
1.4 Objectives of the Study ... 5
1.5 Research Question ... 5
1.6 Methodology ... 6
1.7 Limitations of the study ... 6
1.8 Structure of the Dissertation ... 7
1.9 Conclusion ... 8
CHAPTER TWO ... 9
LITERATURE REVIEW ... 9
2.1 Introduction ... 9
2.2 Legislative Framework... 9
2.3 Effects of Fiscal Decentralisation ... 10
2.4 Municipal Financing Model ... 11
2.5 Municipalities as Water Service Providers ... 12
2.6 Water Sector Subsidy: Cause, Effect and Remedial Measures ... 13
2.7 Free Basic Water Policy: A Critique ... 13
2.8 Cost-Recovery Rationale ... 14
2.9 Municipal Cost Recovery Models ... 15
2.10 Water Supply Cost Recovery Mechanism Infrastructure ... 16
2.10.1 Conventional Metering Systems ... 17
2.10.2 Prepaid Systems ... 18
2.10.3 District Metering ... 18
2.10.4 Flat Rate ... 19
2.11 Factors Affecting Cost Recovery ... 19
2.11.1 Service Delivery Perception... 19
2.11.2 Free Basic Water Policy ... 19
v
2.11.3 Consumer Income ... 20
2.11.4 Dealing with Defaulters ... 20
2.11.5 Illegal Connections ... 20
2.12 Impact of Incentives on Consumer Behaviour ... 20
2.13 Tax and Tax Exemption: Definition ... 21
2.14 Current South African Personal Tax Exemption Categories ... 22
2.14.1 Retirement Savings and Medical Aid Contributions ... 22
2.14.2 Foreign Employment Income Exemption ... 23
2.14.3 Employer Provided Bursaries to Learners with Disabilities Tax Exemption ... 23
2.14.4 Transfer of Retirement Fund Benefits on Reaching Normal Retirement Date Exemption ... 24
2.15 Advantages of Tax Exemption ... 24
2.16 Conclusion ... 24
CHAPTER THREE ... 26
RESEARCH METHODOLOGY ... 26
3.1 Introduction ... 26
3.2 Research Design ... 26
3.3 Research Strategy ... 27
3.4 Study Area ... 27
3.5 Population and Sample ... 28
3.5.1 Sampling Design ... 29
3.5.2 Sample Size ... 30
3.6 Data Collection ... 31
3.6.1 Purpose of the Instrument ... 32
3.6.2 Construction of the Instrument ... 33
3.6.3 Pre-testing of the Questionnaire... 34
3.6.4 Distribution of the Questionnaire ... 35
3.7 Data Analysis ... 35
3.8 Reliability and Validity of the Data ... 36
3.9 Bias of the Data ... 37
3.10 Ethical Considerations ... 37
3.11 Conclusion ... 38
CHAPTER FOUR ... 39
RESEARCH PRESENTATION, ANALYSIS AND INTEPRETATION ... 39
4.1 Introduction ... 39
vi
4.1.1 Treatment of the Data ... 39
4.1.2 Reliability of the Data ... 40
4.1.3 Presentation of the Data ... 41
4.2 Demographic Data ... 41
4.3.1 Gender of Respondents... 41
4.3.2 Age Distribution of Respondents ... 41
4.3.3 Education Level of Respondents ... 42
4.3.4 Location of Respondents’ Household ... 43
4.3.5 Economic Status of the Respondents ... 44
4.3.6 Level of Monthly Income ... 44
4.3 Billing and Cost Recovery Information ... 45
4.4.1 Sufficiency of Resources for Accurate Billing ... 45
4.4.2 Consumers are Billed on Actual Amounts Consumed ... 46
4.4.3 Consumers are Billed on Estimated Volumes ... 47
4.4.4 Estimated Volumes Match Consumer’s Average Consumption ... 47
4.4.5 Consumers are Consulted on Tariff Structure ... 48
4.4.6 Affordability of the Tariff Structure... 49
4.4.7 Sufficiency of Mechanisms to Deal with Defaulters ... 50
4.4.8 Incentives for Regular Payments ... 50
4.4 Opinion Information ... 51
4.5.1 Opinions on Water Accounts Payment in Relation with Levels of Income ... 51
4.5.2 Tax Exemption Incentive in Improving Cost-Recovery ... 52
4.5.3 Reduction in Tariffs in Improving Cost-Recovery ... 53
4.5.4 Municipal Efforts in Improvising Cost-Recovery Techniques ... 53
4.5 Cross Tabulation and Inferential Statistics ... 54
4.6.1 Cross tabulation between Monthly Income Level and Affordability ... 54
4.6.2 Cross Tabulation between Consumers’ Average Consumption and Estimated Volume Billed ... 56
4.6.3 Cross Tabulation between Introduction of Tax Exception against Current Incentive Schemes 57 4.6 Conclusion ... 58
CHAPTER FIVE ... 59
DISCUSSION ... 59
5.1 Introduction ... 59
5.2 The Factors Impeding Cost Recovery with the Ugu District Municipality ... 59
5.2.1 Proposition 1 ... 59
vii
5.2.2 Proposition 2 ... 60
5.2.3 Proposition 3 ... 60
5.2.4 Proposition 4 ... 61
5.2.5 Proposition 5 ... 61
5.2.6 Proposition 6 ... 62
5.2.7 Proposition 7 ... 62
5.3 Conclusion ... 63
CHAPTER SIX ... 64
CONCLUSION AND RECOMMENDATIONS ... 64
6.1 Introduction ... 64
6.2 Summary of Findings ... 64
6.2.1 Ugu District Municipality as Perceived by Registered Consumers ... 64
6.2.2 Tariff Structure and Affordability ... 65
6.2.3 Tax Exemption as an Incentive for Regular Payments ... 65
6.2.4 Lower Tier Monthly Income Respondents are in Need Tax Exemption Incentives . 66 6.3 Recommendations ... 67
6.3.1 Organisational Regeneration ... 67
6.3.2 Increased Consumer Participation in Tariff Structure Reviews ... 68
6.3.3 Increase Capacity to Deal with Defaulters ... 68
6.3.4 Implementation of Tax Exemption as an Incentive ... 68
6.4. Limitations of the Study ... 69
6.5 Areas for Further Research ... 69
REFERENCES ... 71
APPENDIX A: QUESTIONNAIRE ... 77
APPENDIX B GATE KEEPER PERMISSION ... 85
APPENDIX C ETHICAL CLEARANCE ... 86
APPENDIX D TURNITIN REPORT ... 87
viii List of Tables
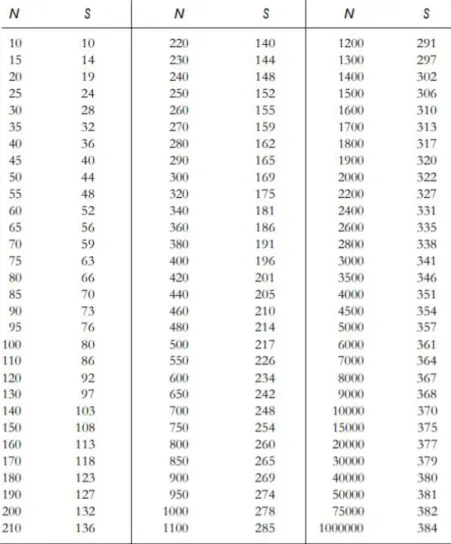
Table 3.1: Table for determining a sample size from a finite population ...31
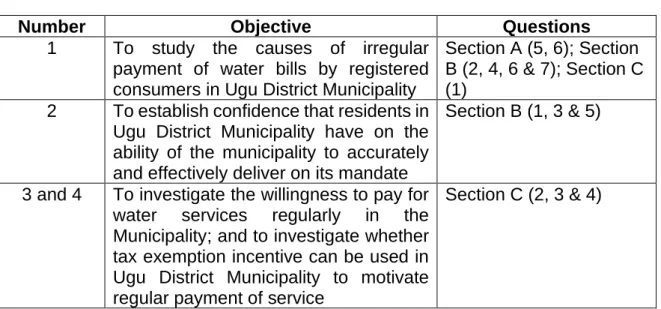
Table 3.2: Linking the survey questions to the objectives ...33
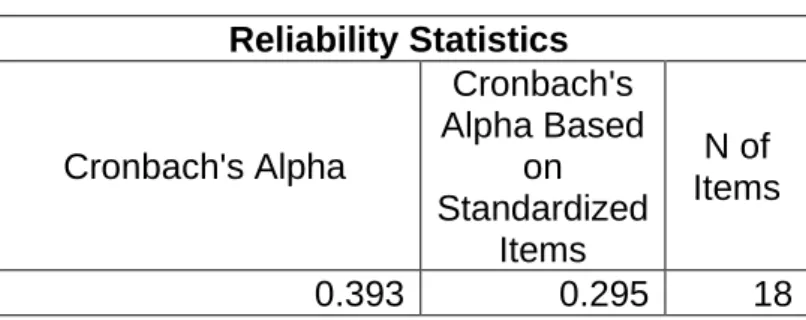
Table 4.1: Reliability Statistics ...40
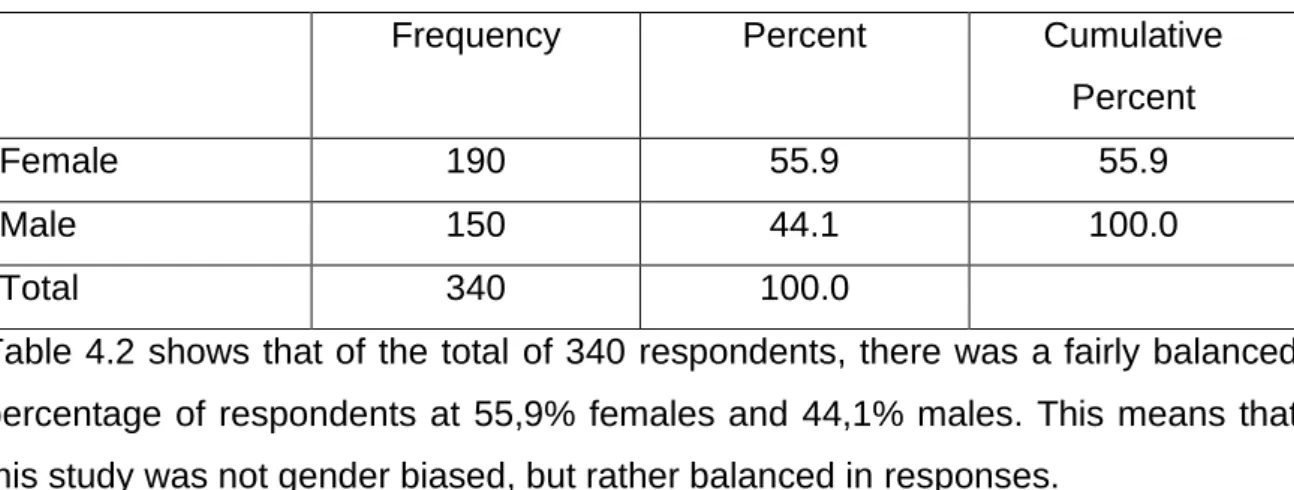
Table 4.2: Gender distribution of respondents ...41
Table 4.3: Age distribution of the respondents ...42
Table 4.4: Location of respondents’ households ...43
Table 4.5: Economic status of the respondents ...44
Table 4.6: Level of monthly income distribution ...45
Table 4.7: Respondents’ perception on sufficiency of resources for accurate billing ...46
Table 4.8: Consumers are billed on actual amounts consumed ...46
Table 4.9: Consumers are billed on estimated volumes ...47
Table 4.10: Estimated volumes match consumer’s average consumption ...48
Table 4.11: Consumers are consulted on tariff structure ...48
Table 4.12: Affordability of tariff structure ...49
Table 4.13: Sufficiency of mechanisms to deal with defaulters ...50
Table 4.14: Existence of incentives for regular payments ...51
Table 4.15: Cross tabulation between monthly income level and tariff affordability 55 Table 4.16: Cross tabulation between consumer’s average consumption and estimated volume billed ...56
Table 4.17: Cross tabulation between introduction of tax exemption against current incentive schemes ...57
ix
List of Figures
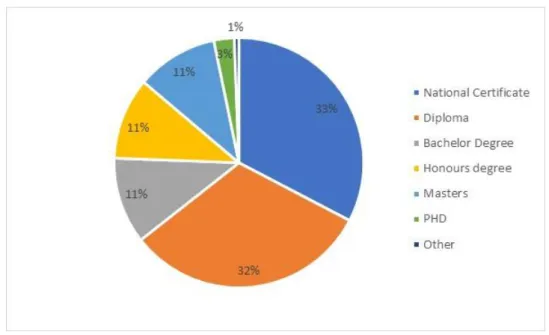
Figure 4.1: Distribution of the level of education of respondents ...42
Figure 4.2: Effect of level of income on ability to pay municipal bills ...52
Figure 4.3: Tax exemption incentive in improving cost-recovery ...52
Figure 4.4: Reduction in tariffs in improving cost-recovery ...53
Figure 4.5: Municipal efforts in improving cost-recovery techniques ...54
1
CHAPTER ONE INTRODUCTION 1 Introduction
This introduction will present the background information to the study, its motivation for the study, problem statement definition, the objectives of the study, limitations and assumptions made. Post 1994, the apartheid legacy presented South Africa with enormous challenges of inequality, poverty, and immense aspirations for greater access to basic public services. To address these challenges, the government enshrined the constitutional rights to service access (World Bank, 2011). By providing ample financial resources, the government developed ambitious delivery targets to overcome the backlog in services. Within the water and sanitation space, usually a municipal responsibility, the deficiency of services is mostly experienced in the former “homeland’’ areas, where municipalities were first established in 2000 (World Bank, 2011). According to this report, the implementation of backlog eradication approach has been state-centric, top-down, target driven, supply-led, generously funded and often fully subsidised.
The Department of Water Affairs and Forestry (DWAF) produced a White Paper in 1994, advocating for the use of user charges in recoveing at least the recurrent costs associated with operations and maintenance (DWAF, 1994). The achievement of this goal would free up scarce budgetary needs for the much-required capital expenditure to ensure systems expansion and thus, extended access to all. A review of literature pertaining to municipal cost recovery indicates that not much attention has been paid to the implementation of mechanisms that are used (Manda, 2013).
According to this study, there has not been a great deal of improvement in municipal cost recovery, despite numerous attempts. The result has been jeopardy to the financial viability of these utilities, curtailing their ability to continue with the much- needed capital expansion programmes at the required rate of growth. The Ugu District Municipality, which supplies water to approximately three quarters of a million people, has been hard hit financially by this scenario.
The challenge of cost recovery has been investigated in several studies and three sets of important factors that have emerged as determinants for successful cost
2
recovery identified (Alence, 2002). These include the technical service infrastructure futures, the institutional and social context, and the billing and payment practices (Alence, 2002). The billing and payment practices comprise of tariff schedules, non- payment penalties and incentives for payments, none of which considered the use of a tax exemption of payment of water services as an incentive. It is with this in mind that this research investigated the affinity of consumers in being willing to pay for water in the event that the money can be recovered back as a tax exemption. A tax exemption basically refers to monetary exemption that provides relief from taxes, reduces the taxable amount or allows for taxation of only certain portions of that amount. The risk of implementation of such an incentive however, is that the need to reduce usage and conserve the scarce water resource may diminish, and result is water wastage.
1.1 Motivation for the Study
Water has become a major worldwide constraint for socio-economic development and its universal access has been included in the millennium development goals (WWAP, 2015). The provision of clean and affordable water to populations has an entity of cost covering initial capital outlay, operation and maintenance and utility management. Proper operation and maintenance are indispensable to ensure that capital investments on new infrastructure result in sustainable service provision (Van Zel, 2014) However, due to reduced government funding as a result of constrained national budgets, low tariff rates and poor cost-recovery strategies from consumers by the water utilities, the ability of these utilities to recover costs, are limited. Cost-recovery should be viewed as an essential component for sustained operations and service delivery.
According to a report by the Financial and Fiscal Commission of the Department of National Treasury, Republic of South Africa (2013), South African municipal consumer debt is a complex challenge that requires multi-faceted solutions to resolve. In this report, an analysis on consumer debt over the period 2004 to 2010 revealed that municipal consumer debt is generally declining and despite this progress however, the debt still remains a challenge due to its sheer size.
3
Cost-recovery through some mechanisms is therefore an essential part for long- term sustainability of the water services infrastructures, operation and maintenance, whether through user-pays principle or through government support. Where recovery and support is absent, the result in infrastructure, skill and services deterioration leading to complete system break downs. The payment of water services should therefore be continuously encouraged and emphasised and this can be achieved through some incentives. One such method would be to provide some form of tax relief to payers.
Income tax is a tax levied on all income and profit received by a taxpayer (SARS).
It is the national government’s main source of income and is imposed by the Income Tax Act (No. 58 of 1962). According to the Tax Laws of South Africa, a tax exemption is a monitory exemption which reduces taxable income. Several personal tax exemption categories in South Africa include exemptions on income for residents working outside the Republic for a period exceeding 183 days a year and exemptions on annuity contributions, just to mention but a few (National Treasury, 2017). The research proposes to add monies paid out for services rendered to individual households by municipalities to be added to this list. The justification will be that municipalities will have a regular cash injection for their daily operations and maintenance, as opposed to relying on segmented transfers from central government, usually done on a quarterly basis. The danger to this would be a reduced income base for the South African Revenue Service (SARS), which is currently on a deficit of 50 billion rand from tax collection target for the fiscal year (National Treasury, 2017). According to the 2017/18 medium term budget, the current deficit has widened to 4,3% of the gross domestic product (GDP) against the 2017 budget target of 3,1% of GDP.
1.2 Focus of the Study
Municipal service delivery capabilities are reducing due to continued dwindling financial resources from government coffers (National Treasury, 2016). To bridge this gap, new financing models need to be investigated to improve cost recovery for
4
services rendered. The rationale behind cost recovery is that consumers must pay the partial, if not full cost, of service rendered, with the intention of revenue generation for service upgrades, maintenance and expansion. Certain identifiable factors can therefore affect the appetite for payment of services, such as degree of service delivery perception by the consumer, prevailing free basic water policies, consumer income and the institution’s ability to deal with defaulters, among others.
In agreement to this statement, human behaviours have shown that a sense of ownership provides a more sustainable mode of supporting a cause, in this case, paying for water services rendered (DWAF, 2004).
The purpose of this study is to identify some the reasons impeding regular payment of municipal bills for service rendered (water supply) and to access the reaction towards the introduction of tax exemption on amounts paid, as an incentive that can improve regular payments.
1.3 Problem Statement
The sustainable supply of water, a scarce resource, is becoming more and more challenging as financial resources dwindle. The use of policies that advocate for free supply are not sustainable in the long-run, while new models of ensuring continuous financing of operations need to be investigated. The user-pays principle is purported to be the most sustainable, as it encourages the notion and sense of personal ownership to the resource, by directing public resources to the people who will most benefit (Montreal Economic Institute, 2003). However, the lack of payment for water services has become the norm in South Africa, especially within the lower income households. The Ugu District Municipality, as a water service provider, has been undergoing financial difficulties as a result of the high rates of regular non-payment of water accounts by registered consumers. To compound to this, perceived in- action from the utility against defaulters has encouraged cases of illegal connections into their system (water theft). It is the intention of this study to gauge whether incentives through tax exemption, can reverse these trends.
The problem statement can therefore be stated that “If water supplied is not paid
5
for, a water utility will find it increasingly difficult to sustain maintenance and operational activities, leading to the gradual deterioration of services and subsequent collapse of the system.” In view of that, the study aims to fulfil the following objectives by investigating whether the use of some form of tax exemption against amounts paid can be an incentive for regular payment by registered consumers.
1.4 Objectives of the Study The objectives of the study were:
1) To study the causes of irregular payment of water bills by registered consumers in Ugu District Municipality;
2) To establish confidence that residents in Ugu District Municipality have on the ability of the municipality to accurately and effectively deliver on its mandate;
3) To investigate the willingness to pay for water services regularly in the Municipality; and
4) To investigate whether tax exemption incentive can be used in Ugu District Municipality to motivate regular payment of service.
1.5 Research Question
The research questions to be answered by the study were:
• What are the causes of irregular payment of water bills by registered consumers in Ugu District Municipality?
• Do the residents of the Ugu District Municipality have confidence on the ability of the municipality to accurately and effectively deliver on its mandate?
• Are consumers willing to pay for water services regularly in the Municipality?
• Would the introduction of a tax exemption as an incentive be used in Ugu District Municipality to motivate regular payment of service?
6 1.6 Methodology
The research employed the quantitative approach to answer the research questions and the study was based within the Ugu District Municipality, in KwaZulu-Natal, by considering registered consumers as the framework of the research. The focus of the research was to gauge the effect of proposed tax exemptions as an incentive for payment for water services provided. The research method was conducted on a target population frame of forty thousand odd registered consumers. A total of 381 respondents were targeted with a 95% confidence level reflecting a significance level of 0.05. A random sampling method was used for data collection, by launching an online questionnaire research instrument. Pre-testing of the questionnaire and revisions were carried out before the actual roll-out online. Data were analysed through the SPSS 25.0 version programme.
1.7 Limitations of the study
Limitations of a study refers to aspects of the methodology that influences the interpretation of the results (McCusker et al., 2015). The following were identified as limitations to this study;
a. The use of a questionnaire as a tool of collecting data comes with its own limitations such as the respondent not being entirely truthful due to social image etc.
b. The administration of a questionnaire would require one to travel to the different corners of the district in order to gather representative data from a sample population. This however would require extensive travel costs. This was resolved by use of an on-line method of administration of the questionnaire.
c. By use of on-line data gathering technique there were limitations as to the category of respondents who could be accessed as it requires a respondent to have adequate resources of their own to complete it. It is common for one to utilise data on issues that directly benefit them.
d. It was impossible to know whether the respondents were registered account holders with the municipality or not since the questionnaire was distributed online via google forms
7 1.8 Structure of the Dissertation
This dissertation is divided into six chapters as briefly outlined.
Chapter One: Introduction
This chapter introduces the study. It explores the background for municipal consumer debt and cost recovery, reasons for choosing the area of study and in addition, outlines the objectives, research questions and a summary of the methodology.
Chapter Two: Literature Review
This chapter establishes the legislative and conceptual framework upon which cost recovery is based. It reviews the literature on what constitutes cost recovery, mechanisms for cost recovery and the rationale behind cost recovery.
Chapter Three: Research Methodology
This chapter explores the research design, defines the study area and establishes the population and sample size. It then defines the sampling and data analysis methods, while also accessing the reliability and validity of the data. It concludes by looking at the bias of the data and the ethical considerations.
Chapter Four: Research Analysis, Presentation and Interpretation
This chapter presents the analysis of the study and interprets the relationships between variables. The main purpose of this chapter is to analyze the data collected in order to come up with real facts to answer the research questions as outlined in chapter one.
Chapter Five: Discussion
In this chapter, the findings of the analysis are examined against the objectives of the study, as well as against the review of the literature.
Chapter Six: Conclusions and Recommendations
This chapter provides the general conclusions of the study by deducing on the discussion presented in chapter five. It also gives recommendations for future studies, moving forward.
8 1.9 Conclusion
With most municipalities experiencing difficulties in the collection of user payments, especially from the lower income status of the population, who conversely are also the main consumers of basic water services, in addition to reduced government support due to constraint budgets, the ability of these entities to continue operating sustainably is greatly compromised. Cost-recovery through some mechanisms is therefore an essential part for the long-term sustainability of the water services infrastructures, operation and maintenance.
It is with this in mind that this research proposes to investigate the affinity of consumers in being willing to pay for water in the event that the money can be recovered back as a tax exemption. The study will be based within the Ugu District Municipality, which is a Water Service Provider.
9
CHAPTER TWO LITERATURE REVIEW
2.1 Introduction
This chapter establishes the legislative, conceptual and framework upon which cost recovery is based. It reviews literature on what constitutes cost recovery, as well as the mechanisms for cost recovery and the rationale behind cost recovery. It identifies reasons for reduced funding from central government, categorises municipalities, analyses water sector subsidy as well as factors that influence cost recovery. The purpose is to evaluate what the different strategies that can be employed may be affected through different constraining factors.
2.2 Legislative Framework
The history of South Africa is laced with inequitable distribution of water supply services that was skewed through policies that were historically discriminatory on a racial basis. Democracy’s advent not only gave all South Africans the right to public affairs participation, but also entrenched constitutional rights to access to basic social and economic services. The main vehicle for driving these changes was the Reconstruction and Development Programme (RDP) whose aim, amongst other things, was to ensure the provision of a clean and safe water supply within a 200- meter radius of every household. The RDP document did recognise the limitations of its implementation due to financial constraints (Marah et al., 2003), noting its ability to redirect government expenditure, rather than increasing its Gross Domestic Product (GDP) proportion.
The then Department of Water Affairs and Forestry (DWAF) paid attention to financial dimensions associated with basic water supply expansions (Marah et al, 2003). The government faced the challenge of reconciling competing pressures in an effort to extend basic services to all South African residents. Drawing from international and conventional thinking, the then DWAF’s approach was to recover the recurrent operational and maintenance costs through user charges, freeing up its resources for infrastructure expansions. Allowance was made for indigent
10
populations through the implementation of subsidised low tariffs to enable affordability of basic services (Marah et al, 2003). This responsibility was however transferred to municipal governments, which could choose to fund them through Treasury’s equitable share grants (guided by the population of residents below the national poverty line) or through cross-subsidising via increased tariff structures for large consumers (Marah et al, 2003).
2.3 Effects of Fiscal Decentralisation
Fiscal decentralisation is normally emphasised by the devolutions of responsibilities on expenditure and revenue collection from a higher level to a lower level of government. The aim of this fiscal decentralisation is normally to improve governance, accountability, to increase responsiveness to citizen concerns and to ensure a higher level of service delivery, as localised governments would tailor make their goods and services to meet the needs of their individual constituents (Yemek, 2005).
The basic government policy therefore was that services should be self – financing at a local level. Sooner than later, the difficulties in cost recovery through user payments emerged as a major threat to operations and maintenance. According to Marah et al., (2003), there were several explanations to this predicament. Firstly, water services had been historically freely provided in many areas, especially in the rural districts. Secondly, South Africa’s apartheid history had cultivated a culture of non-payment in opposition to the political system then. In addition, the administration for billing and revenue collection systems were weakened by institutional and administrative lack of capacity.
The results of fiscal decentralisation have not been all too positive, there has been recent growing service delivery dissatisfaction, leading to constant protests against the lack of adequate service delivery (Nara, 2014). Far too common, most municipalities experienced both service delivery and backlog challenges, as well as poor financial management. Other than these challenges, most are plagued by poor financial management, corruption and poor capacity due to scarce skills availability
11
(Nara, 2014). This has resulted in a loss of confidence by the local communities in these municipalities. Financial distress is therefore a major factor in crippling a municipality against its mandate to the population. It is therefore imperative that municipalities develop policies that are conducive for sustaining cash flows.
As much as there is recognition of the fact that governance is a key element in development strategies, an important aspect that must be remembered is that governance without finance can be challenging (Brian et al., 2009). While institutional advantages of local government allow them the ability to know local conditions better than national government, the full realisation of the promise of effective service delivery and backlog eradication lies squarely on strong fiscal positions of the municipalities, so that operations and policies are fiscally sustainable. Factors identified as relevant to increased fiscal health of local government include, but are not limited to the following (Brian et al., 2009);
a) The estimation of revenue should be as accurate as possible, in order to limit the deficit or surplus gaps
b) Fiscal discipline – this has been noted in successful municipalities within the country
c) Fiscal discipline is best supported by rules, greater control and oversight by central government, and by strong own revenue capacity and efficient administration of this revenue.
It is therefore imperative for local governments to have policies and means of revenue collection that is sustainable. Citizen buy-in is key to regular payment of municipal accounts.
2.4 Municipal Financing Model
With respect to the assignment of revenues, local governments are constitutionally granted their own revenue sources in order for decentralised functions to be readily carried out (Nara, 2014). The two main revenue sources are property rates and surcharges on services provided (water, waste water, solid waste and electricity managements). Overall, South African municipalities are largely self-financing through revenues raised through the above sources (Nara, 2014). A municipality that is unable to effectively implement cost recovery will fall into the unsustainability
12
trap. Additionally, the constitution guarantees the distribution of fiscal equitable share of national revenue to all municipalities, the formula of distribution, of which is determined annually by the Division Revenue Bill (Nara, 2014).
2.5 Municipalities as Water Service Providers
Metro Areas
The metropolitan within South Africa are generally populated by economically strong urban areas enabling them the capacity to cross subsidise poorer consumers. In addition, they also possess strong and well skilled administrative water supply departments (DWS, 2015). The existence of ‘rural periphery’ within the boundaries of these metros, the financial and skills capacity inherent easily deal with these.
District Municipalities
Most district municipalities that are Water Service Authorities (WSA), also chose to undertake the task of being a Water Service Provider (WPS). It is however typical that the district municipality contracts out the WSP activities to external providers such as local municipalities (especially positioned for urban water systems), water boards (well positioned for bulk water conveyance), private sector operators and community based organisations, who are more efficient in running small rudimentary schemes (DWAF, 2002).
Local Municipalities
Wherever the local municipality is the WSP, the same choices as those of the district municipalities also exist. However, the retention of the WSP functions are more preferred (DWAF, 2002). In most cases, the outside contracts will only cover the bulk conveyance side of the supply system, mostly contracted to the water boards and district municipalities.
13
2.6 Water Sector Subsidy: Cause, Effect and Remedial Measures
Since many governments have been the main drivers of universal access to water and sanitation, tariffs have been kept low in order to service the entire population spectrum. The result has been increased benefits to individual and public health. In order to maintain low tariffs, subsidies have been provided to the WSPs, rather than to the consumers themselves (Foster et al, 2000), leading to unsatisfactory results.
The continued use of this mechanism is ineffective within areas of ineffective infrastructure (Burger, 2014). The fact that water is under-priced (due to subsidy) has tendered to only benefit the consumers with existing connections, whilst resulting in the detriment of those without, in addition to increase in inefficiency within the WSPs (DWAF, 2002). The large implicit subsidies have resulted in unsustainable water supply systems that are unable to roll out expansion programmes to the unconnected consumers.
Due to these concerns, there has been a diversion away from subsidised water supply systems and a concerted drive, both internationally and locally towards full cost recovery of water services. This has subsequently led to increased billing to households, increasing the household financial burden (Gomëz-Lobo & Contreras, 2000). This growing burden has resulted in the need for targeted subsidies that better guarantees poor households access to water. The main advantages of household targeted subsidies are that they are transparent and explicit, minimising distortions in the behaviour of both the service provider and the customer (DWAF, 2001). They also minimise the access to subsidy by the wealthier sectors of society.
The high administrative costs are the main draw backs in designing a targeted household subsidy.
2.7 Free Basic Water Policy: A Critique
The provision of free basic water (FBW) policy was announced in the year 2000 by the government, instructing water service providers to allow access to 6000 litres per household per month, of free portable water (Karen et al., 2005). The operating costs were to be recovered through rising block tariffs, with the higher consumers subsidising the basic consumers. Although this policy guarantees access to water,
14
the reality is that it is limited severely in ensuring access to low-income households.
As cited by Karen et al., (2005), the suggestion that while the allocation of the first 6000 litres is free, a sharp rise in tariffs thereafter often leads to low-income households paying more than what they used to pay before the free basic water policy introduction. The process of its implementation also differs from one municipality to another and as such, due to varying income and service level profiles, some municipalities find it easy, while others face severe constraints, in implementing the policy.
The only way that FBW can fully benefit the poor households is if there is sustained investment in expansion of water infrastructure (Burger et al., 2014) and this will require some form of cost recovery.
2.8 Cost-Recovery Rationale
Cost recovery is the act of charging out the full or near full costs of providing a good or a service to a customer (Boyle, 2012). The concept is based on a service provider being able to recover partial, if not all, of the costs associated with the provision of a good or service. For water supply services providing utilities that are publicly owned, the application may or may not include a surplus, over and above the basic production cost. Conversely within the private sector, a surplus, also referred to as profit, is included in the cost recovery strategy. In either case, the ability to recoup the full cost of production is vital to sustained operations of the entity (Boyle 2015).
There are two components associated with a water supply system; the initial capital costs of infrastructure lay-out, also referred to as the fixed costs, and the operational and maintenance costs, also referred to as the variable costs. The fixed costs with the South African water supply sector are generally sourced either from financial institutions or government grants (National Treasury, 2017). The variable costs, which include salaries, wages, administrative, operational and maintenance costs, are usually sourced through government equitable share distribution (National Treasury, 2017) and user-pays principle (Boyle 2012).
15
The World Health Organisation (1990) indicated that in many developing countries, cost-recovery and sustainability were largely ignored for lengthy periods of time. As a result, in addition to inadequate government subsidy, unrealistic tariffs were set to make up for the variable costs of utilities, leading to infrastructure deterioration and decline in services rendered.
The emphasis of water as a human right is embodied within the Republic of South Africa’s Constitution (Mubangizi, 2004). The White Paper on Water Supply and Sanitation focused on community water supply and backlog eradication (Karen et al., 2005). It also introduced the subject of cost recovery in the water legislature, for the purpose of equitable provision of water services through payment of operational and maintenance costs by the consumers of the services. It argued that without these funds, there would be a drastic reduction in available finance for further development and roll-out of basic services. The need to improve the expansion of drinking water services in sub-Saharan countries is critically dependent on the availability of financial resources. Conversely, the cost recovery rates of most water supply utilities are low, while the demand for service delivery keeps increasing (Tarfasa, 2012).
Balancing of the books is the most important cost-recovery reason. Within the local government spheres, cost recovery can be argued that it is a good public fiscal practice that allows the central government to reduce the tax burden on the population due to the lower tier being self-sustaining. It can also be argued that cost recovery leads to sustained long-term service delivery as the state will have funds to enable its investments in the expansion infrastructure to cater for future demands.
Without expansions, the poor would easily be left out of the service delivery equation (Marah et al., 2003).
2.9 Municipal Cost Recovery Models
There are several models used by water supply utilities around the world and within South Africa, in recouping investment, operational and maintenance costs from
16
consumers. The most prevalent of them is the use of conventional water meters, pre-paid water meters and the other the use of block tariff structure (Heymans et al., 2014). However, since the democratic dispensation in South Africa in 1994, there has been rampant wide-spread of non-payment of services charged for by local governments, mainly in the low-income sectors of the population, spread over townships to rural and semi-rural areas (Antina, 2008). The two models utilised within the Ugu District Municipality are the use of increasing block tariff and the use of prepaid water meters.
The efficient provision of water supply was traditionally achieved by the use of setting up volumetric rates equal to the marginal cost of supply (Hugh et al, 2013).
There has been a significant departure towards Increasing Block Tariff, where higher rates are charged as consumers reach progress thresholds. Two arguments for the proponents of increasing block tariff usage is that firstly, it is assumed to provide the first tier of consumption to all consumers at lower costs, thus the fairness argument. It is the excessive users who are faced with higher payment rates. On the other hand, in developing countries’ context, as cited by Hugh et al. (2013), increasing block tariffs allows utilities to cheaply supply water to the middle- and upper-income groups, while appearing to serve the poor through the provision of a single connection. This payment model has not been successful in ensuring regular repayments by consumers within Ugu District Municipality.
Following the failure of a campaign to encourage payment of services during the post-apartheid era, most water utilities have resulted in the use of pre-paid water meters, which ‘self-disconnect’ households in the event of non-payment (Antina, 2008). This has however resulted in protests, with the pre-paid meter being the bone of contention, let alone the rate of payment, ripping them from the ground and causing further losses to the municipalities (Antina 2008). The model has therefore not been economically viable in many municipalities.
2.10 Water Supply Cost Recovery Mechanism Infrastructure
There are several infrastructure mechanisms that are largely employed to facilitate cost recovery in South Africa. These include the following;
17 2.10.1 Conventional Metering Systems
This is the most commonly used infrastructure for cost recovery. It is normally classified as per consumer profile, namely:
▪ residential, which covers households in general;
▪ institutional, which covers government properties, schools, hospitals and other public amenities;
▪ Commercial, which covers small to medium size business premises; and
▪ industrial, which caters for large businesses.
Each meter is linked to an account and volumes past the meter are regularly calculated through meter readings. Bills are then generated and distributed to the account holders. The challenges to this method is that due to the large number of connections that may prevail within a system, it is impractical for the utility to read all meters regularly, say monthly. It is commonly accepted that each meter can be read quarterly (at least once in three months), while billing for the other months not read are estimated. This leads to a perception among account holders that they are being over-billed, causing reduced payment rates due to disputes. In certain instances, consumers are allowed to call in their meter readings in order to increase on accuracy of volumes billed. Other possible sources of error with this method other than estimates are that a wrong meter can be allocated to a wrong account, or a meter change-out being undertaken without updating the information in the billing system (Gezani, 2013). In this method, the account holder has the onus to facilitate the payment of the bill. This method has a distinct advantage in that most meters are mechanical in nature, thus, they are easy to maintain and are rigid. There exist electronic ones as well, which are mostly used by large volume consumers to improve on accuracy.
When implemented correctly, billing systems through conventional metering can improve revenue collection, and especially so through the implementation of a cost- effective and reliable metering infrastructure. This can be most effective when all consumers are connected and metered with robust working meters, resistant to
18
tampering and easy damage to the register. The billed invoices should also be purely based on metered consumption (Gezani, 2013).
2.10.2 Prepaid Systems
This is a system where a consumer buys unit in advance, whether water or electricity. The cost is recovered in advance of service rendered, over and above the free basic allocation. The meter is set to discharge amounts to prescribed units.
In the case of water however, it is normally set to allow for the mandatory free basic water volume to be discharged before credit is utilised. The system relies on good recharge structures in place for ease of access for the consumers, as credits may run out at any time of the day or night. Within the water sector, the meters are however not very popular since they involve some level of electronics that have a tendency of software failures and high rate of functionality problems. They also have an added cost of the administration of pre-paid service vendors (Gezani, 2013).
When implemented correctly however, it can be a powerful cost recovery mechanism. The City of Johannesburg has elected to resolve the challenges of conventional meter-based billing by installing thousands of pre-paid meters through the launch of Gcin’amanzi project (Gezani, 2013). The aim is not only to improve cost-recovery, but also to reduce water losses, post the consumer meter stage. It is assumed that pre-paid water will be treated more valuably by consumers, thus the need to resolve leaks that occur on the consumer side of the meter.
2.10.3 District Metering
This is the practice of allocating a bulk meter into a community, for the purpose of billing the relevant custodian – be it a government department, community committee etc. Water is distributed to different sections of a habitats/ villages and metered at the zone entry point. It ignores the consumption of individual households and consumption trends. The advantage is that losses within the reticulation downstream of the meter are also paid for, thus the onus is with the custodian of the
19
zone to limit leaks. Operational control is mostly community controlled and thus requires minimum investment.
2.10.4 Flat Rate
The application of a flat rate entails the imposition of rate that is paid in by every household on a regular basis. The system is mostly applicable in communities where the initial infrastructure investment was community driven and the subsequent running of the scheme is also community driven. The monies paid in are mostly for operational and maintenance purposes, administered by a selected committee. In some cases, however, the municipalities remain responsible for the daily operations and maintenance of the system.
2.11 Factors Affecting Cost Recovery
The rationale behind cost recovery is that consumers must pay the partial, if not full cost, of service rendered, with the intention of revenue generation for service upgrades, maintenance and expansion. Certain identifiable factors can therefore affect the appetite for payment of services.
2.11.1 Service Delivery Perception
The theory of consumer demand assumes that consumers derive satisfaction, not from the consumption of the good per se, but from the characteristics that surround the good (Tarfasa, 2012). The manner in which consumers perceive the manner in which a service is supplied dictates their appetite to meet their own obligations to pay. If the perception is positive, then consumers are more willing to pay, and vice versa.
2.11.2 Free Basic Water Policy
Although the implementation of free basic water is a commitment to ensure access to potable water, especially for low-income households, within the cost-recovery framework, it has become nothing but a stumbling block. In an analysis conducted by DWAF, a non-payment culture arose due to the belief that people have become
20
used to receiving free services in the post-apartheid era (Karen et al., 2005). There is a belief of entitlement, thus perpetuating the belief.
2.11.3 Consumer Income
As argued by Karen et al., (2005), household water arrears and debts reflect the inability of a household to afford the service. The theory suggests that limited household income results in non-payments, since they do not have the capacity to support increased financial burdens. For low-income households, the payment for services absorbs a significant and disproportionate amount of its income, thus concluding that the inability to pay is the primary cause of non-payments. If taken further, within the context of cost recovery implementation from water bills, most low-income households will survive on the free basic water allocation.
2.11.4 Dealing with Defaulters
As reported by Karen et al (2005), the Minister for the Department of Water and Forestry in 2003 decried that restriction of flow, rather than complete cut-off, is the limit that municipalities can do in order to deal with defaulters, with regards to paying for water services. This decree ensures restricted flow to the free basic water level that a municipality provides. Some consumers are able to adjust their draw-offs and usage to this restricted flow, thus, negating the need for them to update their accounts leading to revenue loss to the utility.
2.11.5 Illegal Connections
Illegal connections are a major source of revenue loss to utilities. These connections are usually neither authorised nor captured in the billing system, thus, no bills can be generated (Gupta, 2008). Poor enforcement of by-laws to deal with unauthorised connections has only but led to an increase in incidences occurring.
2.12 Impact of Incentives on Consumer Behaviour
In an increasing financially challenging world, keeping consumers engaged and responsive is becoming more and more difficult. Rewards and incentives are
21
constantly being included in marketing programmes, in order to stand them out from the rest. Gaining consumer loyalty and attention for cost recovery through payment has become paramount for sustainability.
A financial incentive is basically a monetary transfer of either kind or cash directed to an individual for purposes of inducing behavioural changes and even compliance.
Financial incentives in particular, are the most commonly studied and implemented methods in enhancing adherence (Ciapponi et al, 2011) rooted in behavioural theories based on the benefits of rewarding good behaviour. Ideally, such incentives should motivate positive behaviour, based on understanding the underlying problem and the mechanisms for influencing change. affective commitment and loyalty programs that provide economic incentives positively affect both customer retention (Verhoef, 2003).
Customer Satisfaction can be defined as the emotional state of mind that results from a customer’s interaction with a service provider over a period of time, and that a good level of satisfaction has a positive impact on customer loyalty (Verfoef, 2003). It is therefore important that service providers like municipalities to strive to improve on customer satisfaction by using incentive that have a direct financial impact on to consumers as it positively affects customer retention, which may result in increased compliance.
According to a white paper written by Virtual Incentives (2016) on the impact of incentives on consumer behaviour, the right incentives can enhance consumers to brand, product or service loyalty, by making them feel valuable. The study concluded that personalised rewards and incentives create an emotional connection between the product and the consumer.
2.13 Tax and Tax Exemption: Definition
Income tax is a tax levied on all income and profit received by a taxpayer (SARS).
It is the national governments main source of income and is imposed by the Income Tax Act (No. 58 of 1962).
22
Tax exemptions are set out in Sections 10, 10A, 10B, 10C and 12P of the Income Tax Act (Haurpt, 2015). There are two categories of tax exemptions:
• Income which is either totally or partially exempt from tax, for example South African dividends, South African interests earned by non-residents, or foreign pensions for total exempts, and interests earned by natural persons which is exempt up to certain limits.
• Entities which can either be totally or partially exempt from paying tax.
Pension provident funds, municipalities and government entities are totally exempt from paying tax, while certain entities such as public benefit organisations, sectional title body corporates, share block companies and recreational clubs, are partially exempt from paying tax.
2.14 Current South African Personal Tax Exemption Categories
The term tax exempt means free from taxation. It is a taxable expenditure, income or investment from which no tax is levied in order to serve a specific purpose for the encouragement of a certain activity. According to the South African Revenue Service (SARS), tax exemptions can apply to a portion of an individuals’ income unless an individual has been outside of the republic for a period exceeding 183 days in a year, where income becomes fully exempt (National Treasury, 2017).
Some current personal tax exemptions are discussed herewith.
2.14.1 Retirement Savings and Medical Aid Contributions
Tax is a certain and cannot be avoided. However, once individuals make retirement savings contributions, they are exempt from tax on these amounts, to some prescribed limits. Nevertheless, on drawing the savings upon retirement, income tax is imposed. Provident funds and retirement annuities are the main retirement vehicles. The main difference being that provident funds are employer driven packages whilst retirement annuities are individual driven, that can be accessed by self-employed individuals.
23
On the other hand, medical expenses have a rebate called Medical Scheme Fees Tax (MTC), that reduces an individual’s normal tax. The MTC effectively replaced part of the tax deduction that was specifically allowed for medical scheme contributions, and applies to fees paid by a taxpayer to a registered medical scheme (or similar registered scheme outside South Africa) for that taxpayer and his or her
"dependants" (as defined in the Medical Schemes Act).
2.14.2 Foreign Employment Income Exemption
Prior to 2001, the application of a source-based taxation system allowed all income sourced within the republic were taxable in the republic (National Treasury, 2017).
This meant that income sourced out of South Africa or deemed not South African was subject to tax in South Africa. However, since March 2001, South Africa moved to a residence-based tax system, whereby South African residents are taxed on their worldwide income. Nevertheless, Section 10 of the Tax Act exempts the taxation of South African residents who, for purposes of rendering services for or on behalf of their employers outside of the republic, in aggregate, exceeding 183 days in a full calendar year during any period of 12 months commencing or ending in an assessment year. In addition, the service rendered outside the republic should have a continuous period of at least 60 full days.
2.14.3 Employer Provided Bursaries to Learners with Disabilities Tax Exemption
The current Act allows for tax exemption for all bursaries and scholarships by employers to employees or qualifying relatives, subject to certain limits and requirements (National Treasury, 2017). This exemption will apply only if the remuneration of the employee does not exceed R400 000 during the assessment year. The limit amounts of the bursary or scholarship exempted is R15 000 for studies of Grade 12 and under and R40 000 for NDF levels 5 to 10 qualifications.
24
2.14.4 Transfer of Retirement Fund Benefits on Reaching Normal Retirement Date Exemption
Since 2014, the Act allowed individuals freedom to retire to determine the date at which the lump sum benefit accrues. By postponing ‘retirement’, members of retirement funds were allowed to keep their benefits within their funds past the normal retirement age (National Treasury, 2017). From a policy point of view, it is favorable that a benefit be preserved for as long as possible, as long as the member is able to continue to work.
2.15 Advantages of Tax Exemption
As cited by Van Wyk (2010), the introduction of tax incentives into the Income Tax Act 58 of 1962, are now contained in section 37C. Although it might be argued that tax exemptions might have an effect on the tax revenue of the national fiscus, the opportunity it might present to incentivize compliance cannot be ignored. While investigating the National Treasury’s potential loss to revenue due to tax incentives governing biodiversity conservation among land owners in the Western Cape in the 2009/2009 financial year, Van Wyk (2010) concluded that only a small percentage of the tax revenue was foregone. However, from this study, only a third of land owners indicated that tax incentives would encourage them to commit more land to conservation. Policy makers have long been interested in whether tax policies can be used to encourage entrepreneurial activity, and in a study by Gurley-Calvez et al., (2013) resulted in a finding that cuts in relative tax rates faced by entrepreneurs, either in the form of higher rates for wage workers or lower rates for entrepreneurs, increases entry thus growing business base.
2.16 Conclusion
This chapter established the legislative and conceptual and framework upon which cost recovery is based. It reviews literature on what constitutes cost recovery, mechanisms for cost recovery and the rationale behind cost recovery. It has discussed the need for municipal fiscal support from central government, as well as the need for self-cost recovery. The chapter highlighted the different cost recovery
25
techniques that have been utilised by municipalities, and proposed the use of additional incentive of tax exemption to improve regular payment by consumers.
26
CHAPTER THREE
RESEARCH METHODOLOGY
3.1 Introduction
This study employed the quantitative research method. The chapter describes the methods used to gather the research data and the analysis methods employed. A preliminary desktop research enabled the development of the research questions.
In this regard, the chapter explains the research methodology and the rationale behind it. The research design, which includes strategy, area, target population, sample space and data collection tools, are explained. Lastly, the validity of the data, limitations and ethical considerations, are also considered.
3.2 Research Design
A research design is the type of inquiry utilised to provide direction for procedures to be followed. According to Creswell (2014), research design can either be qualitative, quantitative or be of a mixed method. Qualitative research is characterized by its aims, which relate to understanding some aspect of the subject, through the generation of words rather than numbers, as analysis data (McCusker et al., 2015). On the other hand, quantitative methods aim at the measure of something, such as percentages (McCusker et al., 2015). While qualitative methods aim to answer questions about the ‘what’, ‘how’ and ‘why’, the qualitative methods try to answer the ‘how many’ and ‘how much’ of a phenomenon. Mixed methods research is an approach that combines quantitative and qualitative research methods in the same research inquiry. Such work can help develop rich insights into various phenomena of interest that cannot be fully understood using only a quantitative or a qualitative method (Venkatesh et al., 2013).
Due to time and financial considerations, many researchers within the socio- economic environment prefer to utilise quantitative research over other methods.
(McCusker et al., 2015). This is particularly so because accessing and quantifying information and data is simpler compared to qualitative research methods, reason
27
being the latter method wold require the researchers considerable time and effort on the field while covering and relatively small sample of participants.
The instrument to be used was quantitative in nature. The aim was to establish what new incentive methods can be used for consumers to take ownership of their bills and pay them up. Factors that affect cost recovery were investigated and new ones proposed. Municipal debt recovery mechanisms were analysed and measured against the actual recovery and the perception regarding penalisation established.
The provisions of the Tax Act were taken into consideration and estimated loss of revenue collection due to new exemption based on water supply payments evaluated.
3.3 Research Strategy
Research strategy is defined as the general plan of how the researcher will go about answering the research questions (Wadewatta et al., 2011). It provides the research’s overall direction, including the processes by which the research will be conducted. Different research strategies that are generally used in business management studies include experiments, surveys, case studies, action research, grounded theory, longitudinal studies, ethnography, participatory enquiry and cross- sectional studies (Wadewatta et al, 2011).
From the various strategies, this research sought to adopt the case study research strategy, which involves an up-close and in-depth detailed examination of a subject, as well as the related contextual conditions.
3.4 Study Area
In the process of conducting a research, the geographical location of the study is an important aspect that dictates the context of the participants’ behaviour (Waruingi, 2010). It dictates that populations behave similarly if they reside in a similar context, and behave differently if they reside in a different context. This study was therefore restricted to the Ugu District Municipality.