PLAGIARISM
CHAPTER 1: INTRODUCTION
- Research rationale
- Justification
- Aims
- Objectives
- Summary Table
- Outline of dissertation structure
In addition to the experimental and numerical model, an analytical evaluation of current geosynthetic design methods used in practice was also performed. Once the validity of the numerical model was established, a parametric investigation of the key design parameters that determine the behavior of the fill bed was performed. The purpose of the research was to investigate the use of finite element analysis as a means of predicting the behavior of a reinforced soil fill layer undermined by a subgrade void.
The research will provide an improved understanding of the behavior of the reinforced infill layer when undermined by a substrate void. The literature review also included a theoretical assessment of current analytical design methods used in practice.
CHAPTER 2: LITERATURE REVIEW
- Introduction
- The formation of sub grade voids
- Numerical methods
- Finite element analysis process
- Limitations of the finite element analysis method
- Soil Properties
- Coefficient of earth pressure
- Young’s Modulus
- Mohr-Coulomb failure criterion
- Angle of internal friction
- Density of soil
- Soil arching
- Soil dilation
- Current reinforcement techniques
- Cement stabilisation
- Geosynthetics
- General principles
- Use of geosynthetics as reinforcement
- Geosynthetic characteristics
- Basal reinforcement
- Geosynthetic applications
- Modelling of geosynthetic reinforcement
- Previous experimental models
- Conclusions of experimental models
- Current design procedures
- SANS 207/BS8006:1995
- RAFAEL design method
- Girouds layer thickness analysis
- Multi-layer method
- Case Studies
- Case Study: Geosynthetic reinforced railway embankments: Design concepts and
- Case Study: The use of geosynthetics as reinforcement in formation layers (Kae,
- Case Study: FEM analysis and dimensioning of a sinkhole overbridging system
- Case Study: Stability charts for predicting sinkholes in weakly cemented sand
- Case study: Potts (2007)
Inclusion of geosynthetic reinforcement in the soil mass increases the bearing capacity of the fill layer. Increase the interlocking between the soil and the reinforcement to increase the shear resistance of the soil. In the experimental model, only part of the sand collapsed into the cavity due to the cohesion of the soil.
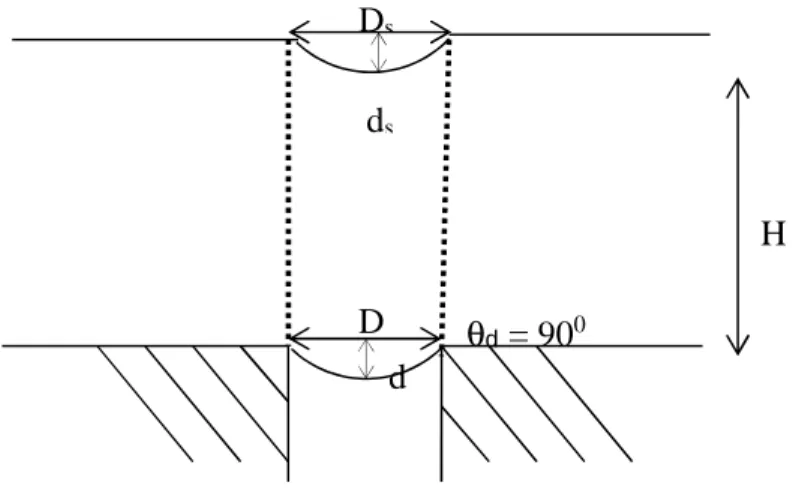
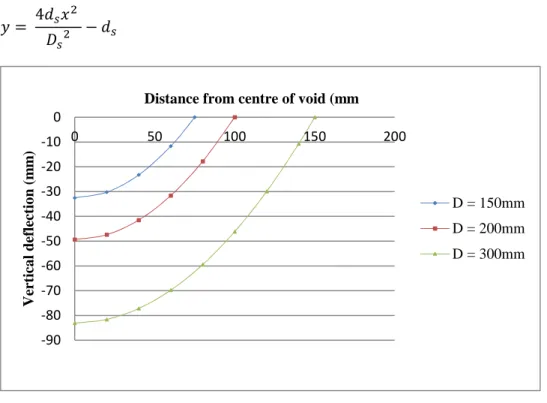
The shape of the geosynthetic is assumed to be parabolic, as in SANS 207. This is an adaptation of the tension membrane theory (the loading force was assumed to be perpendicular to the geotextile, the geotextile deforms in a circular arc). Sufficient cover distance was required in the geotextile so that the tensile strength of the soil could be calculated.
The load in the model was solely due to gravity and the self-weight of the soil.
CHAPTER 3: PREVIOUS STUDIES
- Rationale
- Experimental model: de Lange (2016)
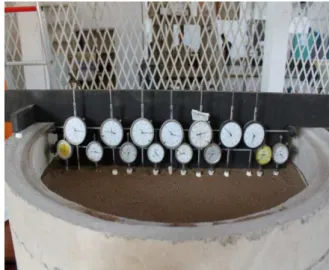
- Experimental model setup
- Unreinforced Model
- Reinforced model
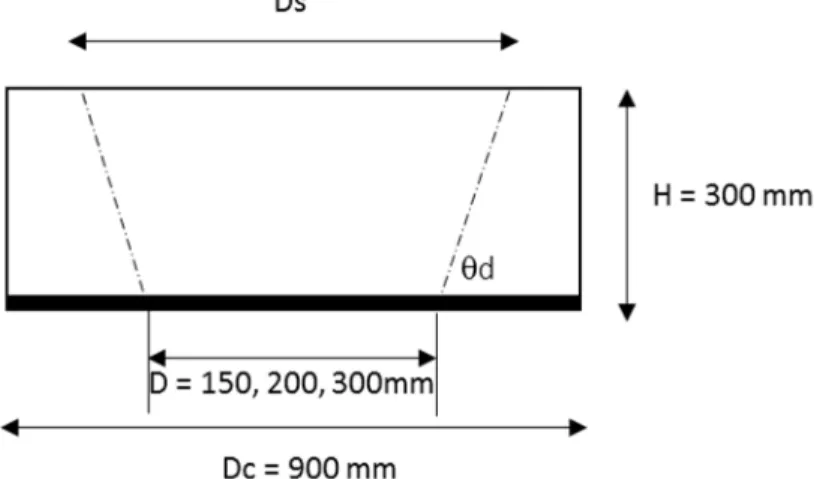
A 300 mm cavity was cut into the board at the bottom of the model, the stamp was aligned with the cavity. The results from the unreinforced model with respect to the ground surface deflection are presented in Figure 3.5 and are summarized in Table 3.1. The British Code states that "The analysis of this technique (Multi-layered geogrid reinforcement) is complex and is not covered further in this Code", (British Code BS.
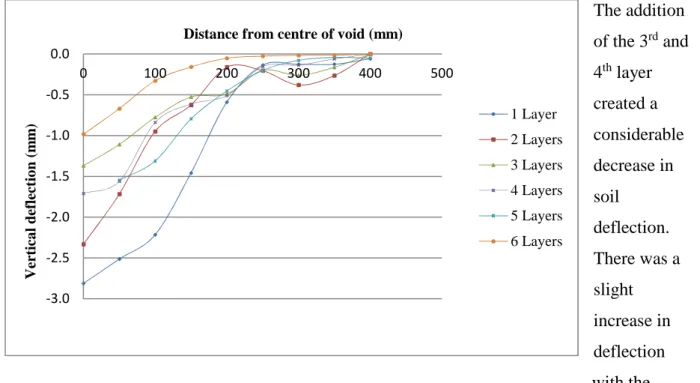
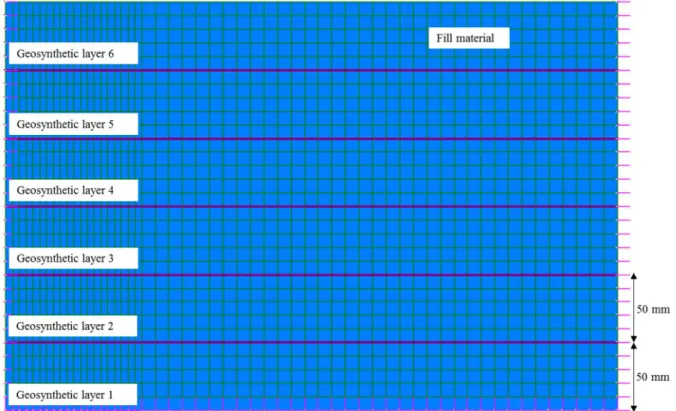
The objective of the laboratory tests was to relate the deflection of the ground surface to the height of the ground, the number of geogrid layers used and the diameter of the void. The position of the geosynthetic reinforcement and the general layout of the model is shown in figure 3.11. From Figure 3.13 a slight decrease in soil deflection was observed with the addition of the second layer of reinforcement.
In Figure 3.14, a gradual decrease in the bending of the soil surface can be seen with the addition of the 2nd and 3rd layers. The inclusion of the 4th reinforcement layer showed an unexpected increase in surface deflection. This results in the redistribution of some of the vertical loads to the horizontal loads, creating a soil arching effect.
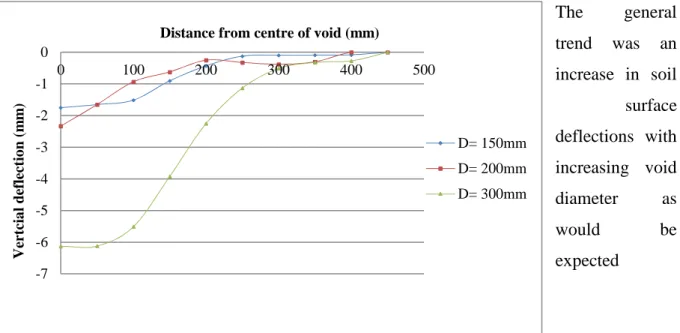
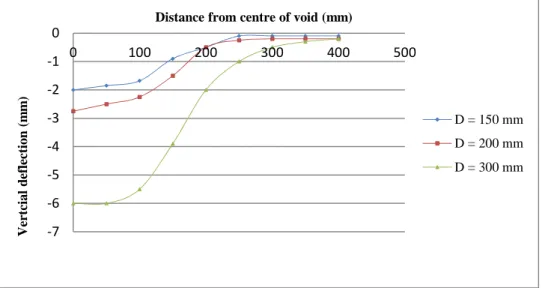
The diameter of the settlement cone was the same when the void diameter was 150 and 200 mm. The propensity of the soil to arch affected the outcome of the test results, causing variations. The draft angle that determined the diameter of the ground surface cone is approximately 600.
CHAPTER 4: COMPARISON OF MODEL DATA WITH CURRENT DESIGN
- Analytical investigation: Reinforced model
- SANS 207:2006
- RAFAEL Method
- Comparison between analytical methods and laboratory data
- Analytical results: SANS 207 vs Experimental data
- Analytical results: RAFAEL vs Experimental data
- Comments
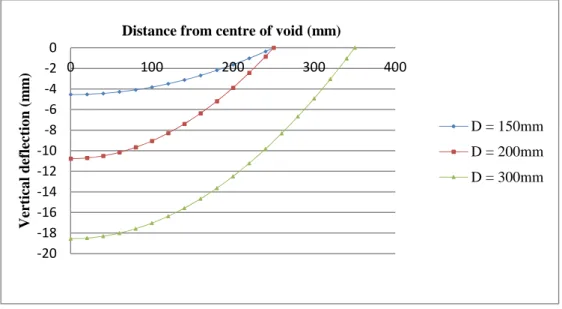
SANS 207 assumed that the pull angle was equal to the shear resistance angle of the soil (see section 2.8.1). This in turn indicated that the selected draft angle according to the design method set out in SANS 207 was incorrect. The results from Figure 4.3 in terms of settlement cone diameter are summarized and shown in Table 4.1 below.
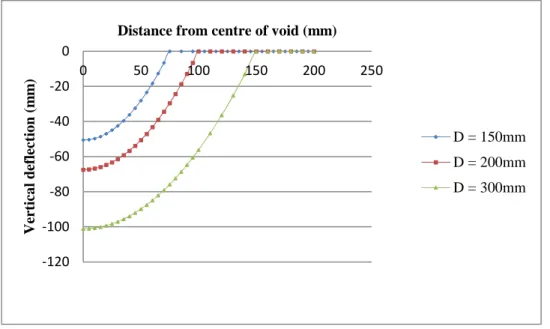
Using the results obtained in Table 4.2, a graph representing the soil surface deflection patterns assessed by SANS 207 was constructed and displayed. In the RAFAEL approach, the diameter of the soil surface deflection cone is assumed to be equal to the diameter of the void, i.e. the RAFAEL method for estimating soil/geogrid deflections differs from the SANS 207 methodology in that it takes soil dilation into account and the pull angle is different.
SANS 207 assumes that the void produces a deflection cone governed by the angle of spread (as the internal angle of the ground). Previous calculations showed that SANS 207 overestimated the diameter of the ground surface subsidence cone. This indicated that SANS 207 overestimates the area of effect of the sinkhole on the ground surface.
SANS 207 assumed that the volume of soil displaced at the level of the geosynthetic layer was equal to the volume of the cone of soil settlement at the ground surface, as shown in Figure 4.13 below (‰y = ‰4). Both analytical design methods had limitations when estimating the diameter of the ground surface settlement cone. This was due to the concentration of surface settlements directly above the void.
CHAPTER 5: NUMERICAL MODEL DEVELOPMENT
- Numerical model
- Rationale
- Basal reinforcement
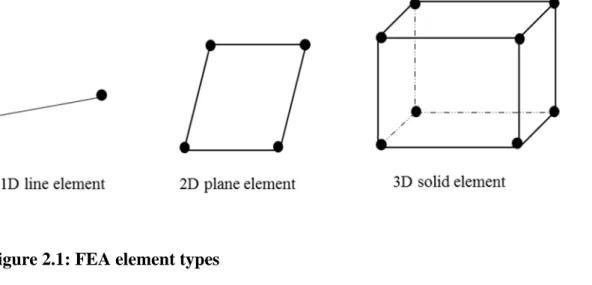
- Type of element
- Type of model analysis
- Model geometry
- Model mesh structure
- Restraint conditions
- Loading conditions
- Material characteristics
- Numerical analysis
The density of the mesh directly above the cavity was increased to improve the accuracy of the results in the area directly above the cavity. To simulate the formation of the void, the limiting conditions of the model were changed. The constraints on the geosynthetic layer were loosened and the geosynthetic layer was allowed to deform due to the weight of the soil fill above it.
In Figure 5.4 below, the constraints on the geosynthetic layer were released to simulate the formation of the cavity. Removing all boundary constraints from the geosynthetic layers allowed the nodes to move freely. This resulted in ground movement and downward deflection of the geosynthetic layer due to the weight of the soil above it.
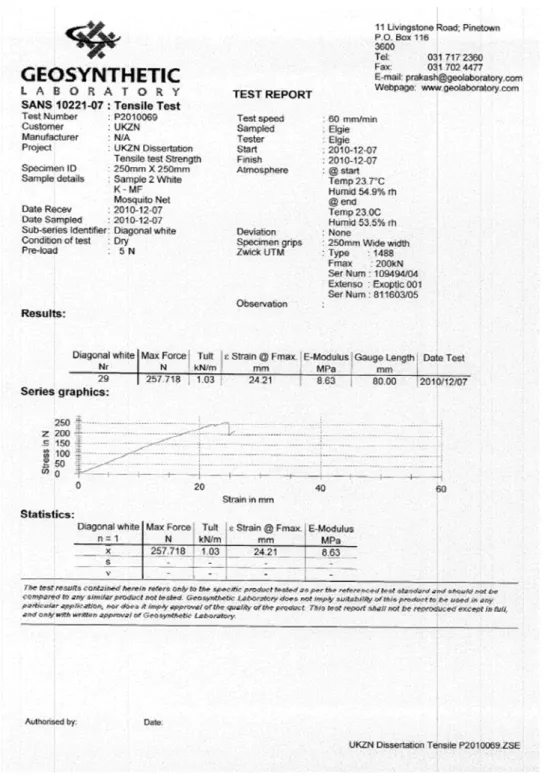
No surface loads were applied to the laboratory model, the ground moved downwards due to self-weight due to gravity. The geosynthetic properties in terms of tensile strength were calculated from Table 5.1 using a 1 mm geosynthetic thickness. Triaxle tests conducted on the ground in Sparks (2012) gave an average ground friction angle of 41º and a dry density of 16.96 (Results shown in Appendix B).
Non-linear models analyze the elastic-plastic soil deformation and are therefore used when the expected displacements in elements of the model are large (Strand 7 Verification Manual, 2013). The performance took place by changing the constraint conditions of the geosynthetic material as shown in section 5.1.7. The results obtained for all three H/D ratios were compared in terms of the soil surface and geosynthetic deflections in Chapter 6.
CHAPTER 6: NUMERICAL MODEL RESULTS
- Introduction
- Numerical model results Potts (2007)
- Soil surface settlement
- Magnitude of soil surface deflection
- Observations
- Numerical model results (de Lange, 2016)
- Finite element analysis simulation: Reinforced model
- Numerical model vs experimental model
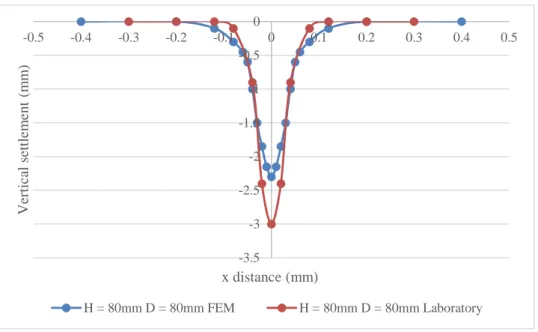
- Soil surface deflection comparison
- Deflection cone shape
- Observations
- Axisymmetric vs plane strain analysis
- Results: Axisymmetric vs plane strain
- Conclusions: Axisymmetric vs plane strain
- Methodology: 3D Model
- Results: 3D vs 2D Model
- Summary of observations
A comparison between Potts Laboratory (2007), FEM results and Strand 7 FEM results in terms of maximum ground surface deflections was summarized in Table 6.2. The diameter of the cone is relatively constant in both the FEM and laboratory models. The results of the FEM model can be improved by adjusting the material properties of the model.
One factor that accounted for the underprediction of the land surface deflection would be the occurrence of dilation in the soil mass modeled by Initial 7. The accuracy of the results however depended on the nature of the soil being modeled (dilative or non-dilatory). . In section 6.5 the numerical model was compared with the experimental results in terms of the maximum vertical deflection of the land surface as well as the shape of the settlement cone.
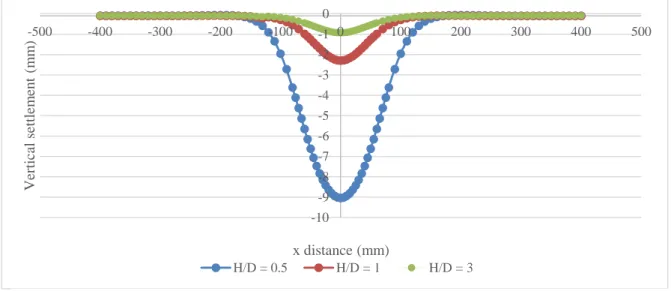
To get a better indication of maximum land surface settlements, the results for all H/D ratios are summarized in Table 6.4 below. The angle of void propagation or angle of withdrawal dictated the diameter of the cone of land surface settlement. The shape of the settlement cone predicted by the numerical model was generally shallower and wider than the experimental result.
This is again attributed to the overprediction of soil expansion from the Strand 7 program. The results of the FEM representation and the experimental models showed similar behavioral trends. The maximum values for settlements in the soil surface itself were not very accurate, but were at least of the same order of magnitude as the experimental data.
Chapter 7: APPLICATION TO VOIDS BELOW RAILWAY TRACKS
- Introduction
- Soil properties
- Geogrid properties
- Parametric model description
- Rail line characteristics
- Sleeper characteristics
- Parametric model properties
- Geosynthetic reinforcement properties
- Model limitations
- Methodology
- Parametric model mesh
- Type of element
- Restraint conditions
- Loading conditions
- Void formation
- Results parametric study
- Reference model
- Geosynthetically reinforced parametric model
- Results: Geosynthetically reinforced parametric mode
- Geogrid reinforced parametric model with void
- Soil parameters
- Young’s Modulus (E)
- Angle of internal friction ( )
- Earth pressure coefficient
- Cohesion
- Density
- Loading conditions
- Geosynthetic reinforcement parameters
- Tensile modulus (T)
- Number of geosynthetic reinforcement layers
- Discussion of results
The structural properties of the rail section used in the FEM model were developed from the dimensions shown in Figure 7.2 above. In the rail section developed for the FEM model, the cross-sectional area of the rail was 76. The boundary of the model was constrained by horizontal movement, but free in the vertical z direction.
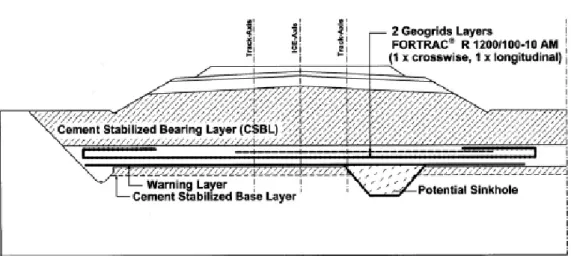
Thus, the FEM program provides a reasonable indication of rail stress under normal track conditions. The deformed shape of the 3D membrane representing the geotextile layer is shown in Figure 7.22 below. At this stage of the investigation, a 2 x 2 m void was created in the layer of raw bulk earthworks.
The addition of the void in the model resulted in an increase in rail deflection, stress and settlements as expected. An axle load of 26 T was considered in the previous parametric simulations, but the majority of railway lines in South Africa carry an axle load of 20 T. The maximum stress in the rail also showed a decrease with increased stiffness of the geosynthetic layer.
The increase in the tensile modulus of the geosynthetic caused an increase in the geosynthetic stress itself. The addition of rebar layers increased the overall stiffness of the molding, thus minimizing deflection in the model. The inclusion of the second layer of reinforcement resulted in the most significant reduction in geosynthetic stress.
CHAPTER 8: CONCLUSIONS AND RECOMMENDATIONS
- Introduction
- Experimental models
- Unreinforced model
- Reinforced model
- Finite element analysis
- Design approaches
- Parametric model
- Recommendations for future work
Increasing the H/D ratio resulted in a decrease in soil surface settlement in the majority of tests. Some of the factors that influence the predicted angle of propagation of the void are the angle of shear resistance of the soil and the angle of expansion of the soil. The accuracy of the results can be improved in the future by paying more detailed attention to material properties such as the angle of expansion of the bottom.
SANS 207 suggests that the angle of traction is equal to the angle of shear resistance of the soil. None of the methods gave an accurate indication of the pull angle and the subsequent set cone diameter. During the prediction of soil deformations in the FEM model, the automatic assignment of the angle of soil expansion was attributed to the program.
The void propagation angle currently used in SANS 207 results in an overprediction of the settling cone diameter and a shallower, wider settling cone. A Physical Study of the Dilation Angle of Cohesionless Soils, Kwa Zulu Natal: University of Kwa Zulu Natal Master's Thesis. The results of an analytical study of current design methods are attached in Appendix C.
The results of the Strand 7 FEM analysis describing the Potts case study are attached in Appendix D. The results of the Strand 7 FEM analysis describing the UKZN laboratory tests are attached in Appendix E. The results of the Strand 7 FEM analysis describing parametric model is attached in Appendix F.