The recent trend of increasing CO2 concentrations in the atmosphere (Vitousek et al. 1997) has led to a proliferation of studies on the direct effects of elevated CO2 concentration on plant growth. While physiological studies have long established that photosynthesis and transpiration are sensitive to leaf surface CO2 concentration (Ca) (Drake et al. 1997), a recent ecophysiological explosion has documented leaf- and plant-level changes that occur when plants are grown under an elevated CO2 supply. These studies have been motivated by the realization that predicting plant responses to increased CO2 levels will require an understanding of the physiological processes by which plants respond to elevated CO2 (Drake et al. 1997).
A number of in situ studies have investigated population-level and ecosystem-level changes in direct response to elevated CO2. In such studies, measurements of net CO2 assimilation (A) show reduced A for plants grown with elevated CO2 and ambient CO2 when measured at the same Ca (Drake et al. 1997). Plants supplied with elevated CO2 thus maintain a favorable C-N balance and generally showed increased growth rates despite a reduction in photosynthetic capacity (Drake et al. 1997).
Increased CO2 supply may therefore also result in increased light use efficiency, although empirical support for this is limited (see Drake et al. 1997). In order to predict responses to elevated CO2 at the population, community or ecosystem scale, the response of plants under natural conditions, where many factors can simultaneously limit growth, must be determined (Sinclair 1992, Arp et al. 1998). Finally, the vast majority of elevated CO2 research comes from North America and Europe (including those on woody legumes).
However, the response of almost all species of this biome to increased CO2 remains unknown.
RESULTS
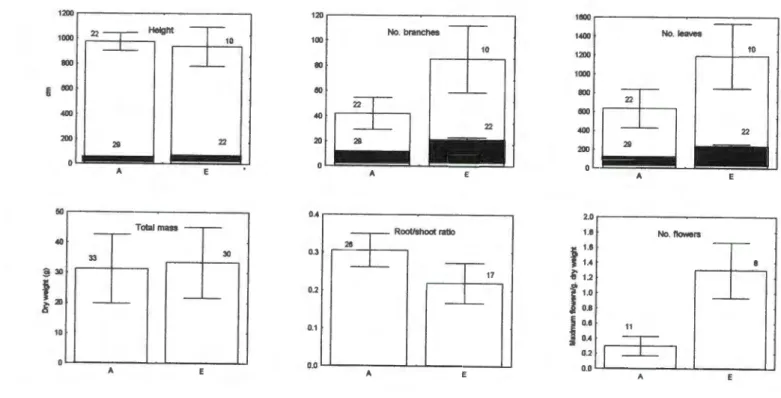
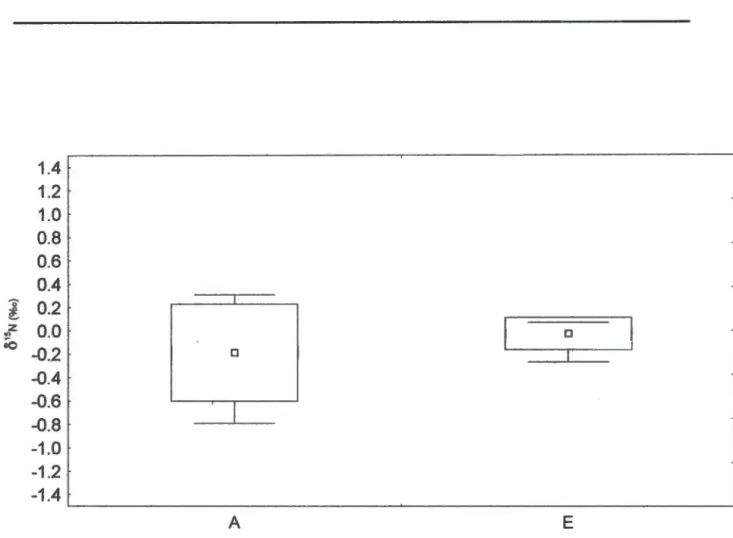
Shoot weights were different due to differences in both stem weight and leaf weight, but the difference was only significant for the former (F p = 0.02). The effect of shade alone was not significant for any of the variables measured after 17-19 months, including leaf area, SL W and leaf N concentration. The range of leaf 615N values for P. sericea was small and the values for plants from surrounding pots completely overlapped those from elevated pots (Fig. 6).
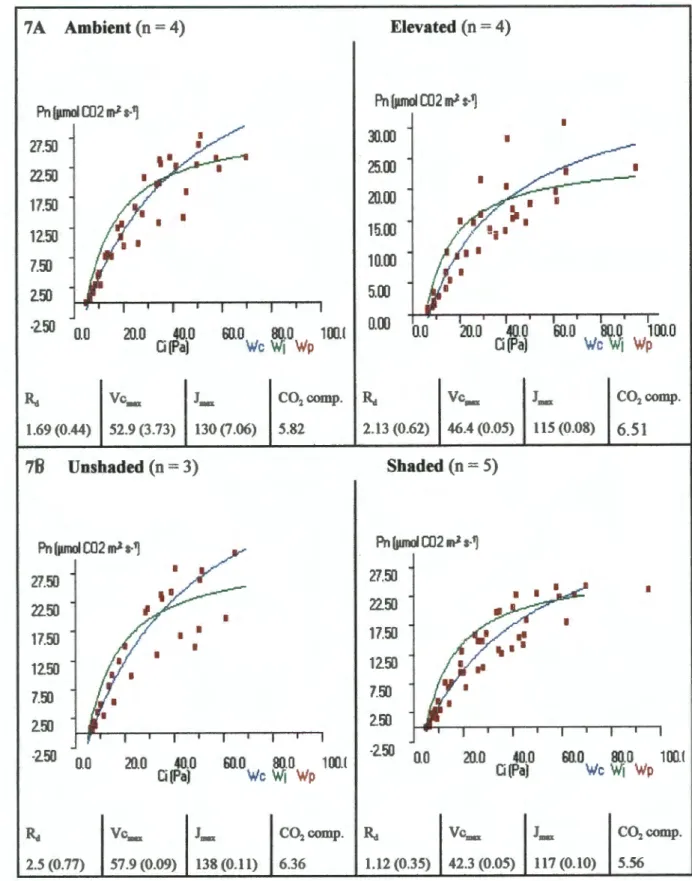
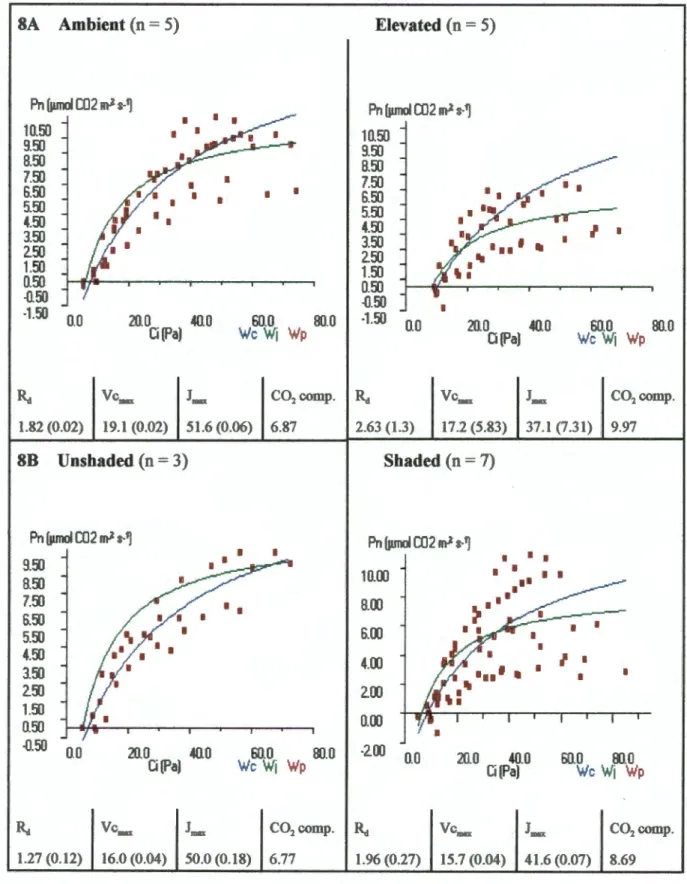
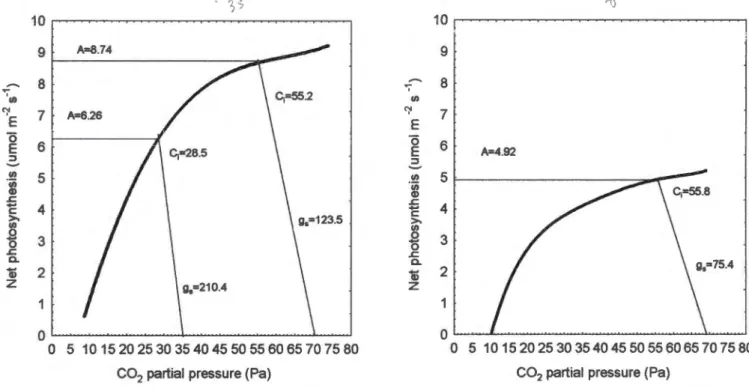
The rate of photosynthetic assimilation revealed a reduction in photosynthetic capacity for the increased plants after 9 months of growth (Fig. 7). These differences increased significantly after an additional 8 months, revealing a substantial negative photosynthesis adjustment with the increased treatment (Fig. 8). After 17 months of growth under 70 Pa CO2, the rate of photosynthetic assimilation predicted by the mechanistic model was lower for elevated plants with growth Ca than the environmental plants with growth Ca (Fig. 9).
The decrease in photosynthetic capacity exhibited by the elevated plants resulted from a reduction in both Vcmax and Jmax (Figs. 7 and 8). In the increased treatment, Vcmax was so low after 17 months that the CO2 compensation point was almost 10 µmol CO2 m-2 s-1. This value was well below A calculated for growth Ca (4.92 µmol CO2 m-2 s-1) indicating that Rubisco activity alone limited A.
For the plants grown at Ca, the CO2 compensation point was approximately equal to A at growth Ca, indicating that Rubisco activity was at a maximum. Although g was significantly reduced in the elevated treatments, Ci was similar for both treatments at 70 Pa CO2 (Fig. 9). Differences in Vcmax and Jmax were greater between shaded and unshaded pots than between elevated and ambient pots.
Thus, the differences in slope between the elevated and ambient A/Ci curves may be an artifact of shadowing effects within each treatment. CO2 supply therefore appears to become more important after 17 months, in terms of limiting photosynthetic capacity. TPU was not estimated as A values did not appear to reach saturation in any of the data sets.
The parameters calculated by the model are given in the table below each diagram (+/- 1 SE), units = µmol CO2 m 2 s 1. Data from individuals from separate pots are combined according to CO2 supply (8A) and shadow category (8B).
DISCUSSION
g, however, was much lower in the elevated plants than the environments when both were measured at a Ca of 70 Pa. Reduced g, in the increased treatment, may be increased by a feedback effect due to photosynthetic acclinµlsion - a reduction in A leads to increased Ci which induces stomatal closure (Drake et al. The similarity of leaf N concentrations (specific leaf area) in this experiment is therefore abnormal, especially considering that NCi data indicate reduced Rubisco activity in the elevated treatments.
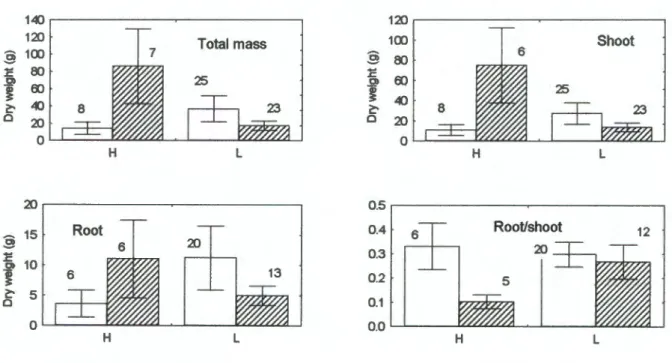
Since the measurement temperatures were constant and Ci was not lower in the elevated plants, reduced Rubisco activity suggests that less Rubisco was present. However, a positive growth response to elevated CO2 supply may have been prevented if maximum potential growth rates were achieved at ambient CO2. Only in the unshaded pots were the plants able to achieve significantly more biomass, suggesting that light was more limiting than CO2 availability in the shaded pots, regardless of CO2 input.
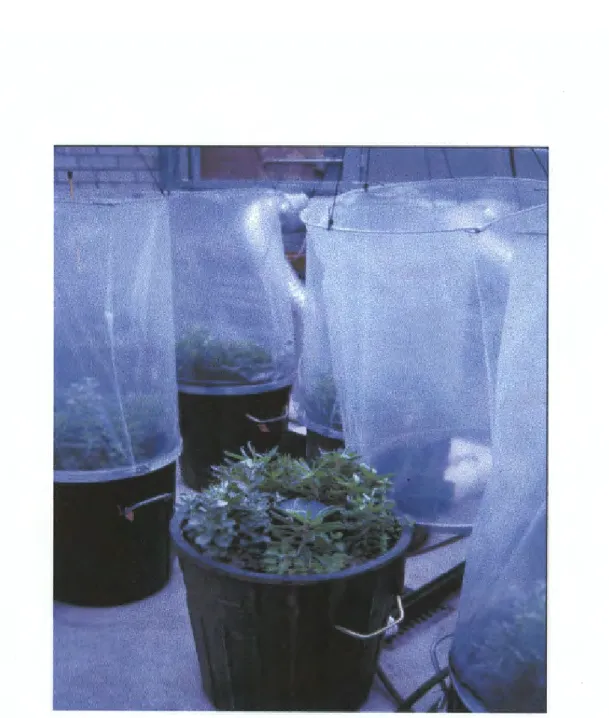
It is also possible that plants in unshaded pots lacked light due to shading by other species and plastic wrap (see Figure 1). This would contribute to a significant increase in the number of branches and leaves in the raised treatment for shaded and unshaded pots combined. The range of A values obtained in the shaded pots after 17 months (Fig. 8B) may therefore be due to many shaded plants experiencing less shading than before, and the comparison in Figs.
Together with the known potential for a positive growth response under limited light conditions (Drake 1997), this suggests that another factor was involved in preventing a positive growth response in the experiment. This translates into a significantly higher water use efficiency in the elevated treatments, despite a reduction in A - assuming the values in Figs. Therefore, a positive growth response to the elevated treatment may have been suppressed after the available rooting volume was filled.
Higher shoot mass but not root mass in the elevated treatment suggests that this may have been the case. This overlap could also arise if soil 615N was close to Oo/oo or if fractionations involved in the assimilation of soil N resulted in leaf 615N from Oo/oo (Handley and Scrimgeour 1997). N2 fixation may have been limited in providing resources to the nodules, even in increased CO2 supply.
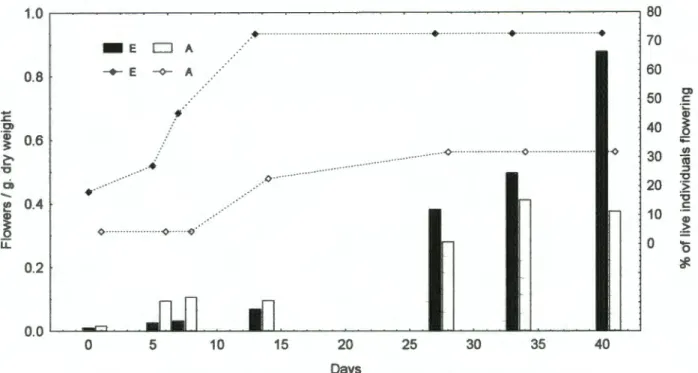
More branches in the elevated treatment may have resulted in more points for floral meristems to develop. Alternatively, flower growth may have created a strong sink for photosynthates and accumulated additional carbohydrates produced in the elevated treatment.
CONCLUSION
Under natural conditions, plants are probably exposed to a number of growth-limiting factors other than CO2 supply. The lack of long-term, positive growth in this experiment may therefore apply to P. Although growth conditions in this experiment may be similar to those in nature (in that competition for light and nutrients was high), they were not necessarily the same as those encountered by the last.
For example, it seems unlikely that restrictions on shading or rooting would be so severe. In situ studies at the population level are therefore necessary to confirm any predictions about. Limited research on in situ herbaceous species has produced inconsistent results, with some studies showing no long-term benefit for both legumes and non-fixers (e.g., Bunce 1995) and others showing a greater benefit for legumes compared to non-fixers (Stewart and Potvin 1996; Luscher et al. 1998). increased flower production in elevated plants should be considered. sericea is limited in its abundance and distribution by seed production, increased flower production could have major benefits for this species at the population level.
Effect of nodulation, nitrogen fixation and CO2 enrichment on the physiology, growth and dry mass allocation of seedlings of A/nus rubra Bong. 1991) Effects of source-sink ratios on photosynthetic acclimation to elevated CO2. 1998). Interactions between elevated CO2 concentration, nitrogen and water: effects on growth and water use of six perennial plant species. 1990). The response of natural ecosystems to rising CO2 levels. 1995) Long-term growth of alfalfa and orchardgrass plots at elevated carbon dioxide.
- thermal responsiveness to CO2 in free air. enrichment of functional types, species and genotypes of fertile permanent grassland plants. 1996). Growth responses to vesicular-arbuscular mycorrhizae and elevated CO2 in seedlings of the tropical tree Beilschmedia. POORTER (1998) Do slow-growing species and nutrient-stressed plants respond relatively strongly to elevated CO2.
In Global Change and Mediterranean-Type Ecosystems, Ecological Studies Vol. 1991) Nitrogen dynamics and seedling growth of an N-fixing tree (Gliricida sepium (Jacq.). Leaf gas exchange and nitrogen dynamics of N2-fixation, A/nus glutinosa grown in the field under elevated atmospheric CO2 1993) Limitations of biochemical carbon assimilation in C3 plants - a.
ACKNOWLEDGEMENTS