DBH, average height, trees per hectare and stand volume for thinned plots.54 Table 14: Site information of the 13 plots selected to assess trends in 3-PG. TPH1 Final stems per hectare at the time of last mensuration (trees.ha-1) Tt daily total atmospheric transmission of solar radiation.
INTRODUCTION
INNOVATION FUND PROJECT AND OBJECTIVES OF THIS STUDY
By simply selecting cards, it will be possible for the user to access temperature; rainfall and other necessary input data relevant to the selected Pinus elliottii site. Tree growers and strategic land use planners will be provided with a decision support software tool based on a relatively simple model of physiological processes that control growth and water use in plantations.
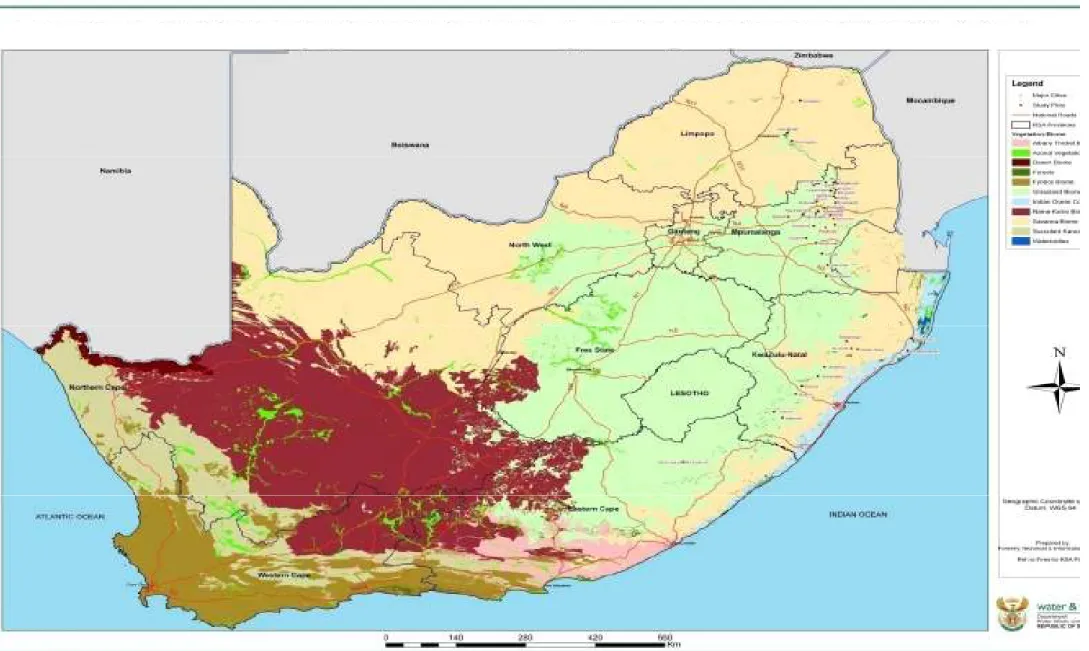
PINUS ELLIOTTII IN SOUTH AFRICA
CHARACTERISTICS AND GROWTH CONDITIONS OF PINUS ELLIOTTII
- Pinus elliottii Engelm. var. Elliottii
- Plantation area, and typical management of Pinus elliottii
Optimum soil depth may vary with altitude, but Pinus elliottii can grow reasonably well in shallow soils. More information covering various aspects of Pinus elliottii is reported by Morris and Pallett (2000) and Zwolinski and Hinze (2000).
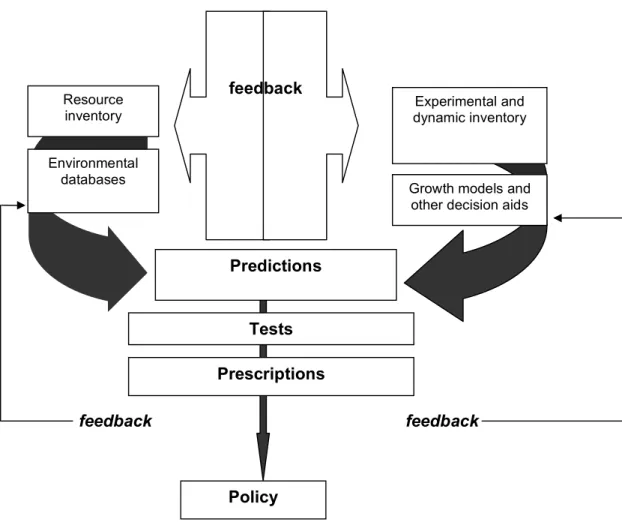
MODELLING IN FORESTRY
OVERVIEW OF FORESTRY MODELLING
THE RELEVANCE OF PROCESS-BASED MODELS TO THE SOUTH
These authors also demonstrated the valuable role that PBMs can play as an operational or research tool that allows testing hypotheses about how trees function and respond to environmental change. The challenge is to adapt and improve such process-based modeling (PBM) systems to South African conditions and provide growers with a useful tool to meet their practical needs.
THE 3-PG MODEL
- BACKGROUND
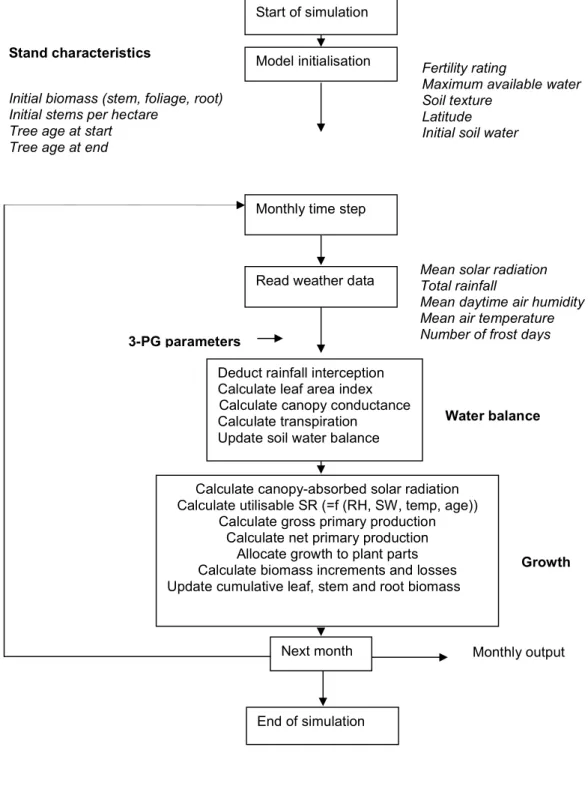
- OVERVIEW OF THE 3-PG MODEL
- THE 3-PG MODEL STRUCTURE
- The 3-PG model input and output
- Species parameters
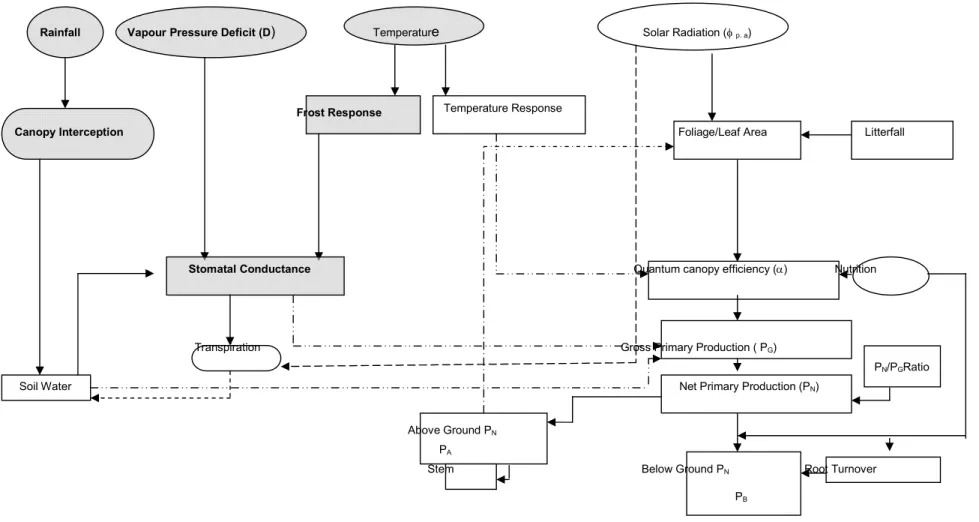
- DETAILS OF SOME MAJOR 3-PG PROCESSES
- Assimilation of carbohydrates (Gross primary production)
- Distribution of biomass (Biomass allocation)
- Stem mortality
- Soil water balance
- RECOMMENDED SOURCES OF DATA
A number of authors provide an overview of 3-PG model processes and this dissertation refers to the original description given by Landsberg and Waring (1997) and the modifications of 3-PG by Sands and Landsberg (2002, pp. 289-291) ). ). Net primary production (NPP) is then calculated as a constant proportion (Cpp=0.47) of gross primary production (PG) (Sands and Landsberg, 2002).
METHODOLOGY
INITIAL STANDS
STAND SELECTION PROCEDURE
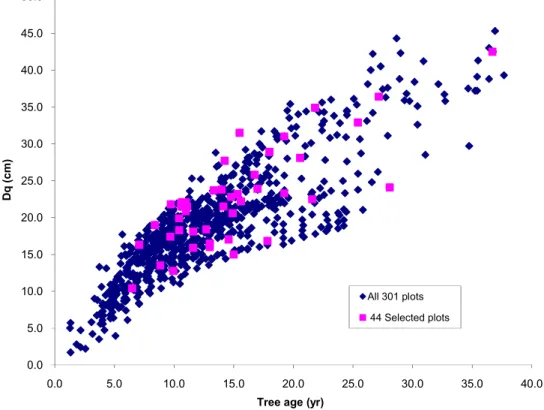
Root mean square diameter (Dq) was plotted against tree age to give a general impression of changes in tree size with age (Figure 6). Stands from the MMRC database had associated Dq and root-mean-square height (Hq) estimates, while Zwolinski et al., (1998) estimated tree diameter in North East Cape Forest (NECF) stands from tree-ring analyses. In coastal Zululand, tree diameters at breast height were recorded in the field as mean stand diameters.
However, no effort was made to convert mean diameters to Dq because there is little difference (about five percent of the variance) between Dq and mean diameters at breast height (D Wilson, 2004, personal communication1). Stands were then selected along the upper and lower edges of the scattered data points to ensure that productivity extremes were included (Figure 6). The acceptable range of stand density was set at 1111 to 1400 trees per hectare, except in a few cases where stands represented a unique combination of growth factors.
At least one stand from each district was selected to maximize the chance to sample different climates and soils. In some districts, more than one stand was selected if there were significant variations in growth or environmental gradient.
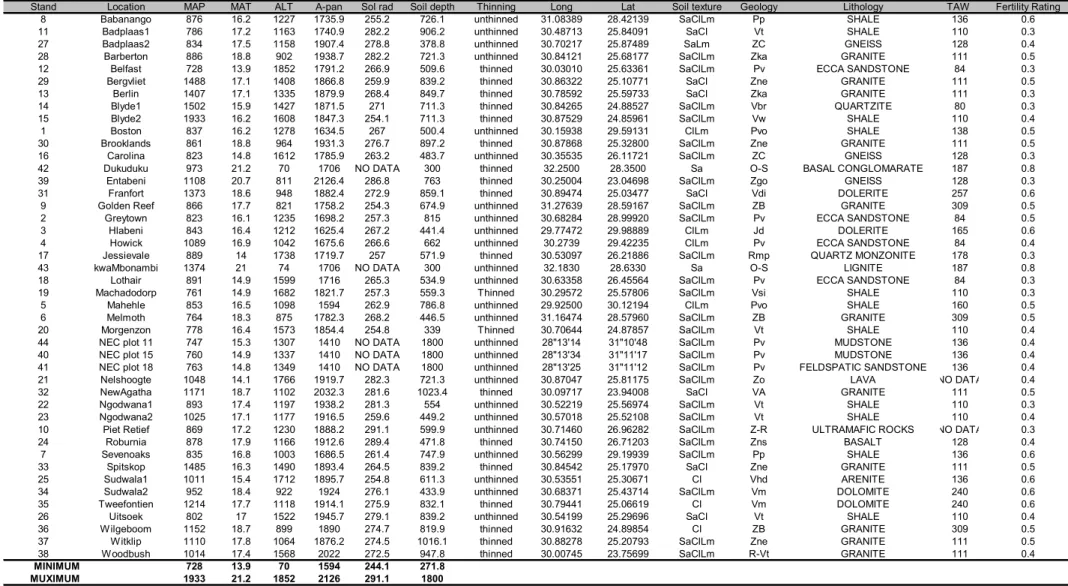
STAND INFORMATION AND FINAL SELECTION OF STANDS
MODEL INITIALISATION DATA
- Initial stem biomass
- Initial foliage biomass
- Initial root biomass
- Fertility rating
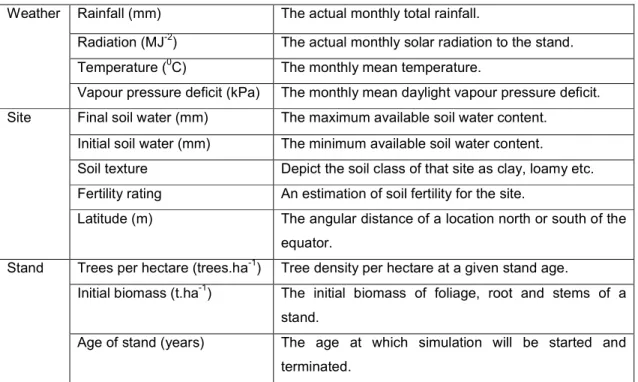
- Weather and soil data
- Initial trees per hectare
- Thinning regimes
Dominant heights at age four were used to divide all 44 stands into three size classes. Average heights and diameters were used to calculate average volumes in each stand using the Schumacher and Hall model (Bredenkamp, 2000). A calculated mean wood density of 378 kg.m-3 (A Zbonak, 2004, pers.comm2) for Pinus elliottii was used to convert stem volume to stem dry mass.
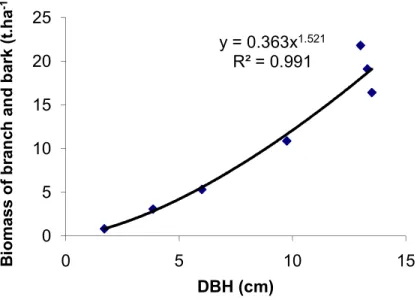
Finally, a relationship (R) reported by Morris (1992) for Pinus patula in Swaziland was used to estimate branch and bark mass from stem DBH. The value for Wf was estimated from mean DBH using the two equations given by Myers ( 1984) for Pinus elliottii predicting wood, bark and foliage. This relationship was used to estimate Wr at age four for all stands in this study.
However, all predictions began at age four, by which time most of the early mortality associated with tree placement had already occurred. Therefore, it was assumed that in each stand the number of trees per hectare at the age of four years is equal to the value determined by the ratio TPH1/TPH0 multiplied by 0.90.
ESTIMATION OF PINUS ELLIOTTII PARAMETERS
- Foliage to stem ratios
- Allometric relationship of stem mass against diameter
- Net primary production fractions allocated to roots
- Cardinal temperature
- Litterfall
- Average monthly root turnover rate
- Canopy conductance
- Specific needle (leaf) area of Pinus elliottii
- Extinction coefficient for absorption of PAR by the canopy
- Proportion of rainfall lost as interception
- Leaf area index for maximum rainfall interception
- Canopy quantum efficiency
- Basic density of wood
- Stem mortality
- Other parameters
Where previous thinnings were not shown, thinning was assumed to have occurred at the standard rotation intervals shown by Kassier and Kotze (2000) for South African Pinus elliottii plantations. Johnson (1990) reported the effect of fertigation on dry matter distribution in young Pinus elliottii. These authors found that treated (fertilized and suppressed) Pinus elliottii stands had an annual average litter rate that increased from about 4.25 Mg.ha-1.year-1 at six years of age to a steady state.
These values are low compared to those reported by Jarvis and Leverenz (1983) and Cropper and Gholz (1993), which are 0.62 and 0.468, respectively, for Pinus elliottii. This variation is confirmed by the L values reported above, which can be as high as 72% (of the lowest recorded L values) for Pinus elliottii during the growing season. The canopy quantum efficiency (% PAR actually used by trees) was initially taken as 0.0111 molC.mol-1 PAR, a value reported by Cropper (2000) for Pinus elliottii.
A density range of 350-450 kg.m-3 was measured for seven different Pinus elliottii trees aged one to seven years. It is striking that in almost all measured Pinus elliottii trees the density of the first two to three annual rings closest to the pith was higher than in younger rings.
PARAMETERISATION PROCESS ASSUMPTIONS
PARAMETERISATION PROCEDURE
Ratio basic density of young trees/density of old trees Both Default 0.4 t.m-3 Sand in. Slope of ratio of net radiation to solar radiation Both Adjusted 0.8 This study Molecular weight of dry matter Species Adjusted 24 gDMmol-1 This study Conversion of solar radiation to PAR Both Adjusted 2.3 molMJ-1 This study.
EVALUATION OF 3-PG PREDICTIONS
STATISTICAL ANALYSIS
RESULTS
- Parameterisation of 3-PG for Pinus elliottii growth
- Model over-predictions
- Model under-predictions
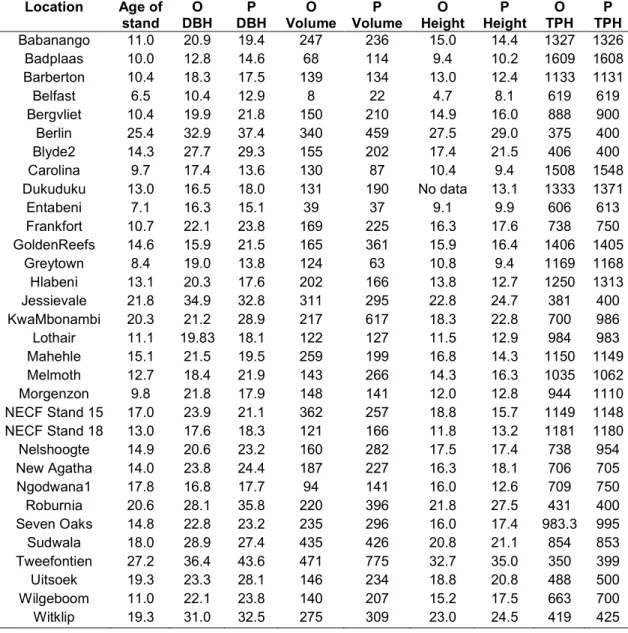
- Validation against 12 independent test stands
- Evaluation of model predictions for all 44 stands
- General trends in leaf area index
- Thinned versus unthinned stands
- The effect of drought
- General trends in evapotranspiration
- Annual evapotranspiration
They argued that this behavior is a result of the inclusion of the outlier(s) in the evolution of the single set of parameter values. In the Mahehle stand, a severe drought was recorded in 1992 and 1993, which is reflected in the modeled growth of the trees. NECF stand 15 was not cultivated for commercial purposes and was one of the most productive sites in NECF stands (CAI= 21.3 m3.ha-1.year-1).
Certainly with the NECF stand 15, the forecast contradiction lies in the initial biomass estimate which in this study is directly correlated with final biomass of the NECF stand 15. However, stem volumes were again over-predicted in eight out of the 12 stands (Table 11 and Figure 10) . These plots increased diameters and tree volumes, most likely due to the logarithmic assumptions by 3-PG in (Landsberg and Waring, 1997).
Half of the stands were thinned wooden bleachers, while the rest were thinned wooden bleachers. It is assumed that this ET trend follows changes in stand L (See Section 6.2.3.1). When a plot of ET and L with annual precipitation is represented as the size of the symbols, LAI appears to be the main determinant of ET rates rather than precipitation according to Figure 19.
Older trees with stable L (about 2- 2.5 m3.m- . 3) have relatively the same ET rates, regardless of the amount of rainfall.
DISCUSSION AND CONCLUSION
The accuracy and credibility of the 3-PG modeling will not reach its potential as long as all model parameters are not accurately determined. Methods to measure site- and species-specific parameters must soon be devised for Pinus elliottii and other forestry species. It would be to the benefit of the South African forestry industry if it reflected the local measurements.
Once these methods are devised, it is important that they are implemented correctly because some of the site and stand factors are acutely sensitive to changes in these parameters. Predictions at these sites should be validated by accurate monthly measurements of stand structure (especially diameter, height growth and L) and correlated to common field measurements (e.g. tree water status, sap flow rates and crown conductance) that describe the physiological status of the trees. Such studies will lead to further adjustments in species parameters developed in this study (Table 15) and to further insights into.
Although 3-PG predicts growth realistically, there are still some concerns and uncertainties based on this study. This is because the core of this study and the research course taken was to develop only 3-PG parameters that will produce the best fit for Pinus elliottii predictions in South Africa.
A new decision support software tool for tree growers and water resource managers: harnessing physiological information to improve productivity and water assessment of forest plantations. A review of process-based forest plantation models and the selection of a model that fits the requirements of the Innovation Fund project. Parameterization of 3-PG for Eucalyptus grandis plantations in the summer rainfall regions of South Africa.
A general model of forest productivity using simplified concepts of radiation use efficiency, carbon balance and partitioning. Report to the Southern African Regional Commission for the Conservation and Utilization of the Land (SARCCUS). A general model of forest productivity using simplified concepts of radiation use efficiency, carbon balance and partitioning.
A report on a research project carried out under the auspices of the Soil and Irrigation Research Institute, Department of Agricultural Development, Pretoria. Testing the utility of 3-PG for the growth of Eucalyptus grandis x urophllla with natural and manipulated water and nutrient supplies.
APPENDICES
Annual NPP cumNPP tDM/ha/ year Annual total leaf litter Annual litter fall CumLittfall tDM/ha/ year Growth modifiers. Temperature dependent modifier fTemp fT Frost dependent modifier fFrost fFrost Groundwater dependent modifier fSW fSW Nutrient dependent modifier fNutr fNutr Physiological modifier of canopy. Leaf litter fall Litter fall rate Litter fall 1/month Monthly total leaf litter fall Litter fall delFloss tDM/ha/month Water use.
Maximum fraction of NPP to roots hRx pRx Species - Minimum fraction of NPP to roots hRn pRn Species - Temperature modifier. Power of relative age in phage nage nAge Species - Relative age to give phage = 0.5 rage Rage Species - Precipitation and root renewal. Specific leaf area at standing age 0 Σ0 SLA0 Species m2 kg-1 Specific leaf area at maturity.
Fraction of branches and bark at age 0 pBB0 fracBB0 species - Fraction of branches and bark for mature. Maximum base density - for older trees rx rhoMax both t m-3 Base density ratio for young trees.
Names and description of 3-PG output variables
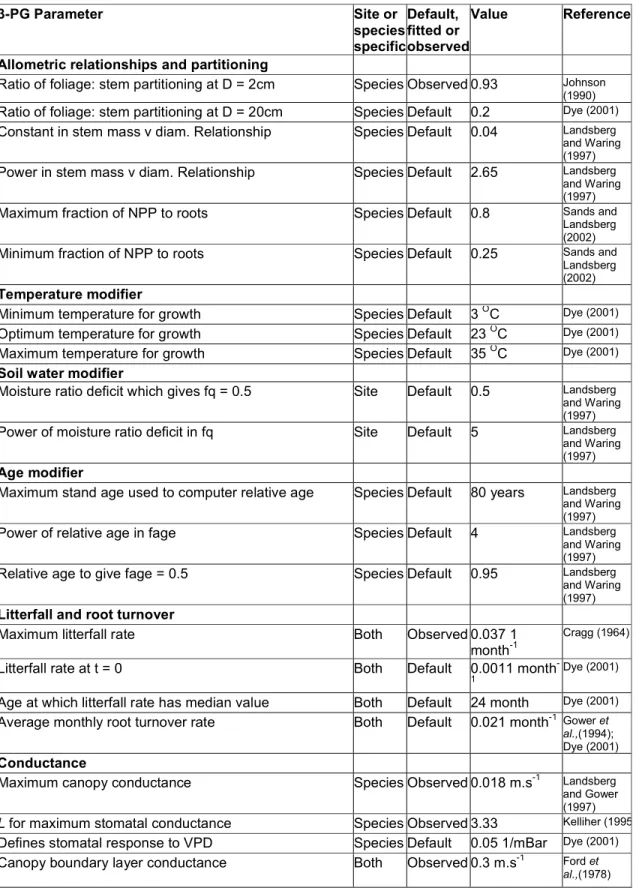
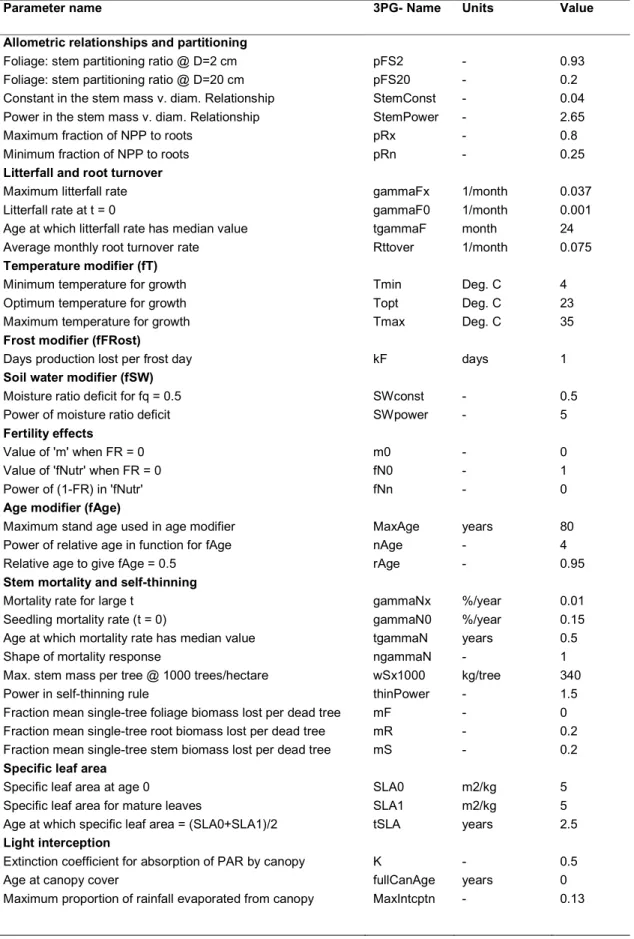
Description of 3-PG parameters
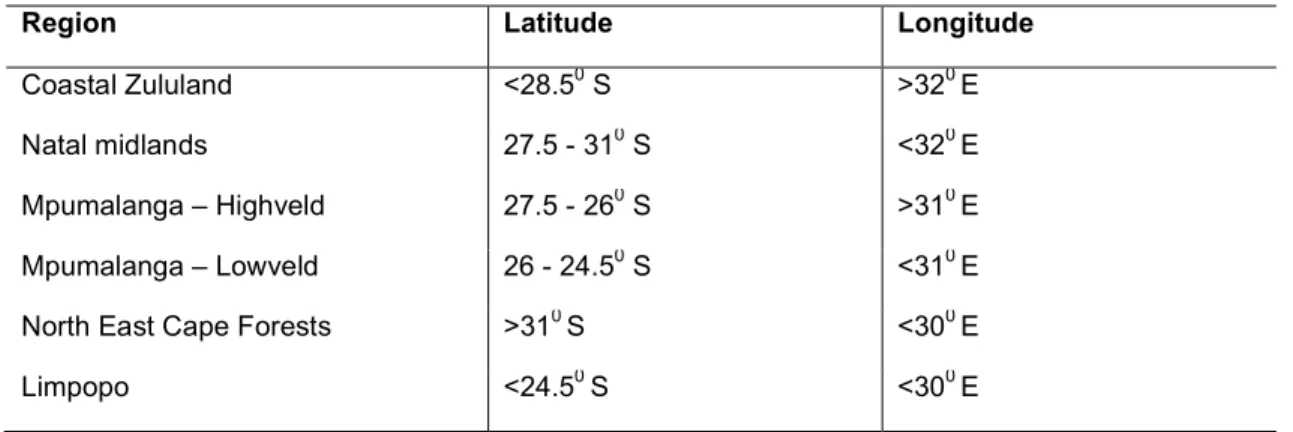
A list of districts in which study stands were selected
Wood density estimation method
Stand starting biomasses and growth variables
Example of a single site run input worksheet in 3-PGpjs version