UNIVERSITY OF KWAZULU-NATAL
College of Law and Management Studies
School of Management, Information Technology and Governance
Performance evaluation of a South African aluminium manufacturing company based in Pietermaritzburg: The Balanced Scorecard Approach
By
Student: Mandisa Mgabhi- 208505214
A dissertation submitted in partial fulfilment of the requirements for the degree of Master of Commerce in Business Management
Supervisor: Dr Vangeli Wiseman Gamede 2021
i
DECLARATION I Mandisa Precious Mgabhi declare that:
➢ The research reported in this thesis, except where otherwise indicated, is my original work.
➢ This thesis has not been submitted for any degree or examination at any other university.
➢ This thesis does not contain other persons’ data, pictures, graphs or other information, unless specifically acknowledged as being sourced from other persons.
➢ This dissertation/thesis does not contain other persons’ writing, unless specifically acknowledged as being sourced from other researchers. Where other written sources have been quoted, then:
a) their words have been re‐written, but the general information attributed to them has been referenced.
b) where their exact words have been used, their writing has been placed inside quotation marks, and referenced.
➢ where I have reproduced a publication of which I am author, co‐author or editor, I have indicated in detail which part of the publication was actually written by myself alone and have fully referenced such publications.
➢ This thesis does not contain text, graphics or tables copied and pasted from the Internet, unless specifically acknowledged, and the source being detailed in the thesis and in the references sections.
Signed: Date: 30/05/2021
ii
ACKNOWLEDGEMENTS
A word of sincere thanks and appreciation to the following people, without whose assistance and support this study would not have been possible:
My supervisor Dr Vangeli Gamede for his input and Irene Loubster the course administrator for her warm heart and support. I would also like to thank my mentor Dr Lucky Makhanya and dear friend Dr Hector Moloi for their input, support and guidance throughout this mini dissertation.
A special thanks goes to my former Hulamin colleagues which contributed significantly on collecting data from 187 participants: Boxer, Siboniso Mtolo, Michael Ndlovu, Mbali Shangase and Sakhile Kubeka.
Finally, I would like to thank all my kid’s nannies for keeping my son Monwabisi and daughter Yibanathi well-cared while I pursued my studies.
iii ABSTRACT
The current state of manufacturing industry in South Africa is in decline. Measuring and evaluating the firm’s performance to compete, grow and withstand harsh external forces is necessary. This will assist business executives to formulate and implement strategies that will provide a clear roadmap to achieve desired objectives.
To address performance of a manufacturing company, literature related to business performance measurements and evaluation methods was reviewed. Furthermore, the research explored literature related to Kaplan and Norton Balance Scorecard as theoretical framework adopted for this study. The literature reviewed the Balance Scorecard as a business performance measuring tool by exploring each Balance Scorecard perspective individually and its relationship with business strategy.
This study adopted post-positivism (positivist) paradigm as the data was quantitative nature.
The primary data was collected by means of questionnaires which were analysed by means of descriptive statistics. There were 217 questionnaires distributed to participants, 187 completed responses were received, yielding a response rate of 86%. The results were measured to be reliable using Cronbach’s alpha.
The aim of this study was to evaluate business performance within a South African manufacturing company using Hulamin as the case. The results showed inconsistency amongst the four Balanced Scorecard perspectives. The respondents indicated positive response on customer perspective, internal business process perspective and performance management whereas on financial and learning and growth perspective respondents indicated negative responses. Furthermore, the results and literature indicated that the Balanced Scorecard is not an adequate tool to be solely used to evaluate overall business performance.
iv
TABLE OF CONTENTS
CHAPTER 1: OVERVIEW OF THE STUDY ... 1
1.1 Introduction ... 1
1.2 Study Background ... 1
1.3 Research Problem ... 3
1.4 Study Site ... 3
1.5 The Aim of the study ... 5
1.6 Research Objectives ... 5
1.7 Research Questions ... 5
1.8 Significance of the Study ... 5
1.9 Format of the Dissertation ... 6
1.9.1 Chapter 1: Overview of the Study ... 6
1.9.2 Chapter 2: Literature ... 6
1.9.3 Chapter 3: Research Methodology... 6
1.9.4 Chapter 4: Results Presentation ... 6
1.9.5 Chapter 5: Discussion ... 6
1.9.6 Chapter 6: Conclusion... 6
1.10 Chapter Summary ... 6
CHAPTER 2: LITERATURE REVIEW ... 7
2.1 Introduction ... 7
2.2 Organisational Performance... 7
2.2.1 Performance Measurement ... 8
2.2.2 Performance Evaluation ... 9
2.3 Performance Measurement and Evaluation Theories ... 9
2.3.1 The Social Responsibility Theory ... 10
2.3.2 Resource Based Theory ... 10
2.3.3 The Stakeholders Theory ... 11
2.3.4 The BSC Approach ... 13
2.3.4.1 The Evolution of Balanced Scorecard ... 15
2.3.4.2 The BSC Shortfall ... 16
2.3.4.3 Advantages of BSC ... 17
v
2.4 The BSC As a Performance Measurement Tool ... 17
2.4.1 BSC and Strategy ... 18
2.4.1.1 Strategy Challenges ... 20
2.4.2 Learning and Growth Perspective ... 20
2.4.3 Internal Business Processes Perspective ... 21
2.4.4 Financial Perspective ... 24
2.4.5 Customer Perspective ... 25
2.5 Summary ... 26
CHAPTER 3: RESEARCH DESIGN AND METHODOLOGY ... 27
3.1 Introduction ... 27
3.2 Research ... 27
3.3 Research Paradigm... 28
3.4 Research Design... 29
3.5 Research Approach ... 30
3.6 Target Population ... 30
3.7 Sampling ... 31
3.8 Sampling Method ... 31
3.8.1 Probability Sampling ... 31
3.8.2 Non-probability Sampling ... 31
3.9 Sample and Sample Size ... 32
3.10 Data Collection ... 34
3.10.1 Primary Data ... 34
3.10.1.1 Survey Questionnaire ... 34
3.10.1.2 Survey Questionnaire Administration ... 35
3.10.2 Secondary Data ... 36
3.10.3 Document Collection ... 36
3.11 Data Analysis ... 36
3. 12 Validity and Reliability ... 36
3.12.1 Validity ... 36
3.12.2 Reliability ... 37
3.13 Ethical Consideration ... 37
3.14 Chapter Summary ... 38
CHAPTER 4: RESULTS PRESENTATION ... 39
4.1 Introduction ... 39
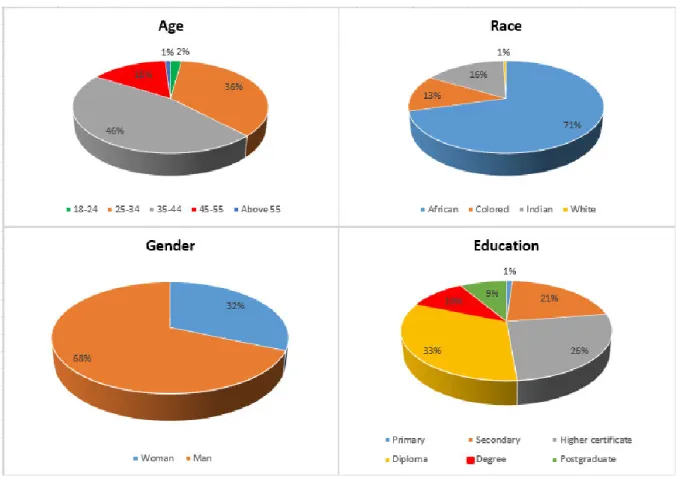
4.2 Demographic ... 39
vi
4.2.1 Age ... 42
4.2.2 Race... 42
4.2.3 Gender ... 42
4.2.4 Education ... 42
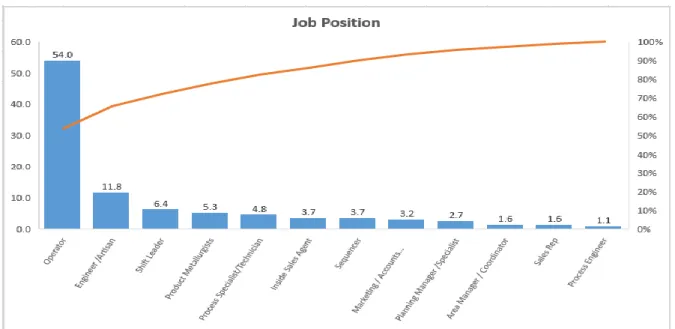
4.2.5 Job Position ... 42
4.2.6 Department ... 42
4.3 Interval-scale Data ... 42
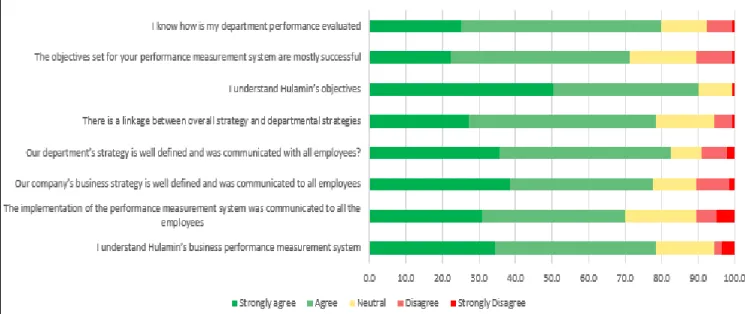
4.3.1 Performance Management ... 42
4.3.1.1 I understand Hulamin’s business performance measurement system... 44
4.3.1.2 The implementation of the performance measurement system was communicated to all the employees... 45
4.3.1.4 Our company’s business strategy is well defined and was communicated to all employees. ... 45
4.3.1.5 Our department’s strategy is well defined and was communicated with all employees. ... 45
4.3.1.6 There is a linkage between overall strategy and departmental strategies ... 45
4.3.1.7 I understand Hulamin’s objectives... 46
4.3.1.8 The objectives set for your performance measurement system are mostly successful 46 4.3.1.9 I know how is my department performance evaluated? ... 46
4.3.2 Learning and Growth and Respondents Perspective ... 47
4.3.2.1 My opinions and ideas assist to improve performance in my department ... 48
4.3.2.2 The company value my ideas and opinions ... 48
4.3.2.3 Learning and skills development is encouraged at Hulamin ... 49
4.3.2.4 Individual performances (KPI) are linked to the business strategy ... 49
4.3.2.5 Knowledge is shared among employees ... 49
4.3.2.6 I received adequate training on my current position ... 49
4.3.2.7 Hulamin uses the performance measurement system to compensate and reward all its employees ... 50
4.3.2.8 Hulamin is the best employer ... 50
4.3.3 Customers Perspectives ... 50
4.3.3.1 I know my internal customer ... 52
4.3.3.2 I know my external customers ... 52
4.3.3.3 Hulamin is a customer focused organisation ... 53
4.3.3.4 My performance is measured based on customer satisfaction ... 53
4.3.3.5 I understand customer requirements ... 53
4.3.3.6 I understand customer satisfaction measures in place at Hulamin ... 53
vii
4.3.3.7 I understand customer satisfaction measures in place in my department ... 54
4.3.3.8 My department receives and communicates back customer feedback will all employees ... 54
4.3.3.9 I am satisfied with quality of product and service we give our customers. ... 54
4.3.3.10 My customers are satisfied with our service and product quality ... 54
4.3.4 Internal Business Processes Perspectives ... 55
4.3.4.1 My department processes are measured and are monitored ... 56
4.3.4.2 Deviations from processes are reported in my department ... 56
4.3.4.3 I understand process improvement initiatives... 57
4.3.4.4 Critical processes affecting your department are well defined. ... 57
4.3.4.5 Current process improvement initiatives are efficient ... 57
4.3.4.6 Operational processes (day to day activities) are flexible and innovative ... 57
4.3.4.7 I am happy with Hulamin Social processes e.g. Health and Safety, employee engagement and social activities ... 58
4.3.4.8 Hulamin promotes Research and Development ... 58
4.3.5 Financial Perspectives ... 58
4.3.5.1 Business financial performance is communicated to all employees by management . 60 4.3.5.2 Our department ‘s budgeting system is linked to the performance measurement system ... 60
4.3.5.3 Individual’s cost savings initiatives are evaluated during performance assessment ... 60
4.4 Reliability Results ... 62
4.4 Summary ... 64
CHAPTER 5: DISCUSSION ... 65
5.1 Introduction ... 65
5.2 Demographic ... 65
5.3 Study Objectives Results ... 66
5.3.1 Hulamin Performance Measurement and Evaluation System ... 66
5.3.2 The Impact of Learning, and Growth Perspective on Business Performance ... 67
5.3.3 To Evaluate Customer Satisfaction Management Systems Impact on Performance of a Manufacturing Company ... 68
5.3.4 To Determine the Impact of Business Processes on Business Performance ... 70
5.3.5 The Impact of Financial Perspective Business Performance ... 71
5.3.6 BSC attributes in a manufacturing company ... 73
5.4 Summary ... 73
Chapter 6: Conclusion... 75
6.1 Introduction ... 75
viii
6.2 Findings... 75
6.3 Recommendation ... 75
6.4 Study Limitation ... 76
6.5 Future Studies ... 76
References ... 77
List of Figures and Tables Table 1.1 Overall Hulamin business performance for year 2015 to 2019 ... 4
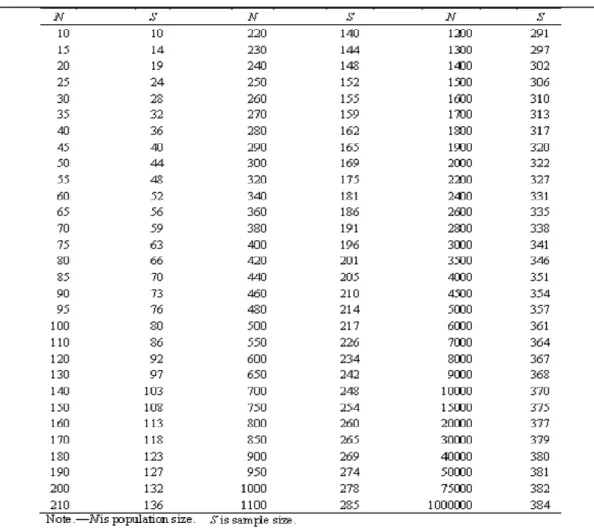
Table 3.1 Krejcie and Morgan Table ... 33
Table 3.2 Summary of Targeted Population, Sample and Sample Size ... 33
Table 4.1 Frequency Table for Demographic Data ... 41
Table 4.2 Descriptive Statistics ... 61
Table 4.3 Factor Loading Values ... 62
Table 4.4 Internal Reliability Measures for the Selected Factors ... 63
Figure 1.1 The Performance Measurement Process (Gawankar et al., 2015:7) ... 2
Figure 2.1 The Strategic Map developed by Kaplan and Norton (Kaplan, 2010:22) ... 13
Figure 2.2: The Balanced Score Card Pyramid (Soderberg, 2006:17) ... 14
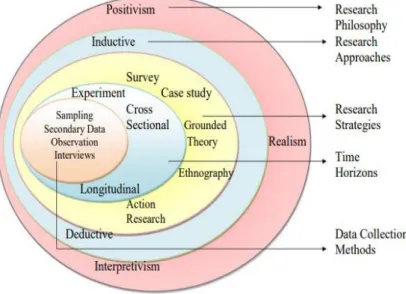
Figure 3.1 The research process onion (Saunders et al., 2003:83) ... 27
Figure 4.1 Sample Demographic Pie chart ... 39
Figure 4.2 Respondents Job Position Bar Graph ... 40
Figure 4.3 Respondents Department bar graph ... 40
Figure 4.4 Statements on Performance Management from Manufacturing ... 43
Figure 4.5 Statements on Performance Management from Marketing ... 43
Figure 4.6 Statements on Performance Management from Planning ... 44
Figure 4.7 Statements on Performance Management from Technical ... 44
Figure 4.8 Statements on Learning and Growth Perspective from Manufacturing ... 47
Figure 4.9 Statements on Learning and Growth Perspective from Marketing ... 47
Figure 4.10 Statements on Learning and Growth Perspective from Planning ... 48
Figure 4.11 Statements on Learning and Growth Perspective from Technical ... 48
Figure 4.12 Statements on Customer Perspectives from Manufacturing ... 51
Figure 4.13 Statements on Customer Perspectives from Marketing... 51
Figure 4.14 Statements on Customer Perspectives from Planning ... 52
Figure 4.15 Statements on Customer Perspectives from Technical ... 52
Figure 4.16 Statements on Internal Business Processes Perspectives from Manufacturing .... 55
Figure 4.17 Statements on Internal Business Processes Perspectives from Marketing ... 55
Figure 4.18 Statements on Internal Business Processes Perspectives from Planning ... 56
ix
Figure 4.19 Statements on Internal Business Processes Perspectives from Technical ... 56
Figure 4.20 Statements on Financial Perspectives from Manufacturing ... 58
Figure 4.21 Statements on Financial Perspectives from Marketing ... 59
Figure 4.22 Statements on Financial Perspectives from Planning ... 59
Figure 4.23 Statements on Financial Perspectives from Technical ... 59
Figure 4.24 The Scree Plot: Determining Number of Factors Based on Eigenvalues ... 62
APPENDICES ... 89
APPENDIX A: Gatekeeper’s Letter ... 89
APPENDIX B: Declaration For Questionnaire ... 90
APPENDIX C: Informed Consent Letter ... 91
APPENDIX D: Questionnaire ... 92
APPENDIX E: Ethical Clearance Certificate ... 96
1
CHAPTER 1: OVERVIEW OF THE STUDY 1.1 Introduction
In this economic changing world manufacturing companies are developing strategies that will sustain their businesses in the long run. Measuring performance allows the organisation to constantly monitor business activities to ensure that strategies become a reality. Beyond measuring performance, business performance must be evaluated to identify the organisation’s strength and weaknesses. This study evaluates business performance of Hulamin using the Kaplan and Norton Balanced Scorecard (BSC).
Chapter 1 is the introductory chapter which provides the study background, information on research site and research problem. Furthermore, this chapter outlines the research questions, study objectives and the outline of the whole dissertation. The main purpose of this chapter is to give a scope of this study.
1.2 Study Background
South Africa is a developing country facing many economic challenges including energy, old infrastructure, inefficient regulatory processes and government long-term strategic vision which hinders both local and international investments (Pollet, Staffell and Adamson, 2015).
South African manufacturing industry has also been deteriorating slowly over the last few years. The manufacturing industry contributed approximately 20% of the country’s GDP in 1994, in 2020 the GDP was approximately 14% (South African Market Insight, 2020).
Furthermore, the South African manufacturing sector has recently reported a further decrease of 5.4% of its production in March 2020 compared to March 2019, metal products being the biggest contributor to the drop (Statistics South Africa, 2020). Manufacturing industry utilises 80.8% of its capacity and the remaining 19.2% unused capacity is mainly as a result of low demand (South African Market Insight, 2020). Locally manufactured goods are in decline due to high competition, high manufacturing cost and unreliable power from Eskom (South African Market Insight, 2020).
Most companies are under pressure to meet the global trade standards hence, organisations are working on improving the quality of products and services, adopting new technology and are ensuring productive workforce (Hitt, Ireland and Hoskisson, 2007). The growing internationalisation of economic systems is also a concern because it has created a borderless global economy (Bailey, Mankind, Kelliher and Garavan, 2018). Globalisation has intensified the competition within the manufacturing sector.
Labour productivity has since remained unchanged from 2011 while the wages kept on increasing this has contributed negatively to most of the companies because they cannot be price competitive (Hanusch, 2019). A higher productivity rate seems to be higher in finance and construction, while agriculture, mining, and manufacturing are slowly declining (Hanusch, 2019).
2
South African manufacturing industry is not doing well. Adequate performance management system has become a necessity for the existing firms to find ways to strengthen their core competencies and improve their weaknesses in order to remain relevant and adapt in this challenging time.
Performance management allows the firm to find a solution on internal factors that hinders performance because the firm cannot change situation that arise from the external forces i.e.
politics, regulations and law, environment, technology and social factors. The ability of a business to measure performance is the most important enabler of achieving the set goals (Gawankar, Kamble and Raut, 2015). Measuring performance gives management feedback on objectives they have set and client satisfaction (Tan, Zhang and Khodaverdi, 2017). Figure 1.1 below shows the process of how performance should be measured.
Figure 1.1 The Performance Measurement Process (Gawankar et al., 2015:7)
According to Mihaela and Alexandru (2018), business performance is too subjective, and more factors must be considered. Large firms are now using the Kaplan and Norton BSC approach to evaluate financial and non-financial performance of the firm (Wheelen and Hunger, 2015).
Another main advantage of BSC is its use in the implementation of long-term strategies. BSC aligns business management processes in order to achieve the desired goals (Lavy, 2010).
Furthermore, the Balanced Scorecard perspectives give a holistic view of the organisation (Gawankar et al., 2015). The BSC is not a tool to measure performance only; it is also used as a change management strategic tool to align the organisational strategy across all departments and across all levels of employment. Measuring performance allows the organisation to look back at their previous and current decisions in order to determine the future goals that are
3
aligned with their strategies to ensure effective organisation (Lavy, 2010). The importance of measuring performance is as important as its evaluation. Evaluating performance should not be a waste of time but should be part of the strategy to ensure that objectives set are carried out efficiently and effectively to achieve the set goals.
1.3 Research Problem
The performance of manufacturing industry is very important in South Africa as it accommodates many unskilled and semi-skilled employees who are the source of income for many communities. The poor performance of manufacturing industry in South Africa has caused some of the firms to close down and this is compounded by the high number of labour related protests the country is experiencing. Furthermore, the competition from goods manufactured in China has intensified. Hulamin is also part of the manufacturing firms affected by the changes in the economy and trade globalisation. In 2019, Hulamin reported strong competition from the United States and China as the major threat to the company’s performance (JSE SENS, 2019). Therefore, firms must change their daily activities to sustain their businesses. Firms must monitor, measure, collect and analyse data and rectify poor performance to develop strategies that will not only improve profits but sustain business in a long term. Huang and Badurdeen (2017) proposed that performance evaluation must be mandatory across all levels in a manufacturing organisation to ensure sustainability in the long run.
This study has adopted Kaplan and Norton Balanced Scorecard (BSC) theoretical framework to evaluate performance at functional level in four departments at Hulamin. The BSC is the most popular strategic management model adopted by many organisations in developed countries. There is a good performance outcome of organisations in developed countries like Unites States, United Kingdom, Canada, Spain, China that have adopted BSC (Rafiq, Zhang, Yuan, Naz and Maqbool, 2020). Bain (2018) reported that about 57% companies were using BSC in 2004 and approximately 37% in 2017. However, the satisfaction level on companies using the BSC in 2017 was at the highest compared to previous years. Many organisations are still battling with BSC implementation and execution (Gowindasamy and Jantan, 2018).
ArcelorMittal South Africa (AMSA) is the largest steel manufacturer in South Africa which has been using the BSC system for the past eight years (de Jager, 2009). However, AMSA has encountered issues in executing BSC due to poor communication and implementation which has resulted in BSC to fail (de Jager, 2009). The BSC tool is used in this study because it is simple and integrate well financial and non-financial perspectives of performance. Moreover, BSC has successfully been widely used by large firms globally (Rafiq et al., 2020).
1.4 Study Site
Hulamin rolling operations based in Pietermaritzburg KwaZulu-Natal was targeted as a study site for this research. Hulamin is a manufacturing company based at Edendale within the city of Pietermaritzburg. It is the largest producer and supplier of semi-fabricated aluminium products in Sub-Saharan Africa. The company originated back in 1935 when it was a sales office of an aluminium company based in Canada (Hulamin, 2016) . In 1940 the company was registered as Aluminium Company of South Africa (ALCAN) which was followed by the
4
establishment of the first aluminium rolling mill in 1949 (Hulamin, 2016). In 1974 ALCAN merged with Hulett Corporation to form Tongaat Hulett aluminium (Hulamin, 2016). The restructuring of Tongaat Hulett aluminium in late 1990s resulted in addition of two shareholders Anglo American and the Industrial Development Corporation which caused Tongaat Hulett share-price to decrease by 50% (Hulamin, 2016). In 2007, the organisation was named Hulamin and was listed on the main board of JSE after it was unbundled from Tongaat Hulett Limited (Hulamin, 2016).
Hulamin has two major processes that the business is involved in, rolled products and extruded products. Rolling is the process of thickness reduction and extrusion is a multifaceted process that involves production that varies in output from yacht masts to window frames (Boulton, 1982). This study will only focus on the rolled products processes, as it constitutes approximately 90% of the overall business products.
Table 1.1 Shows published Hulamin business results from 2015 to 2019 Table 1.1 Overall Hulamin business performance for year 2015 to 2019
Source: Researcher’s own compilation data adapted from Hulamin’s annual financial reports from the year 2015 to 2019.
5 1.5 The Aim of the study
The aim of this study was to evaluate Hulamin’s business performance using the Balance Scorecard.
1.6 Research Objectives The study objectives were:
➢ To determine how Hulamin as a manufacturing company measures its performance.
➢ To determine the effectiveness of BSC attributes in a manufacturing company.
➢ To find out to what extent does learning and growth assist the business to perform better.
➢ To determine the impact of business processes on business performance.
➢ To evaluate customer satisfaction management systems impact on performance of a manufacturing company.
➢ To determine the impact of financial measures of performance on overall business performance.
1.7 Research Questions The research questions were:
➢ How does Hulamin measures business performance?
➢ What are the BSC’s attributes present in Hulamin’s performance management system?
➢ To what extent does learning and growth affect business performance?
➢ To what extend does the customer management systems in place influence business performance?
➢ How are the business processes managed in order to improve performance?
➢ What are Hulamin’s financial indicators of performance?
1.8 Significance of the Study
Hulamin is the largest manufacture of semi-fabricated aluminium in Africa and the largest employer within the manufacturing sector in Pietermaritzburg (Hulamin, 2020). The success of Hulamin means the success of the society within the Midland’s region which will contribute to the economy of KwaZulu-Natal and South Africa as a whole. This study explores employees’ perceptions on the overall performance of the company across all the business functional units using the BSC approach.
The study aims to contribute to the theory with the new knowledge pertaining measuring and evaluation of business performance in a South African context. Furthermore, this study will benefit the manufacturing firms to improve on business performance attributes that affect the overall performance of the firm.
The outcome of this study can assist Hulamin management evaluate the effectiveness of the current performance measurement and evaluation systems. Furthermore, Hulamin can formulate new strategies and set new business goals that will improve the performance of the company based on scientific data collected in this study. This can benefit Hulamin with highly
6
skilled employee turnover, high employee productivity, improved customer satisfaction and increased financial performance in future.
1.9 Format of the Dissertation
This study consists of six chapters which are outlined below:
1.9.1 Chapter 1: Overview of the Study
Chapter 1 outlines the summary of this research.
1.9.2 Chapter 2: Literature
Chapter 2 reviews published literature from different scholars. The literature review is based on performance measurement and evaluation systems. Furthermore, business strategy literature is briefly reviewed as it plays a major impact on overall performance outcome. The Kaplan and Norton’s Balance Scorecard is the theory underpinning this study and is reviewed in detail in this chapter.
1.9.3 Chapter 3: Research Methodology
Chapter 3 presents the research methodology which outlines the process this study followed, data collection and data analysis methods. This chapter also outlines the processes adopted to protect the organisation where the study was conducted and the participants privacy.
1.9.4 Chapter 4: Results Presentation
Chapter 4 presents the results collected from 187 respondents at Hulamin using questionnaires.
The chapter presents results in a form of tables and graphs and the analysis of results is also presented.
1.9.5 Chapter 5: Discussion
Chapter 5 is the discussion of results presented in chapter 4.
1.9.6 Chapter 6: Conclusion
Chapter 6 concludes the discussion of results and presents findings and recommendations.
1.10 Chapter Summary
Chapter 1 outlined the overview of the study and rational of the study. This chapter has introduced the background of the study, overview of the study site, problem statement, research questions and the research objectives. The methodology adopted for this study was briefly outlined together with the techniques used to collect and analyse data.
The next chapter (Chapter 2) outlines the reviewed literature.
7
CHAPTER 2: LITERATURE REVIEW 2.1 Introduction
The literature review objective is to resonate the study into context by showing how the research fits to the field (Somekh and Lewin, 2011). The literature review must accurately indicate a summary of different views, agreements, disagreements and trends about the phenomenon and must be acknowledged (Stilwell, 2000). The aim of this chapter is to review previous published research on the business performance measurement and evaluation systems.
According to Bhattacherjee (2012), the review of literature must serve three purposes: must find knowledge that abounds the phenomenon, unearth theories and authors related to the field of study, and must determine the gap in knowledge.
The literature presented in this chapter is organised into three sections. Section 2.2 defines and explains the importance of organisational performance including measuring and evaluating performance. This section explores different views from scholars in relation to the importance of the business to measure and evaluate its daily activities. Section 2.3 is a review of performance measurement and evaluation theories. Section 2.4 explores the literature related to the BSC. The history of BSC is explored in detail and the use of BSC as a performance measurement and evaluation system is also explored. Furthermore, section 2.4 gives a holistic view of BSC four perspectives. The key concepts that form literature presented in this chapter were drawn from the theories related to business performance, performance measurement and performance evaluation systems. The concepts related to the study objectives which also formed the literature of this study were used to construct the survey questionnaire.
2.2 Organisational Performance
Modern industries regard performance management as a critical activity because it determines long term business success (Richard, Devinney, Yip and Johnson, 2009). Business performance is mainly affected by competitive uncertainty, changing technology, changing consumers needs and new competition (Brown, 2011). Managing organisational performance in large firms becomes a challenge because spill overs that exist amongst different business units and within departments put managers in difficult positions where they must take decisions which are not aligned with the objectives of the firm (Bouwens, Hofmann and Van Lent, 2018). Hence, managers in complex manufacturing firms tend to focus on maximising productivity at the expense of the performance of the firm (Anderson, 2001). However, there are many other factors in a firm that result in failure of performance management systems other than business complexity and external factors highlighted by Brown (2011). According to Bourne, Neely, Platts and Mills (2002), approximately 70% of performance management systems fail due to the following reasons:
• Poor leadership
• Resistance to change
• No perceived benefits
• Fear of consequences of performance outcome
8
There are different methods and approaches that have successfully been used to measure and evaluate business performance these include: financial performance, stakeholder theories, Resource based capabilities, IT capabilities, Balanced Scorecard etc. The traditional performance measurement systems were mainly based on financial performance and excluded non-financial measures. The non-financial measures identify measures that indicate how management can have full control of the business (Chytasa, Glykasb and Valiris, 2011). Hence, measuring non-financial measures is as important as measurements of financial measures.
2.2.1 Performance Measurement
Performance measurement systems are implemented to document and make informed decisions (Gowindasamy and Jantan, 2018). The system gives details about the past actions of the company which assist to derive strategic actions. According to Marshall (2002), the main purpose of measuring performance is to look back, look ahead, roll up, cascade down, compare, compensate and motivate. Performance measurement is a system of monitoring daily operations in accordance with the firm’s strategic objectives (Wu, Tzeng and Chen, 2009).
Furthermore, performance measurement system involves setting daily targets, monitoring internal processes and collecting data for the purpose of identifying key indicators of performance (Gowindasamy and Jantan, 2018). According to Kaplan (2010), firms cannot evaluate what they cannot measure. Hence, intangible assets must be converted into scientific numbers to ensure that results are reliable and will help managers to make informed decisions based on performance measures (Kaplan, 2010). Performance measures are used to monitor, manage and improve business competitiveness (Gomes, Jabbour, Adriana and Charbel, 2011).
Therefore, performance measures must be clearly defined prior to integrating dimensions of performance.
The Key Performance Indicators (KPIs) of the firm and control systems determine what the business should measure (Richard et al., 2009). A good performance measurement system must address how the existing systems will be improved and how organisation’s objectives will be aligned with the individual performance measurements and objectives (Gowindasamy and Jantan, 2018). Therefore, the firm’s internal performance measurement system affects each individual and the organisation’s effectiveness. The role of performance measurement system is to improve organisational effectiveness (Gowindasamy and Jantan, 2018). Business performance is a subset of organisational effectiveness, which incorporates operational performance and financial results. Organisational performance indicates business effectiveness, which is the firm’s ability to achieve its mission (Gowindasamy and Jantan, 2018) (Mahmudi, 2005). Therefore, organisational effectiveness is an important component of performance because its influence has a greatest impact on overall performance (Ozcan, 2008).
An adequate business performance measurement system should encourage a cooperative functioning of the firm’s business units. Performance measurement systems must be applied from the lower level of the organisation throughout all departments to ensure that they are functional because functional strategies are the foundation of the business strategy (Williams, Souza, Derrick, Rosenfeldt and Martin, 1995). Organisations now adopt extensive measurement systems which incorporates both objective and subjective measures to improve
9
business performance (Van der Stede, Chow and Lin, 2006). This approach is also known as Contemporary Performance Measurements (CPM) which advocates both financial and non- financial measures (Van der Stede et al., 2006). The CPM system is more relevant now with high competition, advanced manufacturing practices, new technology and flexibility (Van der Stede et al., 2006).
Measuring performance does not guarantee improved performance (Gawankar et al., 2015).
Furthermore, measuring performance comes at a high cost because it must be implemented, maintained and affects the processes’ productivity and delays operations (Gawankar et al., 2015). Despite costs and production delays associated with the implementation of performance measurement systems, measuring performance has a positive effect on overall business performance. Measuring performance benefits the company positively because it minimises risk of a firm from not satisfying its stakeholders and achieving set objectives (Gawankar et al., 2015). Measuring performance eases strategy implementation and improves organisational performance.
2.2.2 Performance Evaluation
Performance evaluation is a management tool used to control the systems and resources for the purpose of aligning the strategy with the business operations (Evans, Ashworth, Chellew, Davidson and Towers, 1996). Performance evaluation is monitoring of organisation’s set goals achieved in a specified period (Wu et al., 2009). Wheelen and Hunger (2015) define performance evaluation as a completion phase of chronological phases of strategic Management System (SMS), where the business strategy is being evaluated and monitored after execution. Moreover, performance evaluation is a comparison of achieved performance of corporate activities with set goals and taking actions to resolve problems where needed (Wheelen and Hunger, 2015). Rue and Byars (2005) view performance evaluation at an individual level, as a revelation of an employee’s understanding of their own work and triggers actionable findings and continuous improvement.
According to Wu et al. (2009), successful firms have a clear vision, positive action and adequate performance evaluation system. Evaluating performance allows managers to adjust formulated strategy (Wheelen and Hunger, 2015). When evaluating performance, the time frame (comparison between past and present duration interval) and reference point (competitors, target, past performance) are important factors to consider (Richard et al., 2009).
Therefore, it is crucial that business measurement system is adequate and managers receive proper feedback from the firm’s daily activities to ensure actions taken post performance evaluation will benefit the firm in a long term.
2.3 Performance Measurement and Evaluation Theories
There are many theories articulated by researchers relating to how performance should be measured and evaluated. According to Mihaela and Alexandru (2018), many factors must be considered when evaluating performance like income cash flow, research and development expenses, employee satisfaction, social responsibility because business performance is complex and subjective.
10
Different approaches have been used to evaluate performance these include but not limited to ratio analysis, total production analysis, regression analysis, Delphi analysis, Balanced Scorecard (BSC), Analytic Hierarchical Process (AHP), Data Envelopment Analysis (DEA) (Wu et al., 2009). However, the recent researchers have shown a high interest on Social responsibility, BSC and stakeholders’ theories which are reviewed below. These theories are very important bases for measures of performance in manufacturing. However, they are biased because they only relate to non-financial aspects of performance unlike the BSC which gives the holistic view of the firm’s performance by measuring both financial and non-financial aspects of performance. Furthermore, the BSC aligns the performance attributes with the organisation’s strategy.
2.3.1 The Social Responsibility Theory
Santos and Brito (2012) proposed a subjective model to measure the firm’s performance which incorporates social performance and environmental performance in addition to profitability, growth, customer satisfaction and employee satisfaction. Social and environmental performance activities of the company such as product quality and safety, employment of disadvantaged individuals and community projects gives satisfaction to the community and government (Santos and Brito, 2012).
Social responsibility theory proposes a corporate’s responsibility beyond profit maximisation (Wheelen and Hunger, 2015). The corporate social responsibility theory was also developed to respond to the unprecedented emergence of global warming (Richard et al., 2009). Friedman (2007) study disagreed with the corporate social responsibility theory. According to Friedman (2007), the business primary goal is to make profit and not to spend stockholder’s money on social interests. Therefore, social responsibility becomes an ethical act a business embarks on to benefit the society.
Investors are recognising how the firms manage sustainability of natural resources on their business performance results (Bonner, 2014). Sustainability report indicates how the company manages its impact on environment and the role it plays to the global society to ensure sustainability of natural resources (Bonner, 2014). Manufacturing firms projecting good environmental corporate responsibility results attract investors to invest on projects that sustain the natural resources consequently improving corporate financial performance (Testa and D’Amato, 2017). Therefore, South African manufacturing firms trading at international and global level must incorporate social responsibility factors on their performance measurement methods because they affect the image of the firm and future possibilities of investments. The social responsibility theory was not used in this study to evaluate performance because its focuses on the environment and social needs more than business daily activities that have the biggest impact on overall performance. However, Ardito and Dangelico (2018) argue that a firm’s contribution to the environment is an important strategic factor that will make a firm stand-alone among rivals.
2.3.2 Resource Based Theory
The findings on a firm’s performance study conducted between Apple, Microsoft and Google revealed that business core competencies give the firm the greatest competitive advantage to
11
perform better financially (Mihaela, 2017). The shortage of technical skills in South Africa affects the competitiveness of manufacturing firms against global manufacturing rivals (Madonsela, Mbecke and Mbohwa, 2013). Manufacturers globally reported talent as the main driver of manufacturing competitiveness (Deloitte, 2016). Skills and competency of employees in a firm determine the company’s competitiveness and consequently affect the business performance and the country’s economy. A core competence in the form of a resource or capability can provide stability to an organisation and make organisational growth possible (Hindle, 2008). According to Bharadwaj (2000), the adoption of resource-based view framework will provide competitive advantage to the firm, this framework links information technology capability as an enhancer to the performance. Therefore, resource-based theory suggests that the firm’s resources determine the firm’s capability to achieve greatest performance.
According to Todorov (2020), the international competitiveness of the manufacturing sector is mainly determined by the technological capabilities and knowledge for new product developments. The transition to the fourth industrial revolution is no longer a hype in manufacturing industry but an urgent need that must be attended to (Ghobakhloo, 2018). The fourth industrial revolution will present new business opportunities and disrupt the global community in terms of communication, behaviour and how they relate with the environment (Ross and Maynard, 2021). The new technologies such as Artificial Intelligence (AI), Internet of Things (IoT) and autonomous vehicles have influenced many organisations and employees to change and adapt in many countries (Ross and Maynard, 2021).
Manufacturing industry has a major challenge to adapt and explore new business opportunities that arise with the fourth industrial revolution. South African manufacturing industry does not have sufficient infrastructure to improve its competitiveness to compete globally (Madonsela et al., 2013). South African manufacturing sector’s competitiveness can be improved by adequate implementation of Information and Communication Technology (ICT) which will improve internal business processes by delivering products of high value that will ensure customer expectations are met (Madonsela et al., 2013). The resource-based view theory evaluates the firm’s strengths and capabilities to compete with the rivals to improve customer satisfaction and business financial performance.
2.3.3 The Stakeholders Theory
According to Santos and Brito (2012), stakeholders’ theory is part of the firm’s social responsibility. Stakeholders’ theory measures a firm’s performance based on stakeholders’
satisfaction level (Santos and Brito, 2012). Stakeholders’ theory defines the expectations of each stakeholder before defining the business strategy (Kaplan, 2010). A stakeholder is anyone that benefits directly (internal stakeholders) or indirectly (external stakeholders) from the firm’s activities (Santos and Brito, 2012). The stakeholders’ theory incorporates people who have an impact on the business functionality either inside (shareholders, customers and communities,) or outside the organisation (suppliers and employees) (Kaplan, 2010).
According to Atkinson, Waterhouse, and Wells (1997), these individuals have their views and expectations of how the firm should perform.
12
The internal stakeholders contribute to daily activities i.e. planning, designing, and distributing goods and services to the customers, whereas the external stakeholders do not contribute to the firm’s daily activities but generally tend to have psychological contracts with the organisation (Kaplan, 2010). A business that does not fulfil either of the three stakeholder; customers, employees and shareholders will suffer in the long run (Yeung and Berman, 1997). The important groups like shareholders and employees must be prioritised because it can be impossible for a company to please all the stakeholders (Clarkson, 1995).
Organisations tend to focus on the expectations of a single stakeholder i.e., shareholders and ignore the primary stakeholders (suppliers and customers) which have been proven to have the greatest impact on Return On Assets (ROA) and Earnings-Per-Share (EPS) (Richard et al., 2009). Some authors have combined the stakeholder and shareholder theories with the aim to recognise the firm’s corporate responsibility (Mihaela, 2017). The relevance of stakeholders can be seen at both organisational and country level. European countries organisations predominantly consider stakeholders interest of employees, partners, NGOs, and society (Dore, 2000). Adopting the stakeholders’ approach to measure and evaluate business performance may is highly likely to omit important attributes that affect performance because some stakeholders are prioritised more than others. It is evident that the stakeholders’ theory lacks to find a balance across internal and external stakeholders.
The government can be the most influential external stakeholder on business performance.
According to the UNIDO’s annual Competitive Industrial Performance (CIP) Index, the five best performing countries are Germany, China, the Republic of Korea, the United States and Japan (Todorov, 2020). Moreover, China and India secured the first and eleventh position on the 2016 Global Manufacturing Competitiveness Index respectively (Deloitte, 2016). Deloitte (2016) reported that China based companies indicated that they receive enormous support from their government on science, technology and innovation. This indicates the impact government has on the business performance and competitiveness. The founder of World Economic Forum Professor Klaus Schwab raised concerns over inequality and society fragmentation because of governments failing to adapt to the new fourth industrial revolution (World Economic Forum, 2016). The South African manufacturing industry has a challenge to adapt to the global standards in order to be competitive on cost of goods and capabilities. Therefore, external stakeholders like government tend to have a direct impact to the firm’s competitiveness and consequently have impact on the business overall performance.
Santos and Brito (2012) measured firm’s performance based on stakeholders’ theory and results indicated that stakeholders have different business interests on the firm which must be managed independently. The stakeholders’ theory defines the needs of the business stakeholders prior to defining the business needs that will improve business competitiveness and business performance. Managing different needs of stakeholders can compromise business strategy and business performance. Moreover, unlike the BSC approach the stakeholder theory does not incorporate the internal business processes which have the greatest impact on customer satisfaction.
13 2.3.4 The BSC Approach
BSC caters for the three main stakeholders: customers, employees and shareholders. The behaviour and attitude of these stakeholders have casual linkages because an employee behaviour affects customer satisfaction which plays a significant role on shareholders returns and shareholders themselves affect employee satisfaction (Yeung and Berman, 1997). This casual linkage is demonstrated on Kaplan and Norton’s strategic map on Figure 2.1 below.
Figure 2.1 The Strategic Map developed by Kaplan and Norton (Kaplan, 2010:22) BSC is an unbiased tool as it evaluates both financial and non-financial perspectives of managerial activities (Chimtengo, Mkandawire and Hanif, 2016). The BSC’s main objective is to measure strategic objectives, integrate and manage business strategy (Kaplan and Norton, 2001). The strategic map demonstrates how the business strategy is defined by linking the objectives derived from the BSC four perspectives to the overall business strategy (Kaplan and Norton, 2004). The BSC approach assists organisations to improve and invest on their systems, employees and processes in order to produce innovative products and distinctive value proposition (Phillips and Louvieris, 2005) (Karabulalut, 2015). Therefore, the BSC framework assists managers to navigate to a more competitive and sustainable environment.
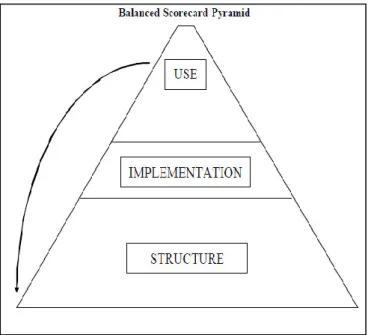
The BSC function is more than measuring performance. BSC should be used to manage the business by ensuring that all strategic goals appear in Key Indicators of Performance including employee’s performance (Othman, Khairy, Domil, Senik, Nor Liza, Abdullah and Hamzah 2006). Davis and Albright (2004) refer to the BSC as a complete and adequate tool used to plan and control organisational activities and evaluate performance. A performance measurement system must have these attributes to be considered a Balanced Scorecard; the measures must be derived from the business unit strategy, there must be a balance amongst the measures and measures must be linked in a series of cause-effect relationship (Soderberg, 2006). Soderberg
14
(2006) examined a BSC pyramid to describe the BSC framework as indicated on Figure 2.2 below. The pyramid framework describes BSC as strategic management system function in three aspects: structure, implementation, and use.
Figure 2.2: The Balanced Score Card Pyramid (Soderberg, 2006:17) Structure: The BSC has three unique features:
• Derivation of performance measures from the strategy: all performance measures are linked to the business overall strategy to ensure that there is an alignment between management and the functioning of business units (Soderberg, 2006). Strategies at functional level should be the foundation of business strategies and must all be aligned with marketing orientation to achieve desired performance (Williams et al., 1995) (Miles and Arnold, 1991). BSC tool enables the organisation to find relevant performance measures prior to implementing strategy with the aim of developing balanced strategies (Norreklit, 2000) (Othman et al., 2006).
• Striking a balance among all persperctives: the four perspectives are balanced they work together to give direction to management on what to do and where to focus in order to achieve the objectives (Soderberg, 2006). The BSC is the most suitable performance measurement tool because it consists of a set of balanced performance indicators that are linked to the business strategy to ensure that all stakeholder needs are met and fulfilled (Quesado, Guzmán and Rodrigues, 2008). Gowindasamy and Jantan (2018) disagreed with Kaplan and Norton’s philosophy of treating all four perspectives of BSC as equal, because some measures have a greater impact on performance more than other measures.
• Casual linkage among the perspectives: BSC perspectives cause (leading indicators) and effect (lagging indicators) relationship ensures correct activities are measured on a daily basis (Soderberg, 2006). This means measures in all perspectives are linked to ensure alignment with the set objectives. The BSC framework starts at the bottom level
15
with learning and growth which improves the internal business processes in order to satisfy customers with the aim of getting higher profits margins (Karabulalut, 2015).
According to Kaplan (2010), the BSC model was developed to integrate the quality and lean management, the financial performance and stakeholders’ theories for the purpose of obtaining a robust performance measurement and management system.
Implementation: The BSC tool allows organisations to implement and execute business strategy and evaluate implemented measures of performance (Wheelen and Hunger, 2015). A successfully implemented BSC will positively benefit the firm by effective teamwork, better strategic thinking and promoting a learning organisation (Kaplan and Norton, 2001).
Chimtengo et al. (2016) also emphasised the benefits of adequately implementing the BSC because it brings the desired results and enables creation and adaptation of new culture. BSC must be aligned with the organisation culture and technology upon its implementation (Chimtengo et al., 2016). Furthermore, management must have a buy-in from across all departments and must ensure full participation of employees for BSC to be successful.
BSC implementation success also depends on human relation norms and the culture of the country (Othman et al., 2006). Therefore, organisation culture and a buy-in from employees must always be considered when implementing BSC because they all play a significant role.
When implementing the BSC, organisations should consider the history of the organisation and management style of introducing new techniques (Othman et al., 2006). Organisation’s management practice might clash with the organisation’s strategy upon implementing BSC (Norreklit, 2000). BSC implementation does not guarantee positive performance. However, the success of BSC implementation and employee commitment towards BSC can guarantee positive performance (Amaratunga, Baldry and Sarshan, 2001).
Use: The use of BSC involves planning and control and strategy execution. Kaplan and Norton (1992) designed BSC to be used by companies as a communication tool, information sharing and learning system tool. The BSC has widely been used to communicate, integrate and measure performance in order to continuously improve and develop business processes and systems that are aligned with strategic goals of the business (Kopecka, 2015). The use of the BSC as a strategy communication tool creates a point of reference for all individuals in an organisation (Rafiq et al., 2020). Kaplan and Norton (2001) also refer to BSC as a change management strategic tool.
2.3.4.1 The Evolution of Balanced Scorecard
The Balanced Scorecard has evolved into three generations from when it was developed in the early 1990s (Gowindasamy and Jantan, 2018).
➢ Early-1990s Balanced Scorecard for Performance Measurement
BSC was developed by David Norton, the CEO of Nolan Norton Institute, and Robert Kaplan, a professor at Harvard University (Wu et al., 2009). According to Kaplan (2010), the BSC was first introduced in 1992 when Norton and Kaplan wrote a Harvard business review research article of a multi-company to study performance measures of how the intangible assets can be integrated into management system together. Firms
16
were at this point struggling on which perspectives to measure and how to measure them (Gowindasamy and Jantan, 2018). This led to the introduction of strategic objectives, where each perspective measure has its own objectives which are mapped for better alignment and measurement (Kaplan and Norton, 1993). The BSC was developed to incorporate non-financial and financial measures of performance so that business performance is balanced.
➢ Mid - 1990s Strategic Objectives and Strategy Maps
The BSC strategic map was used to align the performance measures with the firm’s strategic objectives to overcome critics over its lack of support at lower levels of the organisation (Gowindasamy and Jantan, 2018). The strategic map shows the cause and effect of each perspective to the overall business performance in a sequential manner (Kaplan and Norton, 1996). The BSC four perspectives are cross-functional dimensions of performance that assist the business to take decisions related to the transformation of business strategies into a reality (Kaplan and Norton, 2001).
➢ Early – 2000s The Strategy Management System
The BSC was transformed from being a performance measurement system to a strategic communication tool (Kaplan and Norton, 2001). The use of BSC to implement and communicate business strategy was to ensure that all employees across the organisation understand the objectives and measurement systems to be used in order to achieve the set company’s objectives (Gowindasamy and Jantan, 2018). The Kaplan and Norton’s Balance Scorecard amendments in 2001 revealed that the strategy formulation is as equal as its implementation (Kopecka, 2015). The amendments revealed how the BSC is used to align key strategic processes with the overall business strategy. This led to a proposal of five vital strategy implementation processes: planning of operations, monitoring, learning, testing and adaptation of strategy (Kaplan and Norton, 2008). The aim was to link strategy implementation and communication throughout the organisation for a successful strategy execution process and to help create a strategy focused organisation (SFO) (Kopecka, 2015).
2.3.4.2 The BSC Shortfall
BSC processes must be adopted like any other performance management initiatives and failure to follow these processes will affect BSC effectiveness (Othman et al., 2006). Gowindasamy and Jantan (2018) study indicated six barriers of BSC implementation:
➢ limited understanding of the Balanced Scorecard,
➢ lack of executive participant,
➢ lack of training and education,
➢ poor strategy formulation,
➢ not involving all the employees
➢ inadequate KPIs.
BSC has also been criticised for lacking rooting in the external environment including competitor’s behaviour (Norreklit, 2000) (Othman et al., 2006). Othman et al., (2006)
17
suggested that BSC must be completed with other strategic performance management techniques like PSTEL to link the strategy to the external environment. Chytasa et al. (2011) proposed a Proactive Balanced Scorecard methodology (PBSCM) to be used during development and implementation of BSC to address the feedback loops for better decision making.
More authors have integrated BSC with other theories to develop strategic measurement systems and to customise their performance management system according to their business needs. Rothaermel (2017) developed a model which integrated the BSC with triple bottom line and included accounting measures i.e. profitability, shareholder value and economic value to develop a firm’s performance model. The study by Saeidi1, Sofian, Saeidi2, Saeidi3 and Saaeidi (2015) is also in agreement with collaboration of BSC with triple bottom line framework as the most suitable tool to achieve superior firm performance.
Hansen and Schaltegger (2016) integrated BSC with sustainability theory and developed SBSC framework which can be used to integrate strategy with sustainability. IMECS (2009) developed a performance evaluation model which integrates BSC with Corporate Social Responsibility (CSR) this framework analyses the firms’ social responsibility and sustainability in addition to BSC perspectives. Therefore, BSC may have shortfalls that can be addressed by integrating BSC with other performance measurement theories.
2.3.4.3 Advantages of BSC
The BSC tool has many advantages which include:
➢ The capability to transform daily activities to strategic concept which will ensure sustainability in a long term. Consequently, overcoming performance measurement weaknesses and vagueness (Gawankar et al., 2015).
➢ The ability to enable the businesses to select relevant processes by reducing number of metrics that companies use to measure performance and develop more meaningful measures which create a balance with non-financial metrics (Yeung and Berman, 1997).
➢ The usage of data and facts to measure and evaluate performance whistle improving performance (Gawankar et al., 2015).
➢ The ability to integrate internal concerns with external concerns to fulfil external requirements and achieve strategic goals (Gawankar et al., 2015).
➢ The emphasis of business strategy and ensures mutual understanding of strategy across the organisation (Hasan and Tibbits, 2000).
2.4 The BSC As a Performance Measurement Tool
The reasoning behind BSC approach is finding balanced strategies between financial and non- financial perspectives through lead and laggard measures to transform vision into clear and doable performance measures (Othman et al., 2006). According to Thanaraksakul and Phruksaphanrat (2009), BSC defines long term strategic objectives and the mechanism for achieving and obtaining feedback regarding those objectives by resembling performance measurement system translated directly from the strategy. The BSC measures both financial and non-financial performances and has four widely known perspectives namely: financial,
18
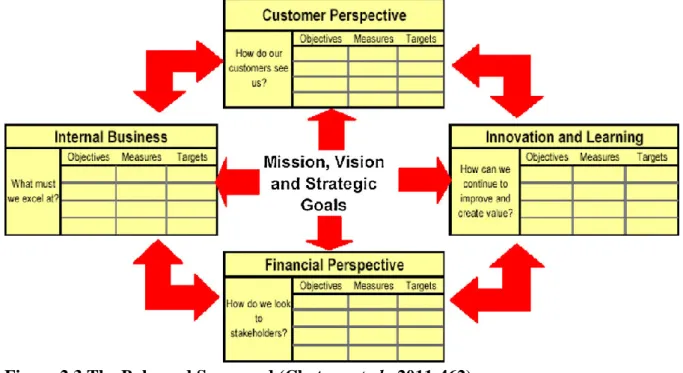
customer, internal processes, and learning and growth perspective (Wheelen and Hunger, 2015).
Figure 2.3 The Balanced Scorecard (Chytasa et al., 2011:462) 2.4.1 BSC and Strategy
Strategy is the plan to give direction which the company must take while matching external opportunities with internal capabilities (Hough, Thompson, Strickland and Gamble, 2011).
Strategy begins with manager’s views and conclusions about the company’s direction (Hough et al., 2011). Michael Porter defines strategic approaches as low-cost provider, differentiation, niche focus and unique capabilities (Hough et al., 2011). Companies adopt one of the Michael Porter’s strategies like Walmart adopted a low-cost approach while Armani and Ferragamo adopted a niche focused approach which is price-insensitive (Kaplan, 2010).
A well-defined strategy has a positive effect on business performance (Wheelen and Hunger, 2015). Management set objectives in order to convert strategic vision into measurable performance targets which each individual commits to for the mutual purpose of achieving the business goal (Hough et al., 2011). Performance evaluation systems are designed during strategy implementation after the strategy has been formulated (David, 2011). Performance evaluation gives management an understanding of overall firm’s performance (David, 2011).
Furthermore, evaluating how the strategy performed ensures that internal capabilities and core competencies are strengthened for the business to withstand against threats and exploits opportunities (David, 2011). Strategies can always change after evaluation. A gap in performance, where the business is not achieving its financial goals is one of the main events that usually triggers management to review strategy (Wheelen and Hunger, 2015).
A firm’s position and clearly articulated strategy contribution to sustainable environment is one of the greatest competitive advantages of the firm (Rafiq et al., 2020). Therefore, businesses must put more effort on sustainable and distinct strategies to improve performance
19
and remain competitive (Rafiq et al., 2020). However, formulating good strategies does not determine business success, great performance is achieved by the firm’s ability to obtain strategic alignment between organisation’s environment, strategy, structure and processes (Wheelen and Hunger, 2015). According to the Strategic Management System (SMS) theory, business survival is based on content-oriented approach which focuses on the long term strategic decisions and process-oriented approach which determines strategies to be selected and when to be used (Rafiq et al., 2020).
The BSC strategic map is a representative of what Kaplan and Norton believed is a fundamental measurement and evaluation system of performance (Othman et al., 2006). The introduction of BSC was a breakthrough of traditional methods. The traditional performance measures were not linked to the business strategy, inflexible and not aligned with continuous improvement initiatives (Chimtengo et al., 2016). The BSC approach measures the non-financial metrics to complement the traditional performance measures i.e. financial metrics (Kaplan, 2010).
The Balance Scorecard first defines the business strategy then integrates the performance indicator’s objectives to be aligned with the strategy (Kaplan and Norton, 2001). Kaplan and Norton’s BSC framework is in agreement with Chandler (1977) articulation that structure must always follow business strategy. This meant restructuring and planning will be determined by strategy to ensure that business resources are allocated adequately to achieve the desired business goals. The BSC’s ability to translate business strategy to measurable objectives makes it an efficient tool to be used at both operational and strategic levels (Chimtengo et al., 2016).
BSC translates strategic ideas to operational activities and links business strategy to the business overall performance (Karabulalut, 2015). Therefore, BSC requires an organisation to have a well-defined strategy to ensure it is implemented successfully and benefits the company.
To reinforce a strategy focused organisation, business strategy must be communicated to all employees to ensure daily activities are conducted in a way that will benefit the organisation in a long run (Kaplan and Norton, 2001). Kaplan and Norton (2001) suggested the five principles of a strategy focused organisation, namely:
➢ Translation of the strategy to operational terms: Organisation must create a point of reference by translating the strategy to meaningful objectives and develop strategy maps to identify critical measures and actions.
➢ Alignment of the organisation to the strategy: Strategy focused organisation align the business units by linking individual strategies to the main business strategy. Usually companies have individual specialised sectors or departments which have their goals and objectives which becomes difficult to communicate and implement performance initiatives. Kaplan and Norton (2001) further addressed the need to align employees’
functions and shared service units with service agreements between each functional unit.