Power Line Communications (PLC) is a recent and rapidly developing technology, which aims to use the electricity power lines for the transmission of data. The results of this work show that the power line technology can be used as a communication channel for urban areas and rapidly developing rural areas.
Rural Telecommunication .................................................................. l
Power networks have been shown to have sufficient bandwidth for communication at any data transfer rate [1,8 -10]. In addition, in developing countries, the power grid is well established, and where the grid is not available, it can be implemented because electricity has been shown to be a basic requirement for development.

Why Power Lines for Communication
The second moment of the non-stationary process, that is, the average power of the transfer function, will be denoted by. The reason for using the conductive coupling method was that at the time of the measurements a number of inductive coupling components were not available (namely the ferrite rings).
The Power Line Carriers Systems as used by Energy Industries
What is a Power Line Carrier?
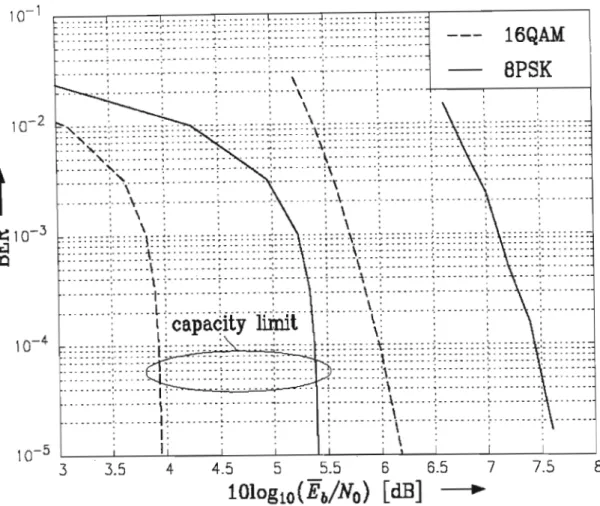
Figure 6.6 compares the bit error rates (BER) for coherent transmission using 16QAM and 8PSK for a target rate of 2.0 bits/symbol. 16] Zimmermann, M.; Dostert, K.: ''The low voltage power distribution network as Last Mile Access Network - Signal propagation and noise scenario in the HF area";.
![Figure 1.3: Block Diagram of Power Line Carrier System Coupled phase to ground on a Single 3 Phase Line (Eskom Transmission [7])](https://thumb-ap.123doks.com/thumbv2/pubpdfnet/10644040.0/26.834.164.648.240.573/figure-block-diagram-power-carrier-coupled-single-transmission.webp)
Description of a PLCS
The Power Line Carrier Unit ..................................................... .1 0
For explanatory purposes, certain aspects of the Siemens ESB 400 PLC will be described. The simple block diagram in Figure 1.5 illustrates the interconnection of the transmitter (Tx) and receiver (Rx) units.
![Figure 1.4: Subdivision of the 4 kHz channel (Eskom Transmission [7])](https://thumb-ap.123doks.com/thumbv2/pubpdfnet/10644040.0/27.834.123.670.471.768/figure-1-4-subdivision-khz-channel-eskom-transmission.webp)
ProjectObjective
Overall, from the standpoint of increasing operational efficiency and improving customer service, it is clear that lCT is a strong competitive factor for tomorrow's energy and power industry, as it is for today's telecom industry [70].
Dissertation Structure
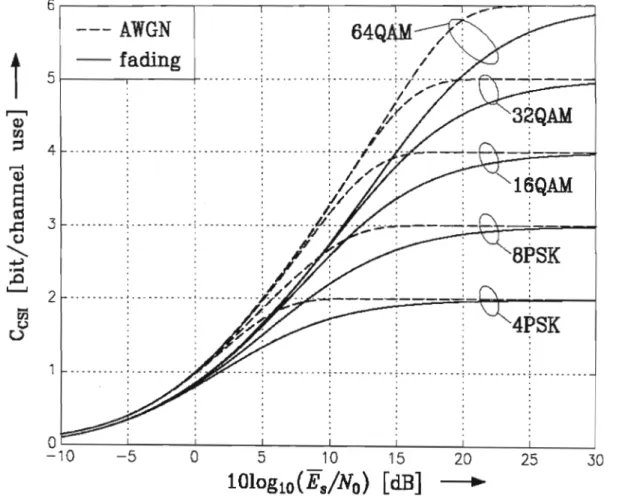
The fading channel model introduced earlier in this chapter is applied and channel state information (CSI) is assumed to be available at the receiver end, i.e. the channel gain and phase are known. In this case, at least from the information theoretic point of view, the dependence between successive channel states, i.e. the channel memory, is of no importance.
COMPARISON OF WIRELINE TECHNIQUES .•.•.•
Wire Line Communication
This situation caused problems, not only because of the frequencies involved, but also because anyone could listen to the traffic. The problem by proposing to rent the relevant frequencies from their owners and offer amateur radio operators a new frequency. If the · coherence bandwidth of the power line channel is negligible compared to the interlaced. The software provided allowed the user to determine or measure the throughput variation using different adapters provided by Ascom (i.e. the 1.5 Mbps and the 4.5 Mbps Ascom adapters).
The available signal of the power line on the right side of the coupling capacitor is very low. The electrical connection of the signal cable is a simple current loop connected to the appropriate terminals of the power supply unit.
Integrated Services Digital Network - ISDN
Digital Subscriber Line - DSL
- Asymmetrical DSL
- Symmetrical DSL
- Very High Bit Rate DSL
Cable TV Data
A "cable modem" is a device that allows high-speed data access (such as to the Internet) via a cable TV network. A cable modem will typically have two connections, one to the cable wall jack and the other to a computer (computer).
Power Line Communication
The length of time of the OFDM symbol is equal to the reciprocal of the sub. Now the long-term time variation of the power line channel must also be taken into account. In the same place, the signal is injected into the school's power grid with an Indoor Master.
![Figure 2.2: Noise Power Spectrum Density in good weather (left) and foul weather (right) (Eskom Transmission [7])](https://thumb-ap.123doks.com/thumbv2/pubpdfnet/10644040.0/45.834.102.709.153.603/figure-noise-power-spectrum-density-weather-weather-transmission.webp)
Comparison Between Various Technologies
Low-Voltage and Medium-Voltage Architectures
Most early implementations of PLC access technology placed the main gateway in place of a low-voltage transformer. An alternative to low-voltage architectures is the relocation of main station transitions to a location in the substation on medium-voltage lines. Although the low-voltage architecture provided a safe environment for the early development of PLCs, Gartner Dataquest doubts whether it can support the development of PLCs into large-scale business models worldwide [64].
International Trials
Although the low-voltage architecture provided a safe environment for the early development of PLCs, Gartner Dataquest doubts whether it can support the development of PLCs into large-scale business models worldwide [64]. problem by proposing to lease the frequencies in question from their owners and offering radio amateurs a new frequency. EnBW is one of a consortium of energy companies committed to the use of power line technology, which allows voice and data to be sent in both directions over power lines at speeds of up to 1M bits per second. The device is connected to a box attached to the house's electric meter, which converts the signals and sends them along the power line.
Domestic Trials
- ASCOM Power Line Communication
- Main.Net
- Inovatech
- Other Trials
Tshwane and Eskom have launched some PLC pilots in South Africa over the past two years. All three pilot systems have been successfully implemented, and future pilot systems with Sumitomo, Ambient and others will also be investigated. In 2002/2003, Tshwane successfully implemented and tested the ASCOM PLC system at various locations.
Market Differences By Region
- Europe
- North America
- AsialPacific and Japan
- Latin America
The business case for a PLC for data-only use - the use that makes up most of the mass broadband market - is harder to make than in Europe. Power grid topology is a greater challenge for PLCs in North America than in Europe. However, in the long term, North America could represent a significant part of the global PLC market.
Regulations and Applications
- Power Line As an Antenna
- Why was HF used in BPL
- Radio Communication Issues
- Federal Communications Commission
- Europe .............................................. "
- Europe Conference of Postal and Telecommunication
- European Telecommunication Standards Institute (ETSI)
- International E1ectrotechnical Commission (IEC)
- International Special Committee on Radio Interference (CISPR)
This noise can have a high harmonic content related to the switching frequency of the supply. It is clear that the fluctuations in the curve are due to the relatively small data base available. With differential coding, information is transmitted in the transitions of the input symbols of channel x.
CHARACTERISTICS OF THE POWER LINE
Overview of the Power Line ChanneL
This seemingly obvious point, which is often overlooked in textbook analysis, cannot be overlooked in the field of long-distance communications. Unfortunately, the required conditions for using superposition (ie, linearity and time invariance) are not met for most transmission networks. Even if all the devices were disconnected, there would still be line-coupled noise from external RF sources.
![Figure 4.1: Maximum Noise Level (Source: Intellon Corp [17])](https://thumb-ap.123doks.com/thumbv2/pubpdfnet/10644040.0/71.834.139.705.724.1034/figure-maximum-noise-level-source-intellon-corp-17.webp)
Channel Characteristics
- Channel Impedance
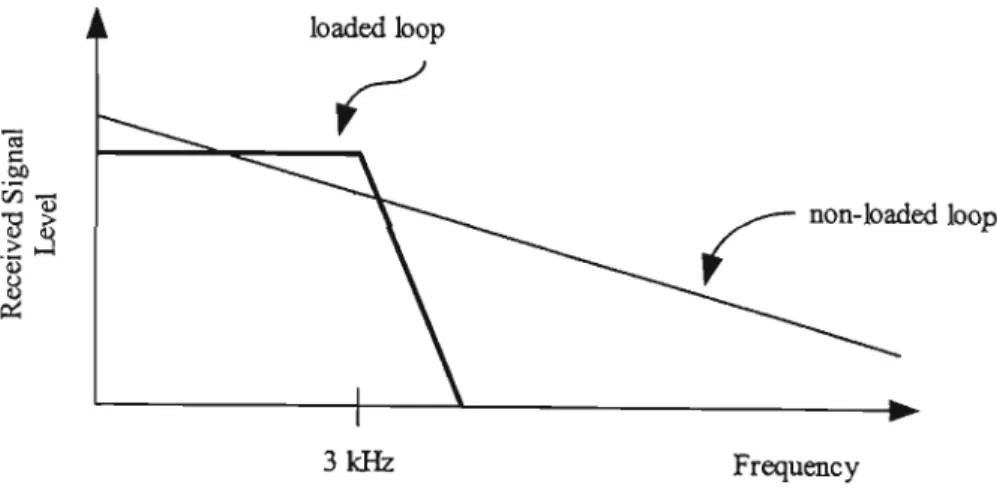
They make the impedance at higher frequencies more unpredictable than that in the 5-20 kHz frequency range. In the frequency range 9-95 kHz the line losses varied between 40-100 dBlkm depending on the location where the attenuation was measured. The impedance of these devices is usually an order of magnitude, or more, below the characteristic impedance of the wiring.
![Table 4.2: Power line wire characteristics (Echelon Corp [53])](https://thumb-ap.123doks.com/thumbv2/pubpdfnet/10644040.0/76.834.86.668.206.404/table-power-line-wire-characteristics-echelon-corp-53.webp)
Channel Transfer Function
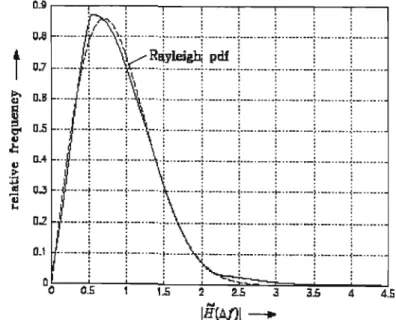
Therefore, the application of the central limit theorem is motivated, giving H(T], I) a complex non-stationary Gaussian process with autocorrelation function (* denotes complex conjugate and G denotes expectation) [29]. In general, the average gain ~ P(f) and the frequency-dependent average phase period CPo (f) of the set of transfer functions can be assumed to be characteristic of different types of power line networks and communication links over these networks. In many situations where the attenuation parameter a corresponds to different network types, the average phase term can be expressed by
![Figure 4.3: Sample functions of the non-stationary random process H(T],/)](https://thumb-ap.123doks.com/thumbv2/pubpdfnet/10644040.0/78.834.164.618.168.478/figure-sample-functions-non-stationary-random-process-h.webp)
Channel Noise
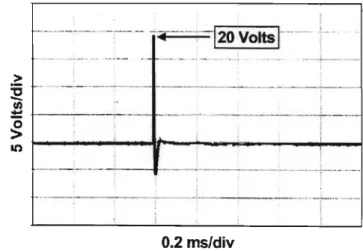
- Impulse noise
- Tonal Noise
- High Frequency Impulse Noise
As previously mentioned, a complete analysis of the power line properties must include an analysis of the deformation properties of the channel. The throughput capabilities of the clients were observed on the server since the server was connected to the master unit. In the conductive coupling method (see Figure 6.11), the power line signal is injected into the power grid via the unit's power cable or via signal coupling units [71].
AS A MODULATION SCHEME FOR POWER LINE
Communication Technologies
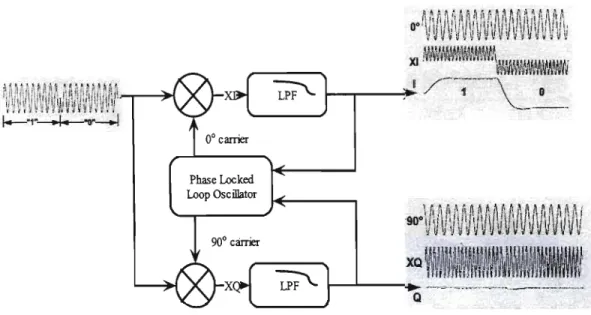
Many early power line communication devices used narrowband transmission combined with a phase-locked loop type receiver. With this technology, the PLL typically adjusts the phase of the receiver's local oscillator until the downconverted and filtered signal in the quadrature channel (Q) is zero. This and other limitations have led many companies to abandon this technology for use in power line communications [53].
Multicarrier Modulation
- Theory of Operation
- Transmitter
- Receiver
- Multipath
OFDM signals are demodulated by the reverse process from the transmitter (see Figure 5.6), where the cyclic prefix is removed from the time domain signal, and an FFT is performed on each symbol to convert to the frequency domain. This prefix copies the last part of the symbol and adds the copy to the beginning of the symbol (see Figure 5.6). By choosing a cyclic prefix of 1 microsecond for the example above, all received copies of the original signal will contain the same enhanced OFDM symbol (except shifted in time) and there will be no lSI.
![Figure 5.4: Differential phase encoding across symbols (Source: Intellon Corp [17,23])](https://thumb-ap.123doks.com/thumbv2/pubpdfnet/10644040.0/91.834.256.512.141.375/figure-differential-phase-encoding-symbols-source-intellon-corp.webp)
Application ofOFDM to Power Lines
- Fading Channel Model
By describing this fading channel in the equivalent low-pass domain, the complex-valued channel state is related to the subcarrier transfer factors and the channel transfer function by ( k eZ : discrete-time index), respectively. Therefore, the fading channel is slowly time-varying, and the channel state can be expected to be constant over at least two consecutive symbols. In this case, a fading channel realization represents an ensemble average over powerline channel realizations.
Channel Capacity
- Coherent Transmission
- Non-coherent Transmission
In many communication scenarios, reliable estimation of the channel state and carrier phase is not applicable. As mentioned in Chapter 5, the channel memory does not play any role for the capacity of the coherent transmission scheme. According to the capacity curves, perfect knowledge of the channel characteristic leads to significant gains of the order of several dB in the signal-to-noise ratio.
![Figure 5.9: System model for noncoherent transmission (Source: Cogency [9,22])](https://thumb-ap.123doks.com/thumbv2/pubpdfnet/10644040.0/100.834.99.713.576.940/figure-5-model-noncoherent-transmission-source-cogency-22.webp)
EVALUATION OF POWER LINE
Numerical Results
- Coherent Transmission
- Non-coherent Transmission
As can be seen, at a given SNR, the capacity decreases for the larger value of a. With regard to the capacity curves of different constellations, the concept of CSED is expected to yield higher gains for increasing a. Similar to coherent transmission the capacity loss due to fading strongly depends on parameter a (for clarity, the respective capacity curves of the A WGN channel are omitted in Figure 6.4).
Simulation Results
Coherent 16QAM transmission over power line channels with different attenuation parameters is shown in Figure 6.7. The simulation results for different values of the coherence bandwidth Be are shown in Figure 6.8 (a = 10-7 11Hz, BT = 3 MHz). Finally, coherent transmission with channel state information and differentially coded transmission without channel state information using the 8PSK signal constellation are compared.
Power Line Technology Practical Equipment
- Introduction
- Basic Coupling Methods and Components
- Conductive Coupling and Components
- Inductive Coupling Method
The transmission line signal can be coupled to the power grid via conductive or inductive coupling [71]. The coupling capacitor acts as a signal shortcut for the injected signal current of the power line into the power network. For the example in Figure 6.13, the transmission line signal will only propagate to the left.
![Figure 6.10: Typical signal-to-noise ratio (Source: Ascom [71])](https://thumb-ap.123doks.com/thumbv2/pubpdfnet/10644040.0/118.834.92.718.334.705/figure-10-typical-signal-noise-ratio-source-ascom.webp)
Proposed Solution for Rural Telecommunication
- General
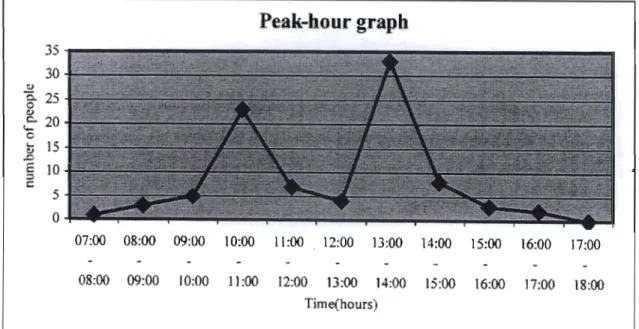
- Traffic Consideration
- Distance Between Repeaters
- Final Solution
Out of the total population living in rural areas, only a few residents can afford personal computers. From the above discussion it is clear that tenn can also be used properly for the integration of energy and information systems. The appeal of power line technology is that most of the wiring for the network is in place, which minimizes the cost of running new wires.
AND RECOMMENDATION
Conclusion and Recommendation
Therefore, traditional broadband connections such as cable and ADSL are not available to a large part of the rural population; electricity lines connect more and more people. The numerical results of the channel capacity show that the frequency-dependent signal attenuation and transmission bandwidth largely influence the required average signal-to-noise ratio for reliable communication at the receiver. Increasing the observation interval of the non-coherent detection can reduce the gap between transmission with and without channel status information at the receiver.
Future Work
20] Powerline Communication for Access Networks - Performance Study www.ifn.et.tu-dresden.de/-hrasnicalresearchlplc2 .pdf. Sutterlin, W Downey, A power line communication guide - challenges and technologies, http://www.echelon.com!solutions/providers/default.htm. http://www.cabletesting.com!cabletesting/standards/overview.htm. 55] CENELEC, European Committee for Electrotechnical Standardisation, www.cenelec.org/cenelec/cenelec+in+actionlhorizontal+areas/ictlsc205.htm.
![Figure 1.5: Interconnection of the transmitter to receiver units (Eskom Transmission [7])](https://thumb-ap.123doks.com/thumbv2/pubpdfnet/10644040.0/28.834.184.645.343.566/figure-1-interconnection-transmitter-receiver-units-eskom-transmission.webp)
![Figure 1.6: A detailed interconnection of the transmitter to receiver units (Eskom Transmission [7])](https://thumb-ap.123doks.com/thumbv2/pubpdfnet/10644040.0/29.834.91.740.236.735/figure-detailed-interconnection-transmitter-receiver-units-eskom-transmission.webp)
![Table 2.2: State-of-the-art comparison between PLC and other relevant technologies (Source: Mason Communications Ltd [10])](https://thumb-ap.123doks.com/thumbv2/pubpdfnet/10644040.0/48.834.92.747.144.581/table-state-comparison-relevant-technologies-source-mason-communications.webp)
![Figure 4.6: Noise from an electronic toothbrush charging stand (Source: Echelon Corp [53])](https://thumb-ap.123doks.com/thumbv2/pubpdfnet/10644040.0/83.834.102.687.322.564/figure-noise-electronic-toothbrush-charging-stand-source-echelon.webp)
