DESCRIPTION OF THE INDUSTRY
Producing Areas
The figure clearly indicates that the groundnuts are mainly produced in three provinces, namely Free State (43%), North West (40%) and North Cape Province (11). Groundnuts are also produced in Limpopo Province, although production is lower at 6% of total production recorded in 2016/17. However, North West Province increased its production significantly in 2013/14, surpassing both Free State and Northern production volumes Cape.
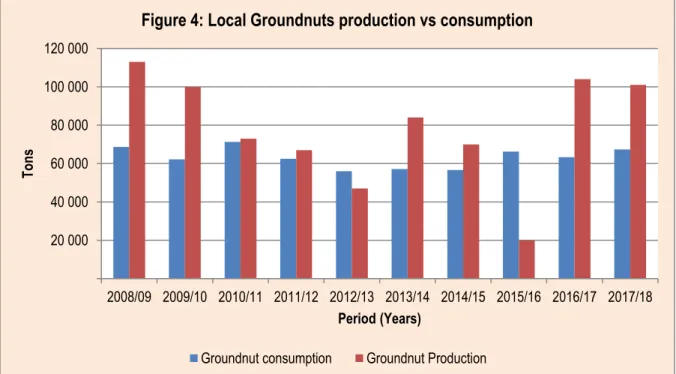
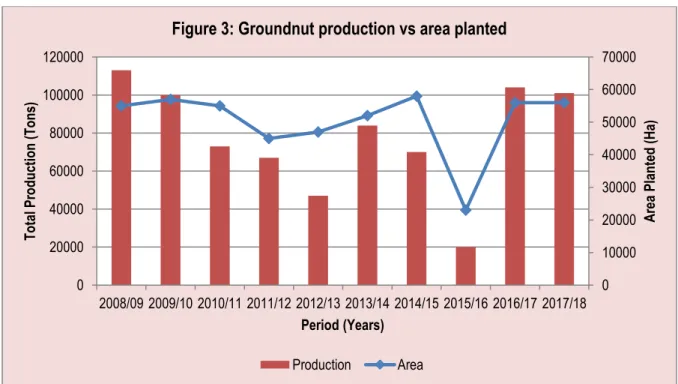
Notably, groundnut production in all major producing regions experienced a drastic decline in the 2012/13 season, resulting in a slight decline in total groundnut production in South Africa. Trends in peanut planting and production from the 2008/09 to 2017/18 production seasons are shown in Figure 3 below. During the 2007/08 season, production and areas planted with groundnuts were higher with maximum quantities of 100,000 tonnes and planted areas of 55,000 hectares.
This was followed by a weakening of groundnut production volume between the years 2010/11 and up to the 2015/16 marketing seasons, indicating a slight decline in yield and adverse weather conditions appearing on the other hand, particularly during 2015/16. The period under analysis ended with relatively higher quantities and area planted to groundnuts in the 2017/18 season.
MARKET STRUCTURE
- Domestic Market and Prices
- Exports
- Share Analysis
- Processing
- Market Value Chain
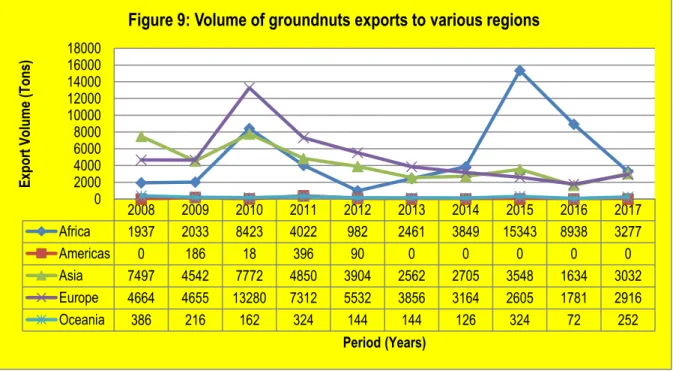
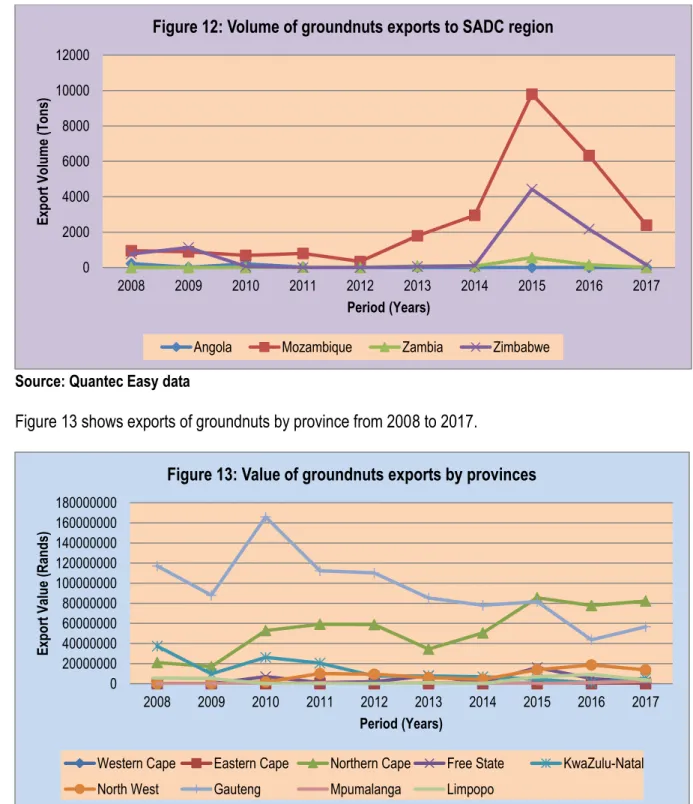
The volume and value of South Africa's groundnut exports to the world are summarized in Figure 7 below. The figure shows that throughout the period under analysis, the amount of peanut export was consistent with the value of peanut export. The figure further shows that groundnut exports fluctuated significantly during the period under analysis.
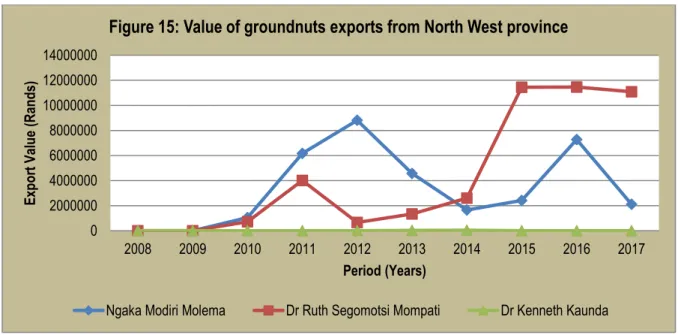
The period under review ended with a decreasing trend for the volume of peanut exports with an increasing value in 2017. The period under analysis ended with decreasing volumes of peanuts from South Africa to the Netherlands, with an increasing export to Belgium in 2017. Exports in general of groundnuts from Gauteng province were highly volatile during the period under analysis.
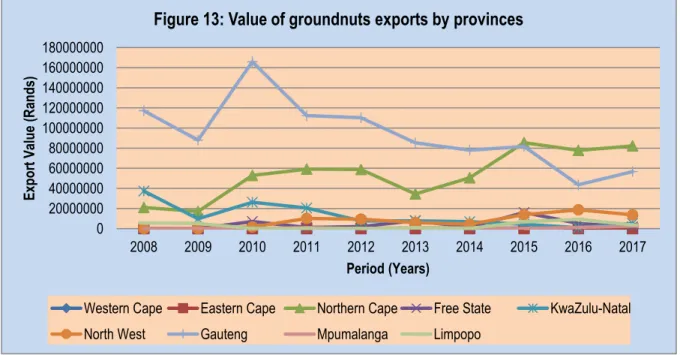
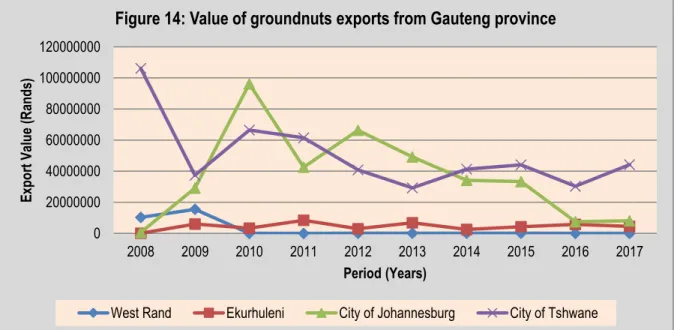
The figure also indicates that Ekurhuleni and West Rand also contribute significantly to the total value of Gauteng province's groundnut exports. The analysis period ended with the city of Tshwane holding the majority of Gauteng's value of groundnut exports in 2017. The figure indicates that the value of groundnut exports was highly volatile during the analysis period.
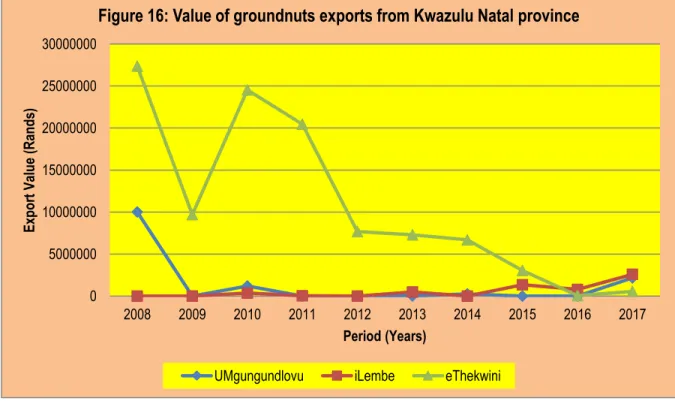
The figure indicates that eThekwini has the largest value of groundnut exports from the provinces, followed by Umgungundlovu and iLembe. The figure further indicates that Frances Baard recorded the highest value of groundnut exports in 2015. The reporting period ended with the highest value of groundnut exports from the North Cape in 2017, about 1% higher compared to the previous season.
The table further shows that the share of groundnut exports from other provinces remained minimal throughout the period under review. Ekurhuleni District Municipality had the largest share of the total value of groundnut exports in the province between 2009 and 2013. The table shows that UMgungundlovu and ILembe districts contributed insignificantly to the value of groundnut exports in the province.
However, the reporting period ended with a high value of groundnut exports from Kwazulu Natal coming from the ILembe district, accounting for almost 48.89%.
Market Intelligence
Tariffs
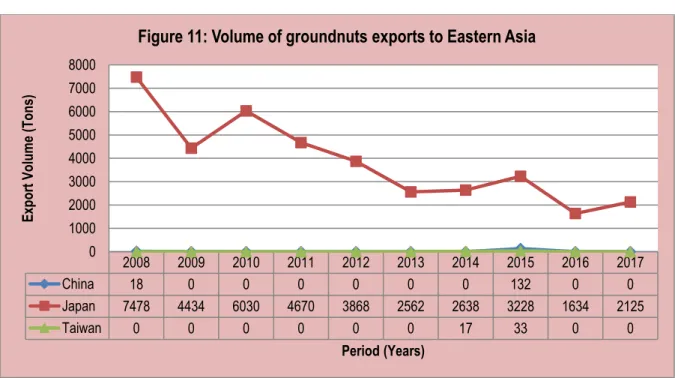
This is mainly because some of these countries do not levy tariffs on groundnut imports from other countries. South Africa enjoys a preferential tariff of 0% ad valorem in groundnut exports to Mozambique and Zambia due to the existence of the SADC Free Trade Agreement. The Japanese groundnut industry is heavily protected by higher import duties levied by these countries on groundnut imports from elsewhere.
Japan applies an import duty of 419.14% Ad Valorem to imports of peanuts originating in other countries and to imports of peanuts originating in South Africa.

Performance of the groundnut industry
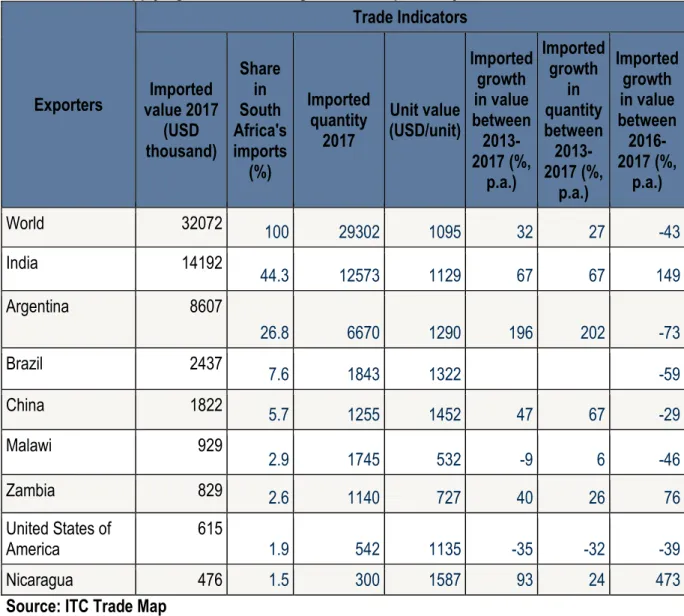
Groundnut imports from China increased by about 67% in volume between the years 2013 and 2017, while imports from Zambia increased by 24% in volume. It is clear from the figure and table that India accounted for about 44.3% of the total groundnuts imported by South Africa during the year 2017. The other major exporters of groundnuts to South Africa are Argentina, Brazil, China and Malawi which stand for and 5.7% of South Africa's total peanut imports respectively.
Table 9 and Figure 29 show that the main export destinations for groundnuts originating in South Africa are Japan, Belgium, Zimbabwe, Mozambique, India, Swaziland, the Netherlands, New Zealand, Namibia and Zimbabwe, with the largest exports. to Japan and Belgium. In 2017, Japan alone absorbed 31.7% of South Africa's total peanut exports, followed by Belgium and Mozambique with 27.4% and 12.8% respectively. The value of South Africa's peanut exports to the world decreased by 5% between 2013 and 2017.
The figure and table further show that between the years 2016 and 2017, the value of South African groundnut exports to the world fell by 17%, while those to Japan increased by 43% over the same period. The growth of South African groundnut exports to countries such as Mozambique and Zambia is greater than the growth in these countries. The figure further shows that if South Africa wants to expand its groundnut export base, the potential markets are in countries such as Kenya, Zimbabwe and Vietnam.
ACKNOWLEDGEMENTS