DESCRIPTION OF THE INDUSTRY
- Production areas
- Production trends
- Local consumption
- Employment
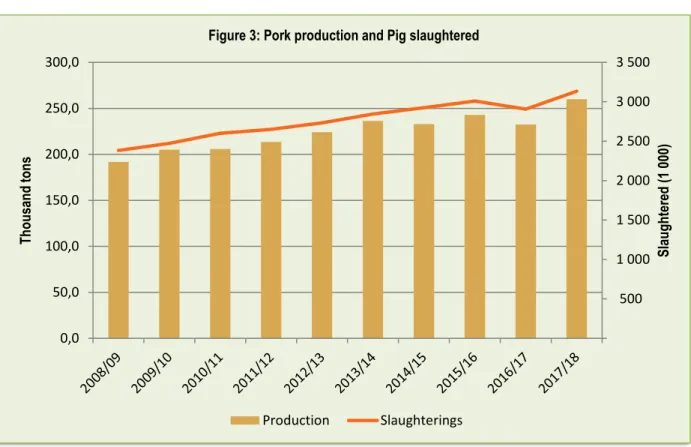
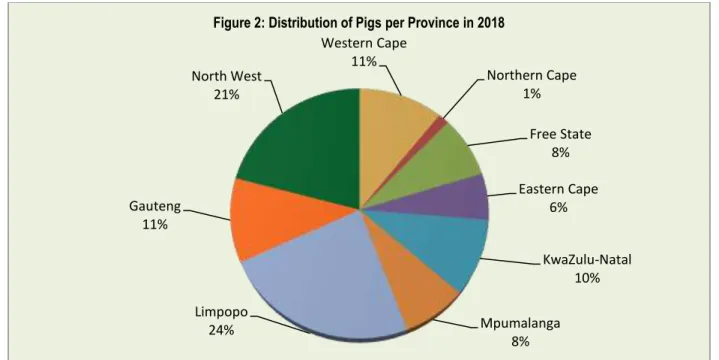
It is noteworthy that the number of pigs in South Africa has been decreasing for the past few years, which may be due to the fact that the consumption of pork is increasing. In the last decade, approximately 27 million pigs were slaughtered, yielding more than 2.2 million tons of pork. An average of 2.7 million pigs were slaughtered and an average of 224,500 tons were produced per year during the analyzed period.
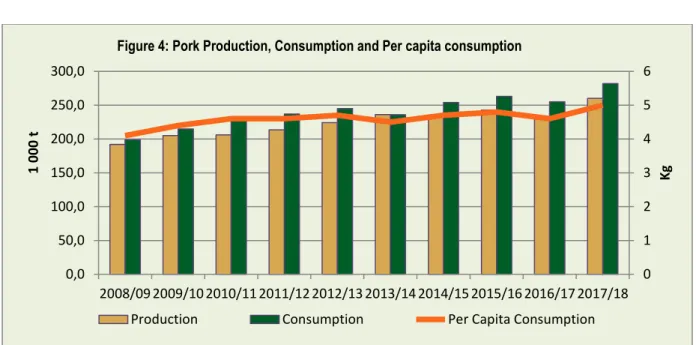
In response to increasing consumption and/or demand for pork products, pork production has increased over the past decade, and so has the number of pigs slaughtered. Figure 4 shows that South Africa consumes more than it produces, making the country a net importer of pork. In 2013/14, South Africa was self-sufficient with production of 236 300 tonnes, exceeding consumption of 236 000 tonnes, and consumption declined slightly in 2013/14.
This may be due to the high price of pork, which has made it relatively expensive to its substitutes such as poultry and beef. The increased per capita consumption may be due to the increasingly urbanized consumers with the increased per capita income.
MARKET STRUCTURE
Domestic market
Import-export analysis
South African export and import analysis
- Exports for pork
- Imports
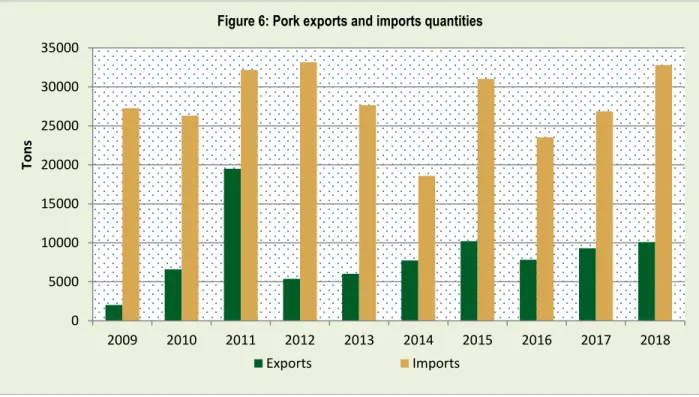
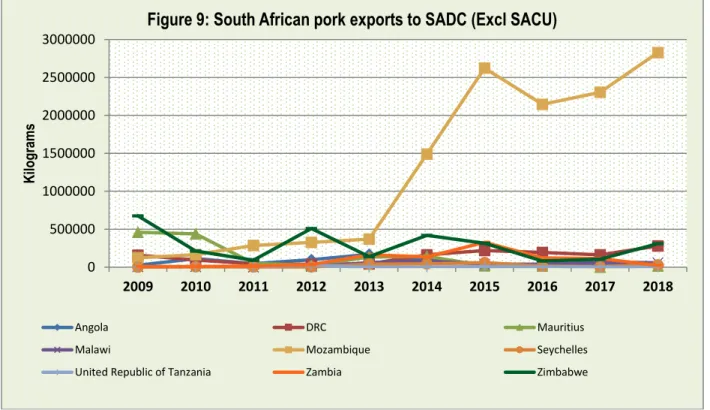
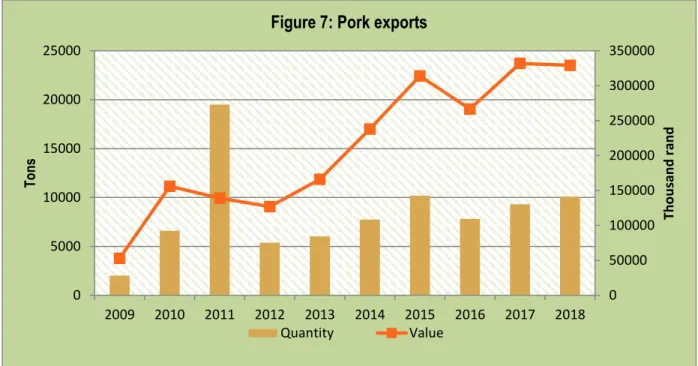
According to Figure 7, it is clear that the amount of pork exports has remained lower during the last decade, excluding the year 2011, which appeared at about 20,000 tons. With the exception of SACU members, the highest pork exports were experienced in 2015 and 2018 through Mozambique. In total, Mozambique claimed the largest share (62%) of pork exported from South Africa during the period under analysis followed by Zimbabwe at a distance with a share of 14%.
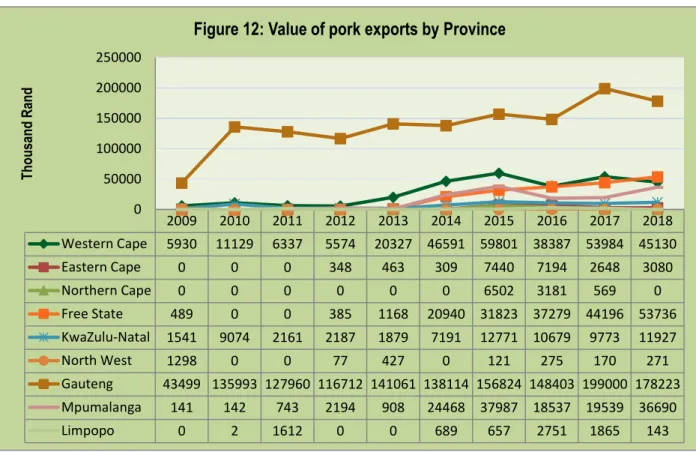
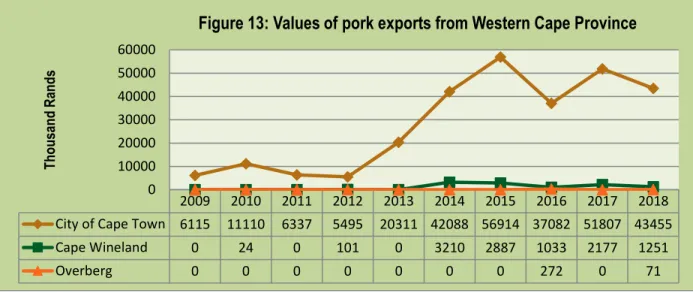
Tanzania and Seychelles recorded the lowest shares of South African pork exports during the review period. During 2018, Mozambique remained the largest market for South African pork exports to SADC with a share of 79%. With the total export of pork from the country, Gauteng had an export share of 65% followed at a distance by the Western Cape with 16%.
Other provinces such as Limpopo, East Cape, Northern Cape and North West make a small contribution to total pork exports. There were no records of pork exports from the Eastern Cape province between 2009 and 2012. From the Free State province, all district municipalities recorded occasional pork exports during the analyzed period.
Lejweleputswa increased its pork export in 2017 and accounted for 49% of the share of pork exports followed by Mangaung with 38%. UThukela, Umzinyathi and iLembe district municipalities have shown irregular pork exports during the period under analysis. Umzinyathi is the lowest exporter of pork, however in 2018; its exports increased by 635% and became the leading exporter.
Ehlanzeni is on average the highest exporter of pork, but Gert Sibande was a leading exporter in 2009 and 2012 with an export share of 90% and 54% respectively. The total pork exports from the province decreased in 2018, Vhembe was responsible for 55% followed by Capricorn with a share of 44% and Waterberg with 1% share respectively. Siyanda District Municipality had a share of 97% of pork exports from the province in 2015, followed by Namakwa and Frances Baard District Municipalities with 2.7% and 0.1% respectively.
In total, Germany was the highest exporter of pork to South Africa within the countries of the European Union with a 54% total share, followed at a distance by Spain (19%) and France (9%). It is clear that the majority of pork imports are from the European Union, which together accounted for 74%.
MARKETING CHANNELS / VALUE CHAIN
OPPORUNITIES AND CHALLENGES
STRENGTHS AND WEAKNESSES
MARKET INTELLIGENCE
Export tariffs
Import tariffs
PERFORMANCE ANALYSIS OF SOUTH AFRICAN PORK INDUSTRY IN 2018
Exports
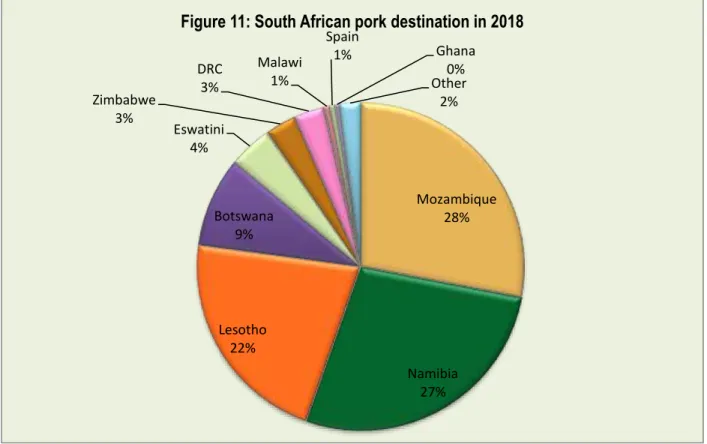
During this year, South Africa exported 10 131 tonnes of pork (fresh, chilled or frozen) at an average value of USD 2 461/unit. The main export destinations for pork (fresh, chilled or frozen) originating in South Africa during 2018 were Mozambique, Namibia and Lesotho. The largest share of South African pork exports (fresh, chilled or frozen) was exported to Mozambique which had 26.6% followed by Namibia which had 26% and Lesotho with 17.8%.
Exports of pork (fresh, chilled or frozen) from South Africa increased by 2% in value and 4% in volume between 2014 and 2018. During the same period, exports of pork (fresh, chilled or frozen) to Mozambique increased by 12% in value and 12% in volume. Between 2017 and 2018, South Africa's exports of pork (fresh, chilled or frozen) to the world were unchanged.
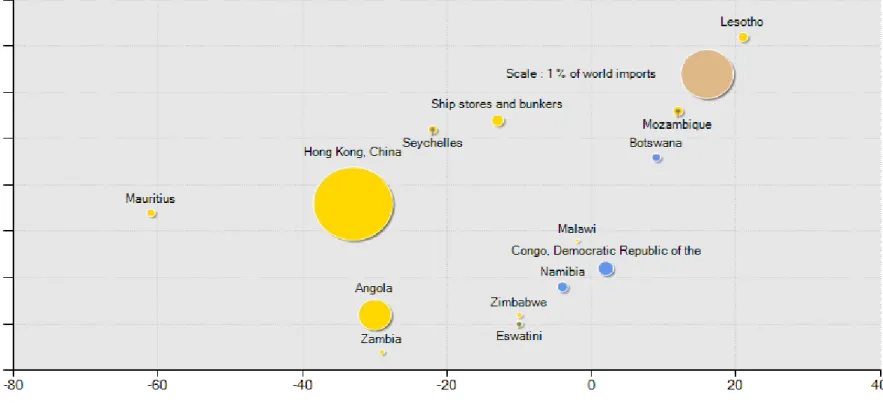
During the same periods, exports to Mozambique increased by 19%, Namibia decreased by 1%, while Lesotho increased by 12%. The figure illustrates that between 2014 and 2018; Exports of South African pork (fresh, chilled or frozen) to Hong Kong, China, Angola, Mauritius, Seychelles, Zambia, Lesotho, Mozambique, Zimbabwe and Eswatini were growing at a rate that is less than the growth of their import from the rest of the world. . In the same period, South African pork exports (fresh, chilled or frozen) to the Democratic Republic of the Congo (DRC), Botswana and Namibia were growing at a rate that is greater than their imports from the the rest of the world.
Lesotho represents gains in a dynamic market, while Zambia and Eswatini represent losses in a declining pork (fresh, chilled or frozen) export market from South Africa. Hong Kong, China, is the largest market with a 2.37 percent global share, but South Africa's export growth fell by 33 percent. The analysis in the figure above shows that Mozambique had the largest shares of South African pork exports (fresh, chilled or frozen) at 26.58% in 2018, followed by Namibia at 25.96%.
If South Africa wants to diversify its pork exports (fresh, chilled or frozen), the largest market exists in Germany due to the share of world pork imports (fresh, chilled or frozen ) of 5.91%.
Imports
South Africa's imports account for 0.3% of global imports of pork (fresh, chilled or frozen) and it ranks 44th in global imports. South Africa's imports of pork (fresh, chilled or frozen) increased by 7% in value and 11% in volume between the periods 2014 and 2018. During the same period, imports of pork (fresh, chilled or frozen) from Germany increased by 5% in value and 8% in volume, while imports from Brazil increased by 218% in volume.
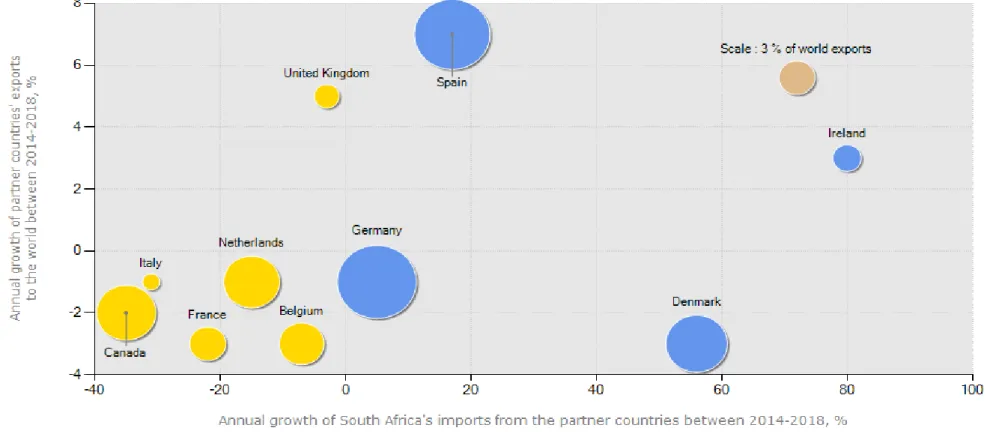
Between 2017 and 2018, South Africa's imports of pork (fresh, chilled or frozen) increased by 2% in value. During the same period, imports of pork (fresh, chilled or frozen) from Germany increased by 37% and Brazil by 80%, while Spain decreased by 46%. The figure illustrates that South Africa's imports of pork (fresh, chilled or frozen) from Canada, France, the Netherlands, Italy, Belgium and the United Kingdom (UK) grew at a rate less than their export growth to the rest of the world.
It can also be noted that the annual growth of imports into South Africa from the countries mentioned has decreased. At the same time, South African pork imports (fresh, chilled or frozen) from Spain, Ireland, Denmark and Germany were growing at a faster rate than their exports to the rest of the world. The most competitive market is Germany due to its largest share in the world of 15.49% and Spain with a share of 14.17%.
The analysis shows that Spain and Germany had the largest shares of South Africa's pork (fresh, chilled or frozen) imports during the year 2018. Germany is the largest supplier of pork (fresh, chilled or frozen) with a share of 51.64% in South. African import market followed by Spain with 19.22%. Germany remains the largest market of pork imports with a world market share of 15.81%, followed by Spain with world imports of 13.5%.
Therefore, if South Africa wants to diversify, South Africa can increase its imports from Botswana due to its highest export growth of 42%.
ACKNOWLEDGEMENTS