Under the current global economic crisis, small businesses are seen as a major force behind South Africa's economy. Ironically, it is this type of small business that needs quality solutions, because quality strategies do not come from the basis of the traditional small business, and therefore have an impact on the successful management of the business environment.
LIST OF TABLES
SCOPE OF THE RESEARCH
- INTRODUCTION AND MOTIVATION
- BACKGROUND OF PROBLEM
- Statement of the research problem
- RESEARCH QUESTION
- Investigative questions
- RESEARCH OBJECTIVES
- THE RESEARCH PROCESS
- THE RESEARCH DESIGN AND METHODOLOGY
- DATA COLLECTION DESIGN AND METHODOLOGY
- DATA VALIDITY AND RELIABILITY
- ETHICS
- RESEARCH ASSUMPTIONS
- RESEARCH CONSTRAINTS
- SIGNIFICANCE OF THE PROPOSED RESEARCH
- CHAPTER AND CONTENT ANALYSIS
- Scope of the research: In this chapter, a holistic perspective will be provided in respect of the proposed research to be conducted within the ambit of
- Chapter 2 – Implementing quality solutions for small business in South Africa literature review: In this chapter a literature review will be conducted on
- Survey design and methodology: In this chapter, the survey design and methodology to be used within the ambit of this dissertation will be
- Analysis and interpretation of data: In this chapter, data collected from the research survey conducted within the ambit of will be analised
- Chapter 5 – Conclusions and recommendations: In this chapter, the research will be concluded and recommendations made to mitigate the research problem
Reliability (also called "credibility") is concerned with the results of the research (Collis & Hussey, 2003:186). In this thesis, the "internal consistency method" will be used to estimate the reliability of the answers to questions in questionnaires.
CHAPTER TWO
IMPLEMENTING QUALITY SOLUTIONS FOR SMALL BUSINESS IN SOUTH AFRICA LITERATURE REVIEW
INTRODUCTION
THE CONCEPT ‘SMALL BUSINESS’
According to Manzullo (2010:1), over the past decade, small businesses have been an economic tool for the American economy. Entrepreneurs developing small businesses usually do not want to establish routine processes and procedures.
BACKGROUND OF SMALL BUSINESS IN SOUTH AFRICA
Displaced and confined to economically dismal homelands, the majority of the population lacked property rights to secure business financing, were prohibited from entering into partnerships with non-black businesses, and were forced to incur the costs and risks of living far from designated commercial areas. This is not only true for South Africa, but also a common phenomenon in the rest of the world.
THE CONCEPT ‘SMALL BUSINESS’ DEFINED
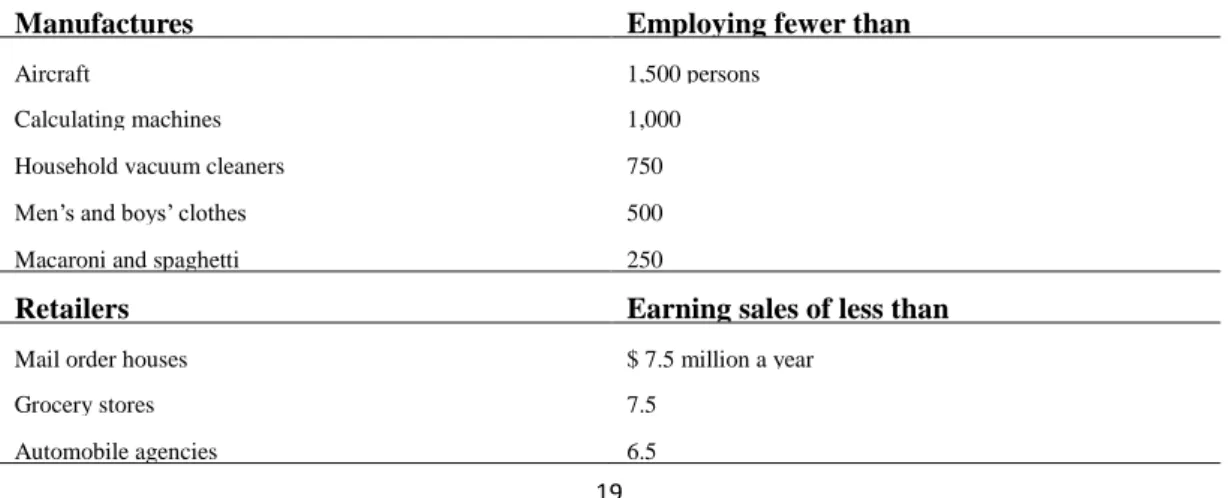
- Small Business: An American perspective
- Small Business: A United Kingdom perspective
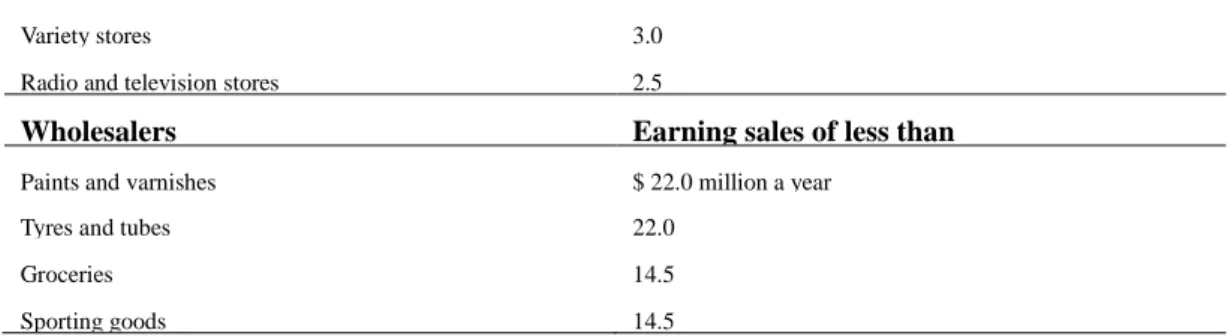
- Small Business: A perspective from France
- Small Business: A South Africa perspective
- Small Business: A perspective from other countries
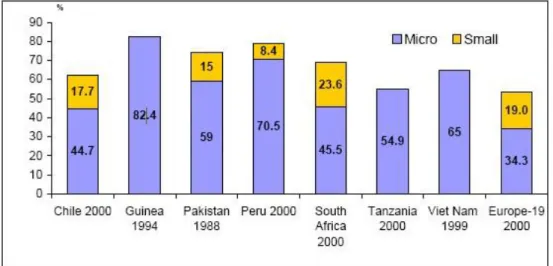
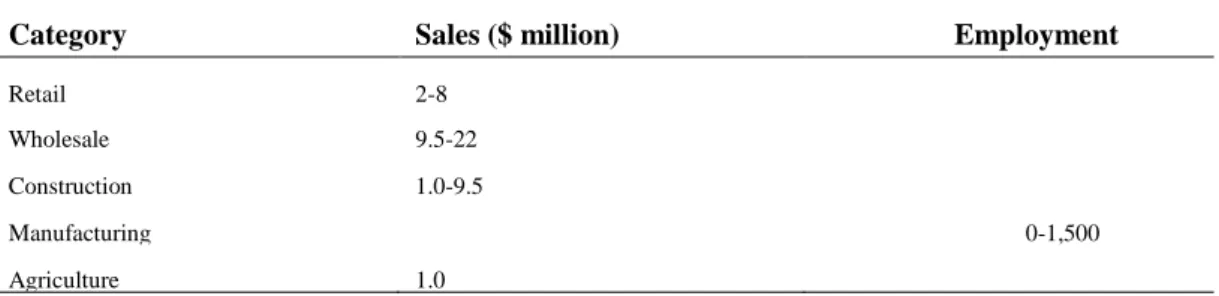
In France, as in most countries, there is no single official definition of "small business". The framework most used in South Africa is the definition of the National Small Business Act 102 of 1996 (Abor and Quartey, 2010:4), which defines five categories of businesses in South Africa.
THE CONCEPT OF QUALITY
- Manufacturing-based definitions of quality
- Customer-based definitions of quality
- Product-based definitions of quality
- Valued-based definitions of quality
- Transcendent definitions of quality
However, customer satisfaction cannot be achieved for reasons unrelated to product quality (Rao et al., 1996:27). Since leather is valued higher than vinyl, the presence of leather trim in a car would imply a higher quality in terms of color or finish of the leather (Rao et al., 1996: 27).
DIMENSIONS OF QUALITY
Feature Supplements to basic functioning characteristics 3. Reliability Does not malfunction during specified period
Durability A measure of product life 6. Serviceability The speed and ease of repair
Tangibility Physical facilitates, equipment and appearance of personal 2. Reliability Ability to perform the promised service dependably and
Responsiveness Willingness to help customers and provide prompt service 4. Assurance Knowledge and courtesy of employees and their ability to inquire
Empathy Caring, indvidualised attention the firm provider gives its customers
- LEADING CONTRIBUTORS TO THE PARADIGM
- W. Edwards Deming’s Fourteen Points for Quality Management
- W. Edwards Deming’s Seven Deadly Diseases for Quality Management
- W. Edwards Deming’s continual improvement method for quality management
- Juran Trilogy for Quality Management
- Philip Crosby’s Fourteen Steps to Quality Improvement
- QUALITY MANAGEMENT TOOLS
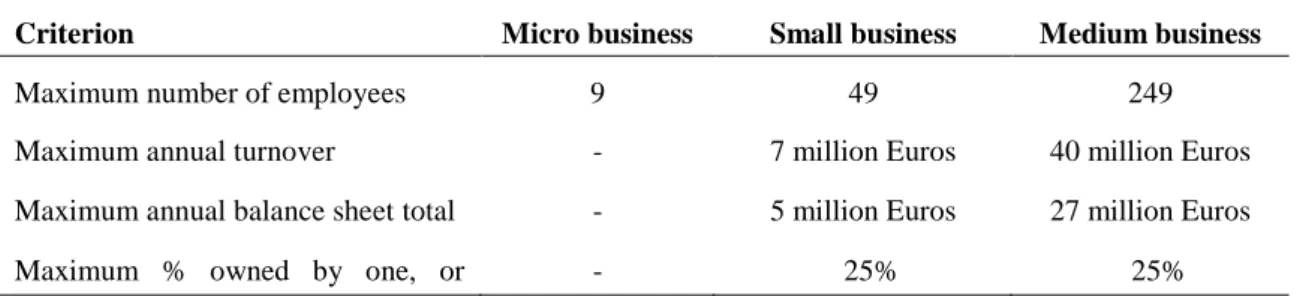
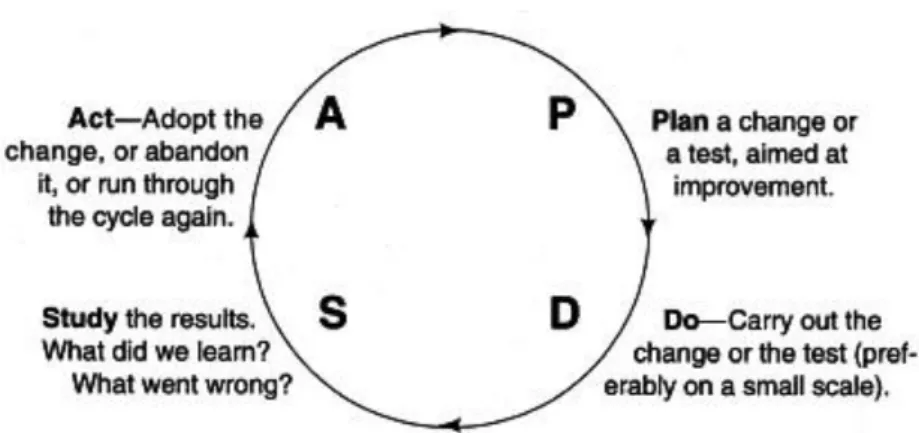
- The Plan-Do-Study-Act Cycle
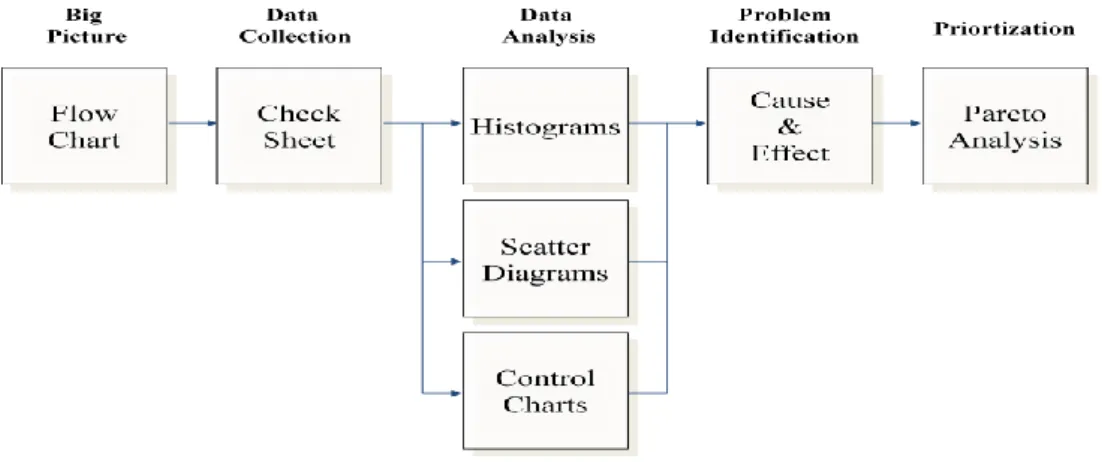
- Basic Seven Tools of Quality
- QUALITY SOLUTIONS TO IMPROVE THE SUSTAINABILITY OF SMALL BUSINESS ENTERPRISES
- Barriers that influence quality management in small business
- Long term quality solutions for small business
- CONCLUSION
However, one of the major obstacles affecting quality management in small businesses is that if the staff can perform sophisticated statistical analysis of quality problems. Due to the nature of ownership, small businesses usually suffer from a shortage of capital. According to the Small Business Guidebook to Quality Management, the one most important use of the PDSA cycle is with strategic planning.
Nothing will be more important than the clarification of the goal or vision of the small business organization. Team approach is one of the modern approaches to quality management learned from the Japanese is teamwork. Due to the nature of ownership, typical small businesses often suffer from a lack of capital.
It is important that training and education become a focal point in the future plan of the small businesses (Small Business Guidebook to Quality Management, 2010:30). However, quality strategies do not form the basis of small business enterprises, and therefore have an impact on the management of the business environments.
CHAPTER THREE
RESEARCH DESIGN AND METHODOLOGY
- INTRODUCTION
- CASE STUDY
- CHOICE OF SAMPLING METHOD
- THE TARGET POPULATION
- DATA COLLECTION
- MEASUREMENT SCALES
- THE DEMAND FOR A QUALITATIVE RESEARCH STRATEGY
- SURVEY SENSITIVITY
- SURVEY DESIGN
- SURVEY VALIDITY AND RELIABILITY
- QUESTIONNAIRE FORMULATION
- LIST OF QUESTIONS/STATEMENTS
- CONCLUSION
According to Collis and Hussey, a "sample" consists of some of the numbers of a "population" (the target population), the latter referring to a group of people or other collection of objects considered for the purpose of the research. As is the case with most academic research, the collection of data forms an important part of the overall thesis content. Research carried out in areas of a sensitive nature which, in the case of this study, pose special challenges for the researcher.
Thus, any type of qualitative inquiry could benefit from trained and prepared researchers, and the sensitive nature of investigating a stigmatizing condition made the need for such an endeavor in the current study all the more urgent. The sensitivity of certain issues and issues that have been identified as adversely affecting research in the settings we assess require not only intimate personal involvement but also the researcher's "personal and practical experience". Checkland supports this view but expands the concept with the opinion that: "The researcher becomes a participant in the action, and the process of change itself becomes the object of research".
Pre-test' the questionnaire for clarity of questions and ease of use before distributing it to respondents. In the next chapter, a data analysis results from the study will be carried out in detail and conclusions will be drawn.
ANALYSIS AND INTERPRETATION OF SURVEY RESULTS
INTRODUCTION
METHOD OF ANALYSIS
- Validation of survey results
- Date format
- Preliminary analysis
- Inferential statistics
- Assistance to research
- Sample
The technique is used to test for significant differences between the observed distribution of data between categories and the expected distribution based on the null hypothesis. The null hypothesis is that the two samples are drawn from a single population and therefore their probability distributions are equal. In a less general formulation, the two-sample Wilcoxon-Mann-Whitney test can be thought of as a test of the null hypothesis.
The p-value is the probability of observing a sample value as extreme as, or more extreme than, the value actually observed, given that the null hypothesis is true. This area represents the probability of a Type 1 error that must be accepted if the null hypothesis is rejected (Cooper & Schindler, 2001:509). The p-value is compared with the significance level () and based on this the null hypothesis is either rejected or not rejected.
If the p-value is less than the level of significance, the null hypothesis is rejected (if p-value < , reject null). If the p-value is greater than or equal to the level of significance, the null hypothesis is not rejected (if p-value ≥, do not reject a zero).
ANALYSIS
- Reliability testing
The target population is employees or owners of small businesses in the Western Cape; South Africa. In the rightmost column of Table 4.1 it can be seen that the reliability of the scale would be higher if any of these statements were deleted. For example, if statement A07 is deleted from this measurement scale, the Cronbach Alpha coefficient will increase to 0.8415.
Statements (Test all statements without current one’s input)
Variable nr
Correlation with total
Management created clear quality values, policies and strategies in the organisation
Management has experience and knowledge of quality management in the organisation
Management delegates authority and responsibility clearly in the organisation
There is enough capital to establish a quality system in the organisation
There is a quality management department in my organisation
Staff can perform sophisticated statistical analysis of quality problems in the organisation
Not all personnel have been trained in the quality management philosophy
All employees have opportunities to address quality problems of the product/service nature
Management and employees of the organisation are in frequent contact with the customers
Management and employees in the organisation have full insight into information flow from the customers
The communication between management and employees are frequent and open in the organisation
It is easy for employees to work together to achieve organisational goals
Management encourages activities that improve customer satisfaction
68 Statements (Test all statements without current one’s
There are processes in place for designing new products/services to ensure quality in the organisation
The process used in the organisation includes in-process measurement of quality
Continual Process Improvement is a common practice throughout the organisation
Descriptive statistics
Management created clear quality values, policies and strategies in the organisation
- There is enough capital to establish a quality system in the organisation
- Staff can perform sophisticated statistical analysis of quality problems in the organisation
- Not all personnel have been trained in the quality management philosophy
- All employees have opportunities to address quality problems of the product/service nature
- Management and employees of the organisation are in frequent contact with the customers
- Management and employees in the organisation have full insight Strongly disagree 1 2.9%
- The communication between management and employees are frequent and open in the organisation
- It is easy for employees to work together to achieve organisational goals
- Management encourages activities that improve customer satisfaction
- Customer comments on products/service are used to improve quality
- There are processes in place for designing new products/services to ensure quality in the organisation
- The process used in the organisation includes in-process measurement of quality
There are processes in place to design new products/services to ensure quality in the organisation.
Section B: Organisation and Respondent Demographics
Does your organisation currently have a quality strategy in operation?
Section A: Measuring Instrument
Customer comments on products/service are used to improve quality
Uni-variate graphs
The distribution of Primary function of business
Manufacturing Services Other
The primary activity of almost two-thirds of the respondents was "Services", and slightly more than a third of the respondents' primary activity was manufacturing. Only less than two-thirds of the small companies in the survey have a quality structure in place, and just under a third of the small companies in the survey do not have a quality structure in place. Almost two-thirds of organizations have fewer than 10 employees, and almost 30% of organizations have between 10 and 50 employees.
Have a quality strategy in place
Yes No
Number of employees in organisation
Those who agreed the least (the percentage who agreed to strongly agree is less than 50% of the total number of responses), and.
Annual turnover
Quality Management Measurements least agreed with
Inferential statistics
The above demographic information shows that the companies in this survey are companies with less than 50 employees and less than R5 million in turnover. Almost two thirds of these companies do have a quality strategy and the lack of a quality strategy is only represented by one third of the respondents (small companies).
Quality Management Measurements mostly agreed with
Comparisons with regard to having a quality strategy in place
The comparisons between the two groups were made for each statement in the survey and the p-value for each was more than 0.05, which means that the H 0. Since there were no statistically significant differences between the businesses that currently have a quality strategy have in operations and those not in relation to all the statement answers the statistics are attached in Annex E.
Exploratory factor analysis
Communality Estimates
Questionnaire Statements
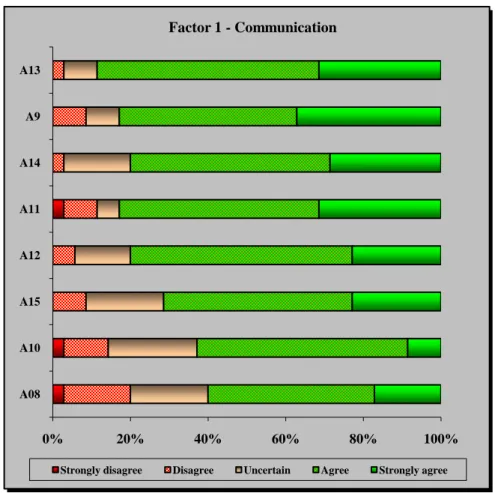
- Communication
- Management
- Process
- Kruskal Wallis tests
- Quality
- DISCUSSIONS AND CONCLUSSIONS
Using these criteria, eight items were found to load on the first factor, which was later labeled the “communication” factor. Two items loaded on the third factor, which was labeled the “process” factor, and three items loaded on the fourth factor, which was labeled the “quality” factor. It should be noted that item A06 is loaded both with factor 4 and with the second factor and.
Besides the statement “There is sufficient capital to set up a quality system in the organization”, the respondents were positive about the management factor. It appears that the processes used in the organizations include in-process measurement of quality and that continuous process improvement is a common practice for these small companies in the study. If statement A07 "Not all personnel are trained in the quality management philosophy" is expressed in the negative form, a positive response actually means negative responses.
Thus, although two-thirds of organizations indicated that they currently have a quality strategy, the quality aspect is still not well addressed. The variables that loaded on these 4 factors with a factor loading of more than 0.40 will be used in further analysis by adding the scores there together and for each factor (latent variable) using the non-parametric Kruskal Wallis test to compare the groups (Difference between having a quality strategy, the primary function, the number of people employed in the organization's groups and annual turnover groups).
CHAPTER FIVE
CONCLUSIONS AND FINAL RECOMMENDATIONS
- THE RESEARCH THUS FAR
- ANALOGIES DRAW FROM THE DATA ANALYSIS
- ANALOGIES DRAW FROM LITERATURE REVIEW
- THE RESEARCH PROBLEM REVISITED
- The recommendation related to quality strategy
- THE RESEARCH QUESTIONS REVISITED
- KEY RESEARCH OBJECTIVES REVISITED
- FINAL CONCLUSION
- Conclusion relating to the role of leadership in small business
- Conclusion relating to the employee involvement in small business
- Conclusion relating to the customer focus in small business
- Conclusion relating to the in-process measurement in small business
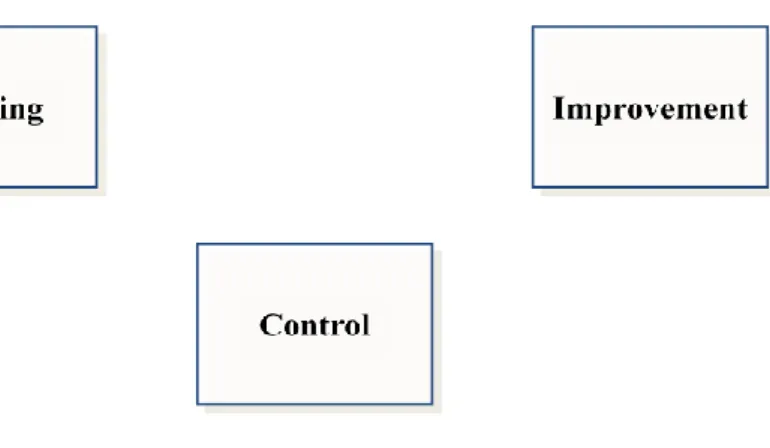
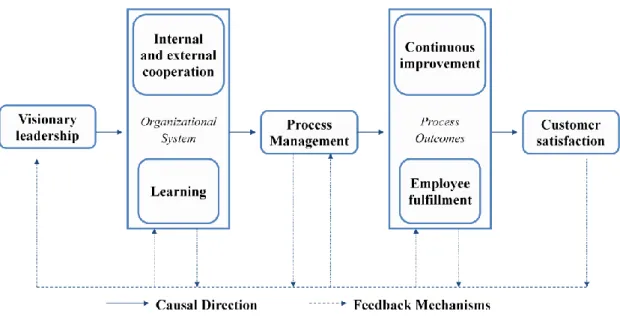
The flow diagram above concluded that the quality strategy plays an important role in influencing the sustainability of small business enterprises. Therefore, the customer focus is essential for continuous process improvement in small businesses. Many small businesses lack the awareness of quality management or do not realize that it is the primary element for the company's sustainability.
As the statement of the research problem indicated, quality strategy is the most important part of quality management in small businesses. There are a number of quality management strategies that can be applied to small businesses (SBEs), such as total quality management (TQM), continuous improvement, etc. Measuring quality in the process based on customer comments is the performance of quality assurance in small businesses.
Like the elements mentioned above, in-process measurement is essential for continuous process improvement in small businesses. White Paper on the National Strategy for the Development and Promotion of Small Enterprises in South Africa.
Annexure A
Sector or subsectors in accordance with the Standard Industrial
Classification
Size or class
Total full-time
Total annual
Total gross asset
Annexure B
Cronbach Alpha Coefficients
Annexure C
Descriptive statistics: Frequency tables
Annexure E
Comparisons using Mann-Whitney rank test
Annexure G
Non-parametric tests for comparisons: Kruskal-Wallis test and Mann-Whitney tests