REDUCTION OF THE ENVIRONMENTAL IMPACT OF A SOFT DRINK MANUFACTURING
PLANT
By Yaseer Ally
BSc Chemical Engineering
Submitted in fulfilment of the academic requirements for the degree of Master of Science in Engineering
in the
Discipline of Chemical Engineering, University of KwaZulu-Natal, Durban
August 2015
ABSTRACT
South Africa is a water stressed country with an increasing demand for water. Pressure is being exerted by greater pollution loads and reduced flows in the rivers. Environmental legislation is therefore, becoming more stringent, in order to reduce environmental degradation and promote sustainable development. The soft drink industry in South Africa is a major water user and polluter.
The primary objective of this thesis is to reduce the environmental impact of a soft drink factory.
The study was conducted at a soft drink company located in the South African province of KwaZulu-Natal. This company had been experiencing trade effluent charges in excess of R 70 000 per month as well as additional fines being levied by the local municipality, due to the effluent being consistently out of specification with respect to Chemical Oxygen Demand (COD) and sugar concentration. The scope of the study has therefore, been defined to focus on the reduction of effluent strength and sugar content, hence reducing the environmental impact.
The various concepts or tools to achieve sustainable development were investigated and the Resource Efficient and Cleaner Production (RECP) assessment methodology combined with the methodology to achieve materials efficiency were utilised in order to provide recommendations to solve the effluent issue at the soft drink plant. The RECP procedure follows a five phase approach of planning and organisation, pre-assessment, assessment, feasibility analysis and implementation and continuation. The methodology to achieve materials efficiency uses a 3 step approach of drawing a material flowchart, creating a material balance and generating options.
The sources of the effluent were identified and quantified and the factors influencing the quantity and quality of the effluent from these sources investigated. It was found that the primary COD causing component is sucrose. Approximately 11.4% of the identified losses occurred as a result of staff negligence or a lack of staff training, while other losses were due to easily rectifiable technological shortcomings, or were unavoidable. Solutions were developed in the categories of source elimination or reduction and end-of-pipe treatment. End-of-pipe treatment options were only considered if source elimination and reduction techniques could not be implemented. A feasibility analysis from an environmental aspect yielded the optimum solution to be a combination of source elimination and reduction techniques and one of the end-of-pipe treatments. The
end-of-pipe treatment entails the transporting of high strength effluent to a nearby co-digestion facility, where energy will be produced in the form of methane. The implementation of this optimum solution has the potential to reduce the COD load of the effluent by 10 583 kg COD/month which is 85% of the identified losses. Various other recommendations were developed to reduce the water consumption and hence decrease the volume of effluent to drain.
DECLARATION
I, Yaseer Haroon Tar Ally, declare that
• The research reported in this thesis, except where otherwise indicated, is my original work.
• This thesis has not been submitted for any degree or examination at any other university.
• This thesis does not contain other people’s data, pictures, graphs or other information, unless specifically acknowledged as being sourced from other persons.
• This thesis does not contain other people’s writing, unless specifically acknowledged as being sourced from other researchers. Where other written sources have been quoted, then:
a. their words have been re-written but the general information attributed to them has been referenced;
b. Where their exact words have been used, their writing has been placed inside quotation marks, and referenced.
• This thesis does not contain text, graphics or tables copied and pasted from the internet, unless specifically acknowledged, and the source being detailed in the thesis and in the references sections.
Name: Yaseer Haroon Tar Ally Signature: ………
As the candidate’s supervisors, we have approved this thesis for submission
Supervisor: Prof. CA Buckley: Signature: ………
Co-Supervisor: Susan Mercer: Signature: ………
ACKNOWLEDGEMENTS
I would like to extend my sincere thanks to the following people and organisations for their assistance and contributions to this study:
The company, for sharing their information.
Chris Buckley for his guidance, hard work and continuous support.
Susan Mercer for contributing her knowledge, assistance and constructive suggestions.
My family for being my pillar of support and my mom and dad for all their years of patience.
The Water Research Commission for funding the project.
TABLE OF CONTENTS
Introduction ... 1
1.1 Objectives ... 5
1.2 Thesis structure: ... 6
The soft drink industry ... 8
2.1 The production process of carbonated soft drinks ... 8
2.1.1 Water Treatment ... 9
2.1.2 Simple syrup preparation ... 13
2.1.3 Final syrup Preparation ... 14
2.1.4 Blending ... 14
2.1.5 deaeration and Carbonation ... 15
2.1.6 Filling ... 15
2.1.7 Capping, labelling and packaging ... 16
2.2 Effluent generation in the soft drink industry ... 16
2.2.1 Effluent sources ... 16
2.2.2 Pigs ... 17
2.2.3 Municipal wastewater treatment options ... 19
2.3 survey of the South African soft drink industry... 20
2.3.1 Water intake ... 20
2.3.2 Effluent generation: ... 21
2.3.3 Best practices ... 21
2.4 Summary: ... 23
The prevention and control of water pollution:... 24
3.1 Legislative approach to the prevention of water pollution ... 24
3.2 The management of water resources in South Africa ... 25
3.3 Water resource management by Municipalities ... 25
3.3.1 Granting of waste discharge permits... 26
3.3.2 Wastewater discharge charges ... 26
3.4 Ethekwini industrial effluent permitting system ... 26
3.4.1 Duty to apply for a Trade Effluent permit. ... 27
3.4.2 Application of a trade effluent permit: ... 27
3.4.3 Processing of application for a trade effluent permit: ... 28
3.4.4 Payment for the use of the sewage disposal system: ... 28
3.4.5 Trade effluent charges when sewage rates rates are applied: ... 29
3.4.6 Sewage disposal charge when a tariff rate is applied: ... 30
3.4.7 Trade effluent charge when tariff rate is applied: ... 30
3.4.8 Calculation for additional charge for high strength effluent to the sewage disposal system: ... 30
3.4.9 Volume of trade effluent determined: ... 31
3.5 Metro Trade Effluent Tariffs 2013/2014: ... 32
3.6 Summary ... 33
promoting Sustainable development ... 34
4.1 Sustainable development ... 34
4.2 Concepts to achieve sustainable development ... 35
4.2.1 Cleaner production: ... 35
4.2.2 Waste Management Hierarchy ... 36
4.3 Resource Efficient and Cleaner Production ... 38
4.3.1 Resource Efficient and Cleaner Production Assessment Methodology ... 39
4.4 Materials efficiency ... 46
4.4.1 Methodology to improve material efficiency: ... 46
4.5 Summary ... 50
Case Study ... 51
5.1 Objectives: ... 51
5.2 Methodology of assessment ... 52
5.3 Assessment procedure ... 52
5.3.1 Phase 1: Planning and Organisation ... 52
5.3.2 Phase 2 & 3: Assessment Procedure ... 52
5.3.3 Step 4: Option generation ... 87
5.3.4Step 5: Feasibility analysis ... 96
Chapter 6: Conclusions ... 97
Chapter 7: Recommendations: ... 100 Appendix A ………...A1 Appendix B ………...B1 Appendix C ………...C1 Appendix D ………...D1 Appendix E ………...E1
LIST OF FIGURES
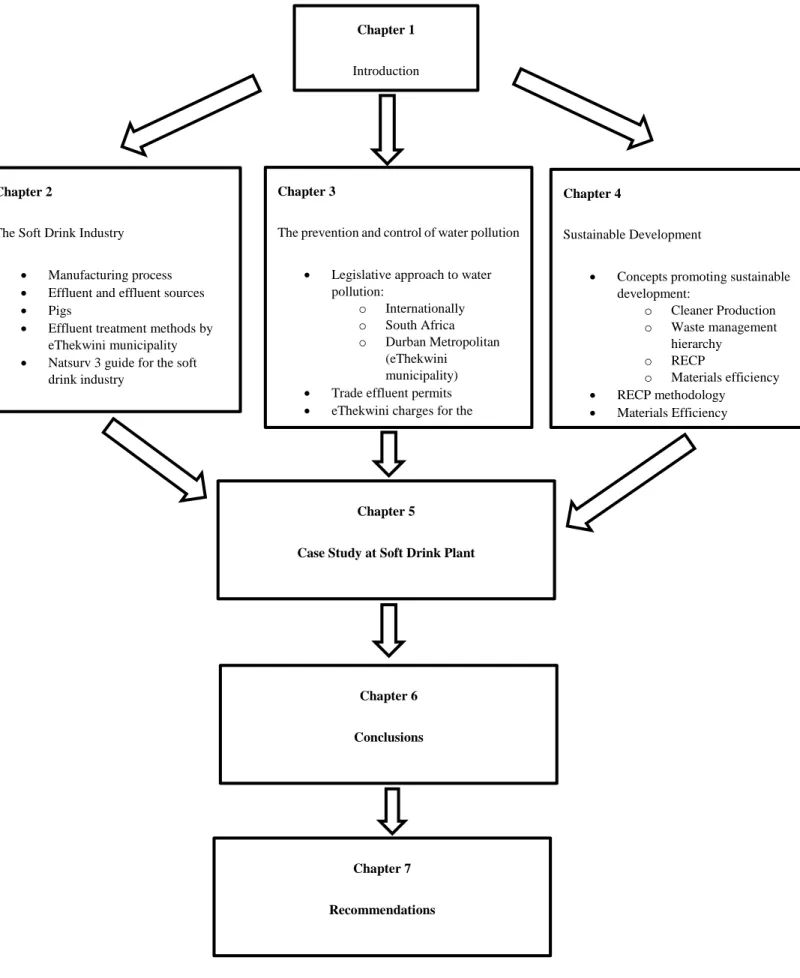
Figure 1: Thesis structure showing the relationship between the chapters ... 7
Figure 2: Typical process flow diagram illustrating the manufacture of carbonated soft drinks ... 8
Figure 3: Waste management Hierarchy ... 36
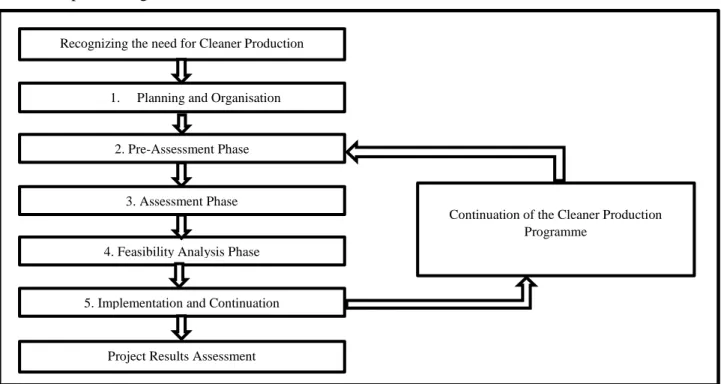
Figure 4: Diagram showing the phases of the Resource Efficient and Cleaner Production Assessment Methodology ... 39
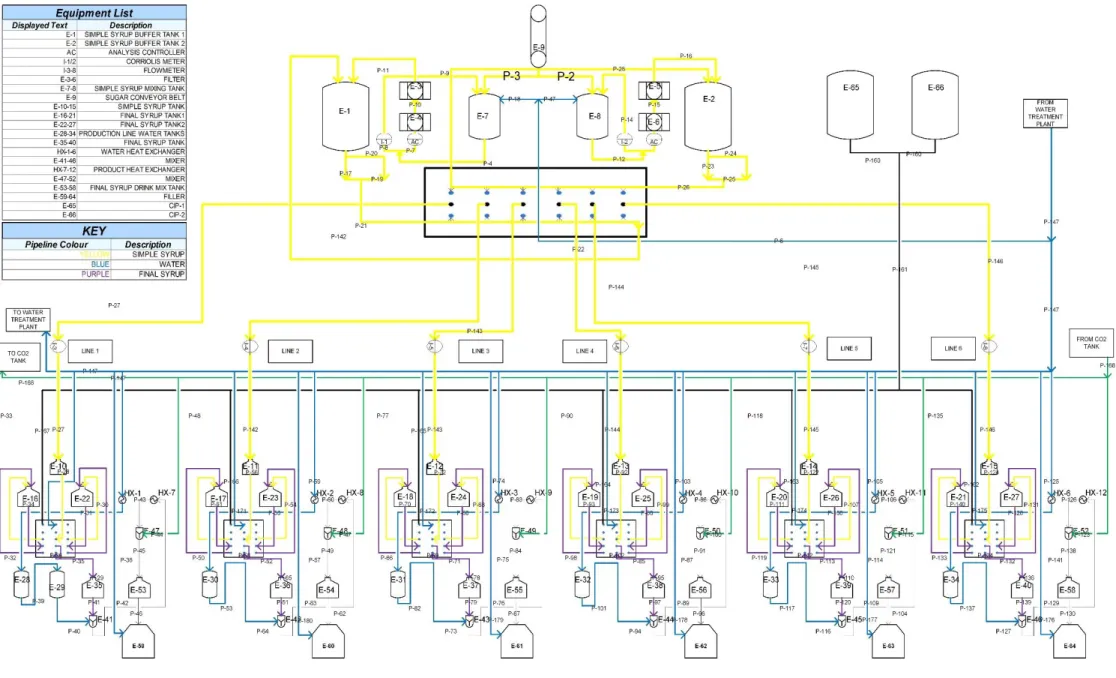
Figure 5: Water treatment process flow diagram of factory A ... 55
Figure 6: Process flow diagram of sugar room and wet section of factory A ... 56
Figure 7: Site Drainage Plan, Company A... 61
Figure 8: Close up view of the Site Drainage Plan ... 62
Figure 9: Monthly water consumption and Effluent charges, company A ... 63
Figure 10: Monthly specific water intake, company A... 64
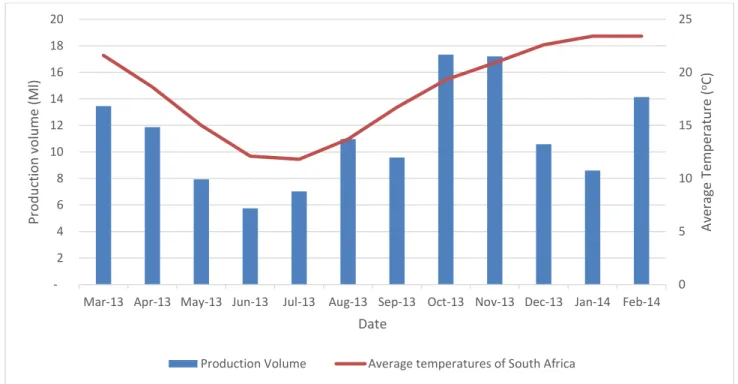
Figure 11: Monthly production volume and average temperatures for south africa... 66
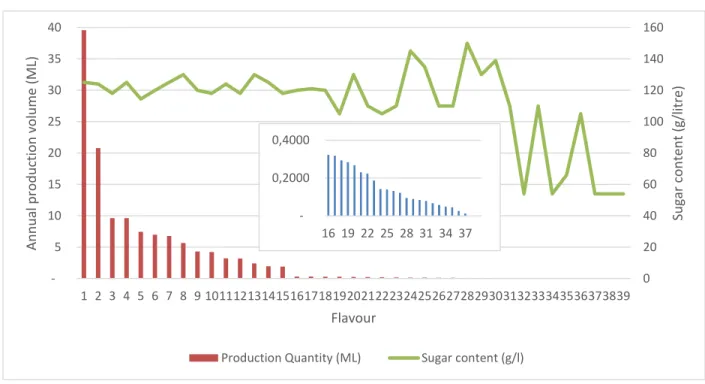
Figure 12: Annual production volume and sugar content of each flavour, company A. The insert graph shows the production volume of flavours 16-39 ... 67
Figure 13: Calculated monthly sugar loss and cumulative sugar loss ... 71
Figure 14: COD concentration of the effluent samples. The average COD concentration of the effluent is 14.57 g/l. The total number of samples is 825. ... 72
Figure 15: Laboratory test results for the trade effluent of Company A, obtained from eThekwini Municipality ... 73
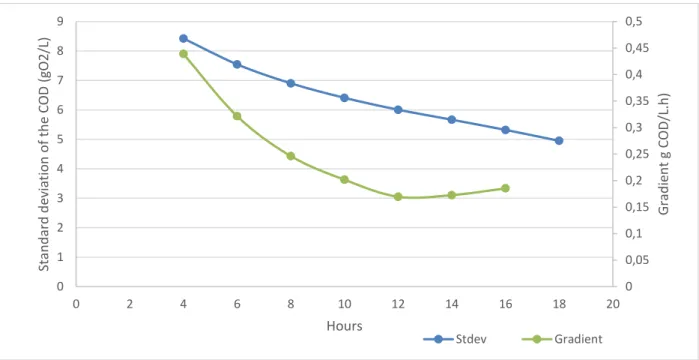
Figure 16: COD Sensitivity plot for the determination of the optimum time period of composite sampling ... 75
Figure 17: Quantification results of final syrup disposed from the final syrup buffer tank of each
production line ... 81
Figure 18: Simple syrup losses quantification results and COD load of the losses ... 82
Figure 19: Proposed Buffer system 1... 92
Figure 20: Proposed buffer system 2 ... 93 Figure E1: Proposed site drainage plan, Company A ... E18 Figure E2: Close-up view of the proposed drainage site plan ... E19
LIST OF TABLES
Table 1: Effluent sources and their impact on specific quality parameters ... 17
Table 2: Pig Usage Criterion on, 2002, Tiratsoo, 1992, Ashurst, 2008) ... 18
Table 3: Summary of various parameters in the Natsurv 3 guide ... 21
Table 4: Regulatory and monitoring charges ... 32
Table 5: Tariff charges for established rates X, V and Z ... 32
Table 6: Diagram showing the phases of the Resource Efficient and Cleaner Production Assessment Methodology (United Nations Environment Programme, 2014c) ... 39
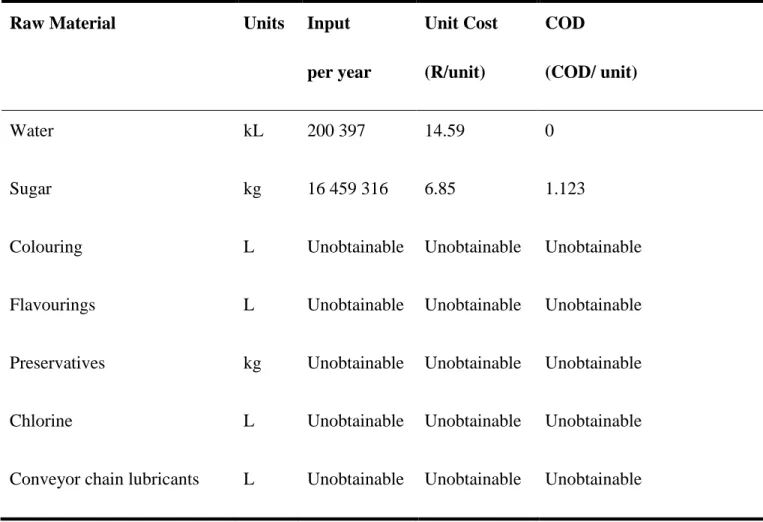
Table 7: Raw materials list (inputs) ... 66
Table 8: Raw materials input with cost and COD for the year 2014, company a ... 69
Table 9: Quantification of waste sources ... 86
Table 10: Cost of product and primary raw materials to drain from the various waste sources identified per month ... 87 Table A1: Monthly water consumption and trade effluent charges ... A1 Table B1: Monthly production figures………...B1 Table B2: Monthly production volume and avergae temperatures of South Africa ……... B2 Table B3: Annual production volume and sugar content for each flavour, Company A…………B3 Table C1: Molecular weights of components……….C1 Table C2: Sugar balance and COD loading………...C2 Table C3: Quantification of conglomerated sugar disposed as solid waste………....C3 Table D1: Data analysis of the chemical analysis data……….D1 Table D2: EThekwini effluent lab test results ... ………D2
Table E1: Measure volume of final syrup drained from the final syrup buffer tank of each production line………...E1 Table E2: Measured volume of final syrup drained from final syrup tank of the drink mix of each production line ………..E2 Table E3: Final syrup quantification and flavour changes for each production line……...E2 Table E4: Simple syrup quantification results………E3 Table E5: Quantification of dumped batches……….…E3 Table E6: Number of flavour changes produced for a single month for each production line……….E3 Table E7: Volume of the drink mix tank of each line……….….E4 Table E8: Number of batches produced on production line 1……….E4 Table E9: Number of batches produced on production line 2………...E4 Table E10: Number of batches produced on production line 3………...E5 Table E11: Number of batches produced on production line 5………...E5 Table E12: Number of filler nozzles (heads) in each production line………...E6 Table E13: Time required to produce various batch sizes for 0.3 l product, line 2………..E6 Table E14: time required to produce various batch sizes for 0.5 l product, line 2…………...E7 Table E15: Time required to produce various batch sizes for 1.25 l product, line 2………E8 Table E16: time required to produce various batch sizes for 1.5 l product, line 2…………...E9 Table E17: Time required to producevarious batch sizes for 2L product, production lines 1,2 and 3………...E10 Table E18: Time required to produce various batch sizes for 2L product, production line 5………...E11 Table E19: Production schedule line 1……….E12 Table E20: Production schedule line 2……….E13
Table E21: Production schedule line 3……….……E14 Table E22: Production schedule production line 5……….…..E15 Table E23: Under-fills and over-fills quantification results……….E15 Table E24: Raw data for percentage remaining in the filler bowl……….E16 Table E25: Filler bowl volumes for each production line……….E17 Table E26: Quantification of filler bowl losses………E17
i
ABBREVIATIONS
CSD Carbonated soft drinks
CIP Clean in place
COD Chemical Oxygen Demand
CO2 Carbon dioxide
DNA Deoxyribonucleic acid
DWAF Department of Water Affairs and Forestry in South Africa
EWS eThekwini Water and Sanitation department
NCPS-SA National Cleaner Production Centre South Africa
NO2 Nitrogen dioxide
PET Polyethylene terephthalate
QA Quality Assurance
QC Quality Control
RECP Resource efficient and cleaner production
SWI Specific water intake
UN United Nations
UV Ultraviolet
TSS Total Suspended Solids
ii
GLOSSARY
Activated carbon A form of carbon pre-treated to enhance its adsorption properties. It is used in the pre- treatment of water to remove undesirable substances
Aerobic Indicates that atmospheric oxygen is required
for the growth of microorganisms
Anaerobic Indicates that atmospheric oxygen is not
essential for the growth of microorganisms
Backwashing The flow of water in the reverse direction to
its normal operation through filtration equipment
Brix The measurement scale on a mass basis, used
to describe the percentage of sucrose dissolved in an aqueous solution; it is expressed as (oBrix)
CIP (Clean-in-place) The system of sanitising or cleaning
equipment without dismantling it. It is done by the circulation of either sanitising agents or detergents and water
Coagulation/flocculation The process where suspended solids are removed from water
Density The mass of a certain volume of liquid
Disinfection The complete removal of pathogenic
microorganisms and the reduction of non- pathogenic substances to adequate limits, in raw water
Enhanced filtration A filtration process designed for the removal of matter at molecular level
Final Syrup A syrup that contains all the base ingredients
used in the production of soft drinks
iii
Ion exchange A water treatment system where unwanted
ions are removed from the water by exchanging them with other ions
Membrane filtration A separation process where materials are forced through a membrane due to a pressure differential
Microorganisms A wide variety of living organisms that are of a microscopic size
Multiple barrier water treatment An ordered series of processes that reliably removes unwanted substances in raw water to a satisfactory level
Osmosis The process where the driving force for
molecules to move through a permeable membrane is a concentration differential
Pathogen A disease causing microorganism
PET (Polyethylene terephthalate) The chemical compound used to produce PET bottles
Polishing filter Filtration equipment that is designed to remove particulate matter which was carried over from the previous filtration processes
Potable water Water that is safe to drink and has
specifications according to the local health authorities
QA (Quality assurance) The authority responsible to ensure a desired level of quality in the product
QC (Quality control) The authority that maintains the required standards in manufactured products by performing tests on the product and
comparing it against the established quality standards
Raw water Water supplied to a soft drink production
facility
RTD (Ready to drink) The beverage that can be consumed without further dilution with water
iv
Sanitizing The elimination of pathogens and reduction of
microorganisms to an acceptable level on processing equipment
Simple Syrup The solution of a sweetener and treated water
Sucrose A crystalline disaccharide consisting of
glucose and fructose, which is extracted as sugar from either sugar cane or sugar beet Syrup proportioning The process in which final syrup in mixed
with treated water in the required ratio
Treated water Raw water that has underwent treatment and
is of acceptable standards
Ultraviolet irradiation The non-visible part of sunlight that has wavelengths shorter than those of ordinary;
commonly known as UV light
1
INTRODUCTION
Water is essential to life, to social development and to economic progress (Department of Water and Sanitation, 2012).
Water is life, respect it, conserve it, and enjoy it (Department of Water and Sanitation, 2012).
The Constitution of South Africa guarantees the people of South Africa the right to access to sufficient water, and the right to an environment that is not harmful to their health or well-being (South African Government, 1996).
The amount of water on earth is constant and hence cannot be decreased or increased. South Africa is a semi-arid, water stressed country which receives an average annual rainfall of 492 mm while the rest of the world receives an average annual rainfall of 985 mm. South Africa is regarded as the 30th most water scarce country in the world (National Water Research Strategy, 2012), where about 65% of the country receives less than 500 mm per year, while approximately 35% of the country receives less than 200 mm per year (South African Government, 2012). A total of 80% of the rainfall occurs during summer. South Africa’s rainfall is unevenly distributed as well as unreliable and unpredictable and is mainly influenced by moist air moving from the Indian Ocean (east) to the South East. Large fluctuations in the average rainfall are recorded but usually remain well below the global average. The three major challenges that affect water availability are (Department of Water and Sanitation, 2014b):
Uneven spatial distribution and seasonality of rainfall. In other words 43% of the total rain falls on just 13% of land in the country.
Relatively low stream flows in the rivers majority of the time.
Major urban and industrial developments being located far from the large water courses, causing transfers of large quantities of water across catchments.
Surface water resources are the primary source of water in South Africa where its availability is about 49 200 m3 per annum (Department of Water Affairs, 2014). Groundwater only provides 10%
of this volume but is only extensively used in rural and arid regions. Return flows which are flows
2 returned to streams by industries also contribute. The six main water use sectors are irrigation, urban use, environmental reserve, rural use, mining and bulk industrial, power generation and afforestation. The total water requirement for all these sectors is 280 million m3. In South Africa as a whole a surplus of water exists, however locally, many areas constantly experience water shortages as a shortfall exists in specific water management areas (Department of Water Affairs, 2014).
The increasing demand for water in South Africa arises from the rapid growth of the population, the nature of the economy, standards of living, urbanisation and economic growth and has to be met from limited resources (Department of Water and Sanitation, 2014b). Additional pressures on the limited water resources are also being exerted by greater pollution loads and reduced flows in the countries rivers (Department of Water and Sanitation, 2014b). Industrial water usage results in large amounts of water being used resulting in the resource being more scarce and costly. Water intensive industrial processes are textile, cooling water processes and the beverage or soft drink industry (where water is used in the product itself). South Africa uses more than 50% of its available water while other neighbouring countries, namely Namibia and Botswana only use about 5-10 % of their available water (Pandey, 2003).
South Africa’s policy and regulation regards water as a public commodity and promotes sustainable development. The Water Act (Act 36 of 1998) emphasizes the conservation of this asset as well as the most efficient usage of it in public interest. Many environmental Acts have been written with the intention of protecting the people of South Africa and its environment. These laws also assist government in advocating pollution prevention.
The quality of raw water continues to deteriorate due to illegal discharges and inadequate effluent treatment resulting in eutrophication and organic pollution (CSIR, 2010). The soft drink industry in South Africa is a major water user and polluter and is being motivated to reduce both water consumption and organic loads.
“Soft Drink” is a common name given to a non-alcoholic beverage which is consumed chilled.
There are many categories of soft drinks such as carbonates, juices, still drinks, dilutables and bottled waters. Carbonates are also commonly called carbonated soft drinks (CSD) which is a drink containing gaseous carbon dioxide also commonly called “Cold Drinks” in South Africa.
3 Noncarbonated soft drinks do not contain carbon dioxide and consist of drinks such as fruit drinks, health beverages and sports and energy drinks. In the last few decades the popularity of bottled waters (still, flavoured, unflavoured, carbonated and with or without natural sugars) increased drastically. These products are commonly made from natural spring waters or water sources that have high mineral content, or where these minerals are added during the manufacturing process.
Dilutables are products that are concentrated like cordials or squashes, that are normally reconstituted by the consumer (by dilution) to make the beverage into a ready to drink (RTD) form (Shachman, 2004).
Juices and nectars are primarily made using natural fruit juices. Juices contain 100 % pure fruit juice and can be sweetened while nectars contain 50% natural juice content and are always sweetened to make up for the non-juice fraction of the drink (Shachman, 2004).
There is a global soft drink consumption of 608 billion L per annum, indicating the huge impact that this industry has on the world economy. Another statistic indicates that every person on earth drinks 70 L of soft drink per year. For a family of 5 this implies the consumption or purchase of approximately 1 L of soft drink per day (Shachman, 2004).
Carbonated soft drinks make up approximately half of the soft drinks consumed in the world and therefore this project primarily focusses upon this category of soft drinks.
The Natsurv 3 guide (1987) was developed as a guideline to reduce water intake and to promote better management of industrial waste in the soft drink industry. The Natsurv 3 guide also contains norms and targets for certain aspects of the soft drink industry including; water intake and waste water disposal. The guide also describes best practices that could be used to achieve the targets set. One of the targets set is for the Specific Water Intake (SWI) which is 2.3 L water/L product.
To complete the practical component of this dissertation, a study was conducted at a soft drink factory (Company A). This company had been experiencing trade effluent charges in excess of R 70 000 per month resulting in fines being levied by the local municipality (eThekwini Municipality). This was due to the company being consistently out of specification with respect to COD and sugar concentration of the effluent. The company was also pressured by the eThekwini municipality to make significant improvements with regards to the effluent COD else their annual
4 trade effluent permit will not be renewed. Company A has a Specific Water Intake (SWI) of 1.54 L water/L product which is which is well below the target set in the Natsurv 3 guide.
Sustainable development is defined as Development that meets the needs of the present generation without compromising the ability of future generations to meet their own needs (International Institute for Sustainable Developement (IISD), 2010). In order to assist in the achievement of sustainable development, many diverse concepts have been developed, such as; pollution prevention, waste minimisation, eco efficiency or green productivity. The Resource Efficient and Cleaner Production (RECP) concept is a broad term that is based on the concept of cleaner production and incorporates all of the aforementioned concepts.
A local consulting firm that specialises in wastewater management was hired in order to mitigate the effluent problem at Company A. Two end-of-pipe treatment options were recommended by this firm as the only treatment options to reduce the COD of the effluent to an acceptable standard.
The first treatment option entailed the design and installation of an anaerobic treatment plant with a capital cost of R 7.8 million. The alternate recommended option was the design and installation of an aerobic plant with a capital cost of R 4.6 million and operational costs of more than R 600 000 per annum. Besides these capital and operating costs required for these treatment options, no space is available on the site at Company A to implement these recommendations.
Therefore senior management initiated a study into identifying the source of the high COD effluent streams and options for reducing this at source.
5 1.1 OBJECTIVES
This research project is bipartite, with a theoretical and practical component. The theoretical part of this project includes the following:
Overview of the soft drink industry and the processes involved in the manufacturing of soft drinks
Overview of effluent characteristics and sources in the soft drink industry
Environmental legislation pertaining to the disposal of trade effluent
The concept of sustainable development and the relevant internationally recognised methodologies that can be used to achieve this
Resource Efficient and Cleaner Production (RECP) concept and methodology
Materials efficiency concept and methodology.
The practical component of this study involved selecting a soft drink factory (Company A) as a case study to reduce its environmental impact by applying the RECP and materials efficiency techniques.
The goals of this project include:
The assessment of a soft drink plant to reduce its environmental impact by:
Identification and quantification of effluent sources
Investigating the factors that influence volume and composition of the effluent discharged
Identifying opportunities to reduce the effluent discharge
Producing a conceptual design to minimize effluent charges.
Prove that the application of the RECP and materials efficiency assessment procedures in the soft drink industry result in environmental and economic advantages.
6 1.2 THESIS STRUCTURE:
Chapter 1: Introduction, scope of the project and list of objectives
Chapter 2: An overview of the manufacturing processes involved in the production of soft drinks Chapter 3: The prevention and control of water pollution, permitting system and requirements and trade effluent tariff charges
Chapter 4: Sustainable development and internationally recognised concepts promoting sustainable development. The concepts of resource efficiency and cleaner production and materials efficiency and their assessment methodologies.
Chapter 5: Case study
Chapter 6: Conclusions and Recommendations
The link between the different chapters can be seen in Figure 1. The introduction provides an insight into; the water situation in South Africa, the concept of sustainable development, the soft drink industry and the project background. Chapters 2, 3 and 4 provide the necessary information to facilitate an understanding of the soft drink process, the legislative requirements and the concepts utilized, which will in turn allow for an enhanced appreciation for the case study and the solution strategies developed within. The conclusions and recommendations link the various chapters.
7
FIGURE 1: THESIS STRUCTURE S HOWING THE RELATIONSHIP BETWEEN THE CHAPTERS.
Chapter 1
Introduction
Chapter 3
The prevention and control of water pollution
Legislative approach to water pollution:
o Internationally o South Africa o Durban Metropolitan
(eThekwini municipality)
Trade effluent permits
eThekwini charges for the disposal of effluent
Chapter 4
Sustainable Development
Concepts promoting sustainable development:
o Cleaner Production o Waste management
hierarchy
o RECP
o Materials efficiency
RECP methodology
Materials Efficiency methodology Chapter 2
The Soft Drink Industry
Manufacturing process
Effluent and effluent sources
Pigs
Effluent treatment methods by eThekwini municipality
Natsurv 3 guide for the soft drink industry
Chapter 5
Case Study at Soft Drink Plant
Chapter 6
Conclusions
Chapter 7
Recommendations
8
THE SOFT DRINK INDUSTRY
A soft drink is described as a non-alcoholic beverage usually carbonated (but not necessarily) that typically contains carbonated water, sweetener, edible acids and natural or artificial flavours. The production principally consists of the blending of a concentrate and additives with water (Shachman, 2004).
2.1 THE PRODUCTION PROCESS OF CARBONATED SOFT DRINKS
A typical process flowchart for the manufacture of carbonated soft drinks is shown in Figure 2.
There is a slight variation in the processes from plant to plant but the major process steps are basically the same, and are discussed in this section.
FIGURE 2: TYPICAL PROCESS FLOW DIAGRAM ILLUSTRATING THE MANUFACTURE OF CARBONATED SOFT DRINKS (WATER RESEARCH COMMISSION, 1987).
De-aeration
Bottle Washing Carbonation & Blending & Filling
Operations
Crowning &
Labelling
Packaging Water
Treatment
Simple syrup preparation
Syrup
Sugar
Final syrup preparation
Base Ingredients
Storage
9 2.1.1 WATER TREATMENT
Water treatment is the key process in the manufacturing of soft drinks as water is the primary component of soft drinks, contributing from 87% to 92% in a typical soft drink (Shachman, 2004).
Therefore the quality of the water used must meet very stringent standards as it has a serious impact on the taste and appearance of the drink as well as its physical and microbiological stability on the shelves in stores. These standards ensure consistent taste and quality of the soft drink and eliminate the risk to the consumer and the manufacturer (Hui, 2006, Steen and Ashurst, 2008).
Raw water is usually obtained from two main sources, namely the municipality or a private well owner, who render the water potable and fit for human consumption. This water may, however, have components or characteristics that could negatively affect the quality of the beverage, and therefore it is essential to either remove or neutralize their effect. Possible adverse factors of raw water include but are not limited to suspended matter, chemical composition, microorganism content and source water quality variations. In addition municipal water treatment plants can encounter operation problems and contamination could occur before reaching the end user. The manufacturer cannot afford to use water of a substandard quality even in a single batch produced.
Therefore, raw water must always be treated to meet the specification established by the soft drink manufacturer (Shachman, 2004, Steen and Ashurst, 2008).
2.1.1.1 WATER TREATMENT TECHNOLOGY
In designing a water treatment plant and selecting the grade of technology required, the following factors regarding the raw water supplied to the soft drink manufacturer are essential to consider (Shachman, 2004):
Consistency of the quality
Standard levels of the adverse factors of raw water
Whether contamination can occur
Seasonal changes in the composition and characteristics
The type of final product to be produced
10 2.1.1.1 a) The Multiple Barrier System Concept
The concept of multiple barriers is the core of the production OF treated water for the use in soft drinks. A Multiple Barrier System is an integrated system of procedures, processes and tools that reduce or eliminate adverse factors by providing a high level of performance such that it meets the required specification even if the single most effective unit operation fails. The barriers are usually selected such that the removal capabilities of the different unit in the treatment process are duplicated. This allows for sufficient assistance for continuous operation and when fluctuations in performance occur. The multiple barrier principle is applied in the soft drink water treatment to combine different processes of which the end result is the highest quality water at the minimal cost (Shachman, 2004).
The basic processes required in a multi barrier water treatment system are discussed in this section.
Only the full combined effect of each process results in the highest quality water (Shachman, 2004).
(i) Enhanced filtration:
Enhanced filtration is the most crucial process of the Multiple Barrier Water Treatment System. It is filtration at a molecular level capable of removing minute matter and a variety of suspended matter and dissolved chemicals. There are two main types of enhanced filtration processes, namely; coagulation/flocculation and membrane filtration (reverse osmosis, microfiltration and
nanofiltration) (Hui, 2006, Shachman, 2004).
(ii) Alkalinity reduction:
Raw water commonly contains bicarbonates, carbonates of calcium, carbonates of magnesium and sodium that are soluble in water and contribute to the alkalinity. Alkalinity reduction is only necessary if the raw water has an alkalinity of above 100 mg/L expressed as calcium carbonate (Steen and Ashurst, 2008). Hydrated lime treatment is the most commonly used process for alkalinity reduction. Hydrated lime or “slaked lime” is added to raw water to chemically react with substances that cause the high alkalinity (calcium and magnesium bicarbonates), which then precipitate forming an insoluble sludge which can be removed from the water (Mitchell, 1990, Steen and Ashurst, 2008).
11 (iii) Disinfection:
Disinfection is aimed at the removal, deactivation or killing of pathogenic microorganisms present in the raw water and the reduction or preferably elimination of non-pathogenic microorganisms.
Disinfection can be accomplished via means of physical or chemical disinfectants. These agents also remove organic contaminants which are nutrients for the microorganisms. A range of disinfectants are available for soft drink water treatment applications, the three most common disinfectants being: chlorination, ozone treatment and ultraviolet radiation (Hui, 2006, Shachman, 2004, Steen and Ashurst, 2008).
Ultraviolet Irradiation
Ultraviolet irradiation also known as UV light is the non-visible portion of the sunlight. UV radiation energy waves have a length in the range of 100-400 nm long and exist between X-ray and visible light in the electromagnetic spectrum. UV light can be produced commercially by custom built lamps which either utilize mercury or xenon sources for disinfection purposes. For the inactivation of microorganisms, the microorganisms must be exposed to a particular intensity of UV irradiation, for a particular period of time, known as the exposure time. The microorganism’s genetic material absorbs the UV radiation which causes the chemical disruption of the deoxyribonucleic acid’s (DNA) chemical bases. This leaves the microorganism unable to replicate its DNA and hence unable to reproduce and multiply.
The germicidal effect provided by UV light is rapid and happens within seconds and this makes the disinfection process applicable as the water flows through the piping in a multiple barrier water treatment system. The UV light disinfection unit in the form of a reaction chamber is, therefore, positioned in the piping system of flowing water.
12 The effectiveness of UV Light for disinfection:
UV light has the potential to destroy a wide range of microorganisms provided that the feed water into the UV unit is suitably treated. UV disinfection systems are primarily used to their full potential in two different situations:
for the disinfection of any stored treated water that is to be used in the succeeding step of a multiple barrier water treatment system
as the last step in the system (before the water is transported to the filling operation) as a precautionary measure to disinfect fully treated water after the polishing filter.
(iv) Activated carbon purification
Activated carbon is a common support technology. Support technology is described as ancillary unit operations that are not part of primary treatment but serve rather to supplement the primary treatment, transforming it into a durable treatment chain that provides the required quality of water for the food and beverage industries (Parker and Litchfield, 1962). Activated carbon is formed from a range of various carbon rich starting materials such as; coal, coconut shells, wood and peaches pits. The carbon purifier commonly known as a carbon filter is a one of pieces of equipment in a multiple barrier water treatment system. Its structure is very similar to a pressure sand filter.
(v) Polishing filtration
Polishing filters are regarded as imperative in multiple water treatment systems. It acts as a microfilter with the primary function being to remove any carbon granules (from carbon filter), sand particles, flakes, scale or rust that may exist in the water (Shachman, 2004, Steen and Ashurst, 2008).
The objective of polishing filtration is to achieve clear clean treated water for the manufacture of soft drinks and it is therefore placed subsequent to the carbon filter and preceding the final product filing line (Shachman, 2004, Steen and Ashurst, 2008).
13 2.1.2 SIMPLE SYRUP PREPARATION
The syrup room is dubbed ‘the heart’ of the beverage plant. This is due to the enormous influence of the efficiency of syrup room operations in the profitability of the plant, and the importance of the simple syrup. The syrup room operations are responsible for the preparation of the high strength simple syrup, to which additives will be added, whereafter proportioning will occur to produce the final product. The simple syrup is prepared by the dissolution of sugar or sweetener in an agitated tank. Modern agitated tanks are fully enclosed, wholly stainless steel tanks, fitted with manholes, sight glasses, spray balls, high level and low level probes and mechanical agitators. A coarse screen is also present to prevent the addition of agglomerated sugar lumps and other coarse matter. A micro-filter (50 µm pore size) is employed at the exit of the agitated tank to remove any particulate impurities (carbonized particles, undissolved sugar, foreign particles etc.). Newer syrup rooms generally employ a large buffer tank to maintain economies of scale in the syrup making process.
Considerations for the optimal design of a syrup room are dominated by hygiene-related concerns, but include ease of dissolution of sugar and corrosive conditions (Mitchell, 1990, Shachman, 2004, Steen and Ashurst, 2008). Pertinent aspects of the syrup room include (Mitchell, 1990):
Construction - Wall finishes, tiling and ceilings must be corrosion resistant, to be able to withstand corrosive conditions due to the use of detergents during cleaning procedures.
Air conditioning – Adequate ventilation is necessary to reduce airborne contamination.
Air-conditioning is recommended to allow for filtering of the ambient air, and to decrease the prevalent relative humidity to aid in dissolution.
Syrup aeration- To prevent the aeration of the simple syrup, water is first added to the tank to fully submerge the agitator prior to the commencement of mixing. The location of the agitator (at the bottom of the tank) thus serves to allow for the preparation of smaller batches of simple syrup in times of low demand. Ingredient pipework is also generally constructed to run down the sides of the tank to prevent excessive aeration.
Pipework design – Pipelines are designed to exclude the possibility of the formation of fluid pockets and stagnant zones, which in turn prevents microbial spoilage and syrup contamination by the detergent. The fluid flow velocity should not be excessively high, to prevent mechanical bruising of the syrup.
14 2.1.3 FINAL SYRUP PREPARATION
The final syrup is prepared by the addition of the base ingredients (preservatives, flavourants etc.) to the simple syrup mixture. This is usually achieved through the use of a separate agitated tank on each production line. The order of addition of the ingredients is of critical importance in the attainment of a clear, uniform final syrup. The first addition should is the requisite quantity of sodium benzoate, the sodium salt of benzoic acid, which is a preserving agent. Sodium benzoate is only sparingly soluble in water, and it converts to its undissociated, antimicrobial, preservative state at pH values lower than 4.5. It is thus desirable that the undissociated state be induced separately for each dispersed molecule, to avoid the possibility of a gelatinous cloud forming. The general sequence of the addition of base ingredients is sodium benzoate, citric acid anhydrous and thereafter flavourants. The solution is then filtered (250 µm) is then to remove any caked material, which can be ground and re-mixed into the solution (Hui, 2006, Mitchell, 1990).
2.1.4 BLENDING
Blending (proportioning) involves diluting the final syrup with water, in order to obtain a solution suitable for packaging after subsequent de-aeration and carbonation steps. The most common proportioning system (Mojonnier proportioner) uses a control system, comprising of a fixed and variable orifice for the syrup and water feed lines respectively. Float valves are also incorporated in order to provide a constant head in the supply lines. Such systems are however susceptible to the production of off-spec portions, particularly at the start and end of the batch. Modern systems employ dosing pumps or metering systems which are capable of mitigating such issues through highly complex control systems (Mitchell, 1990, Steen and Ashurst, 2008).
15 2.1.5 DEAERATION AND CARBONATION
De-aeration and Carbonation are the subsequent requisite steps to produce the final product. The addition of carbon dioxide increases the palatability and aesthetic appeal of the product, imparting a fizzy, sparkly appearance to the drink. De-aeration is required to remove dissolved oxygen to decrease potential spoilage problems (to increase shelf-life) and to increase the volume available for carbonation, thereby decreasing filling issues. De-aeration is typically geared toward reducing dissolved air to below 0.5 ppm, through the use of either vacuum or reflux de-aeration, or a combination of the two methods. Vacuum de-aeration involves the removal of air through the atomization of the water in a vacuum tank, followed by the use of a stripping gas (CO2 or N2) to remove most residual oxygen. Reflux de-aeration involves applying a positive pressure of CO2 in a sealed vessel to induce nucleation, where the CO2 binds to the dissolved air and is then liberated.
Carbonation is generally achieved through the use of plate carbonators, which allow the solution to be spread over chilled plates in a constant pressure carbon dioxide atmosphere. The cooling of the solution allows for increased gas absorption, while the thin plates allow for increased surface area for both cooling and gas (CO2) contact. Any dissolved air that may bind to the carbon dioxide is simply bled off. Other carbonator designs include the atomization of the water into a positive pressure carbon dioxide atmosphere, or injection of carbon dioxide, and subsequent dispersion thereof, into the water (Hui, 2006, Mitchell, 1990, Steen and Ashurst, 2008).
2.1.6 FILLING
Filling of the carbonated final product is achieved through the use of a filler, which may utilize gravity filling, or counter pressure filling. Modern counter pressure fillers have found wide industrial usage, although older systems are still used in many cases. The counter-pressure filler initially creates a seal at the container opening, whereafter the atmospheric air in the container is displaced by pressurized gas from the filler bowl. In newer systems, the container air is vented to the atmosphere, while in older systems, the air enters the headspace to be vented. Upon equalization of the pressure of the filler bowl headspace and the container, the gas valve is closed, and the liquid valve is opened to commence filling. Filling is stopped when the pressures are equal, whereafter a settling period, and then ‘snifting’ occurs prior to capping. Snifting is the process whereby excess headspace gas within the container is vented in a controlled manner by the filler,
16 in order to prevent fobbing/excessive frothing upon the release of the container from the filler bowl seal (Mitchell, 1990, Steen and Ashurst, 2008).
2.1.7 CAPPING, LABELLING AND PACKAGING
The bottles filled with carbonated product are sealed with caps then labelled. Canning plants make use of seamer machines to seal the cans. The final product is then thoroughly inspected before being shrink wrapped and placed on pellets. The product is then distributed to the retailer (Mitchell, 1990, Water Research Commission, 1987).
2.2 EFFLUENT GENERATION IN THE SOFT DRINK INDUSTRY
The effluent from a soft drink bottling plant consists of highly concentrated syrup, wasted soft drinks, water from the rinsing of cans and bottles, detergents and lubricants that are sparingly used in some unit operations (Wang et al., 2005). The primary contaminant in the effluent is sucrose.
Such contaminants give rise to high organic contents and other significant wastewater pollutants (Total Suspended Solids (TSS), Chemical Oxygen Demand (COD), sodium, nitrates and phosphates) (Wang et al., 2005, Klemes et al., 2008).
2.2.1 EFFLUENT SOURCES
Effluent is generated from processes areas, such as; washing and rinsing of syrup preparation equipment, washing and rinsing of returnable bottles, washing and rinsing filling and blending unit operations. The preparation of concentrated syrups is the most polluting process as it generates effluent that is rich in sucrose. This effluent typically contains a COD concentration of between 3 110 and 6 000 mg O2/L, with an average of 4 500 mg/L (Ait Hsine et al., 2005). Table 1 lists the sources of effluent in the soft drink industry categorized by production activity and the impact of each of these production activities on various quality parameters of the effluent. Other sources of effluent are those that occur due to spillage and housekeeping operations (Porges and Struzeski, 1961).
17
TABLE 1: EFFLUENT SOURCES AND THEIR IMPACT ON SPECIFIC QUALITY PARAMETERS.
(+ + Very strong impact, + strong impact, - weak impact) (AIT HSINE ET AL., 2 005)
2.2.2 PIGS
A ‘pig’ is a device, fabricated from food-grade silicone or a suitable non-newtonian material that serves to clean the pipes (displacement of residual liquid and cleaning of pipe surfaces) and/or provide information about the condition of the pipe (Ashurst, 2008). This is achieved by driving the pig through the length of the pipeline, from the docking station to the destination pigging station (and back), by means of a conveying medium. The design of the pig allows for a seal to be created at the pipe wall, allowing for enhance cleaning ability of the pig. The conveying medium could be either water or product. The pig is generally designed to navigate through bends and other pipeline complexities, although the exact complexities of the pipeline system are a consideration in the selection of a suitable pig (Davidson, 2002). Advantages of pigging include faster product changeovers and decreased wastage leading to decreased effluent discharge (Ashurst, 2008).
Various designs (mandrel, single bolt, solid cast, foam etc.) have emerged since the 1960s discovery of pigging, and additions such as brushes, bidirectional seals and scrapers greatly enhance the cleaning effect of the pig. Proper selection of pigs should be done on the basis of experience within the industry, and the use of pigs. Manufacturers will, therefore, provide support regarding factors such as line type and complexities, length, material, condition, propelling
Impact on the raw wastewater
Production activity Flow COD pH
Washing and rinsing of final syrup equipment + ++ ++
Washing and rinsing of filling equipment + + +
Washing and rinsing of syrup filtration equipment + ++ -
Washing of activated carbon filter + - -
Washing of sand filter + - -
Regeneration of softener + - -
Regeneration of the de-carbonator + - -
Washing of simple syrup equipment + - ++
Washing of syrup storage tank - ++ -
Bottles washing - ++ -
Floors washing ++ ++ -
18 medium and the nature of the cleaning required (Davidson, 2002). The ‘clean ice pig’, developed by Bristol University, uses a non-Newtonian material to allow the pig to imitate a liquid flow pattern within the pipeline, thereby scraping the surface clean, and displacing any remaining fluid from the pipes (Ashurst, 2008). Table 2 lists the PIG usage criterion.
TABLE 2: PIG USAGE CRITERION (DAVIDSON, 2002, TIRATSOO, 1992, ASHURST, 2008).
Condition Applicability
Product suitability The fluidity (liquid flow profile) of both the product and CIP water enables the usage of pigs as a viable supplement to the CIP cleaning process.
Furthermore, valuable product is currently wasted by the CIP process, causing a loss of potential income and a large increase in effluent strength and COD loading.
Current cleaning procedure
Significant quantities of water are used in the CIP procedure. Pigging has the potential to drastically decrease the requisite quantity of water used during the cleaning procedure. This can be attributed to a lower quantity of remaining product in the pipelines after the suggested pigging procedure. The result of the implementation under this condition is that lower water consumption (costs) and effluent discharge rates will be resultant.
Losses of product As stated above (Product suitability), valuable product can be recovered from pipeline, instead of being flushed as effluent, resulting in multi-fold savings in terms of product losses, water consumption and effluent bills.
Production downtime
In peak production periods, cleaning related downtime proves problematic.
Pigging systems clear pipework much quicker than the current CIP procedure.
Pipework Suitability
Current pipework may be altered on the advice of pig suppliers. Addition of straight runs and replacement of valves are potential changes to the system.
19 2.2.3 MUNICIPAL WASTEWATER TREATMENT OPTIONS
The majority of soft drink plants in South Africa discharge effluent to sewer, further burdening an overworked municipal wastewater treatment works. Municipal wastewater treatment options include aerobic, anaerobic and prospective co-digestion wastewater treatment facilities. Aerobic treatment involves the use of aerobic microorganisms, which utilize dissolved oxygen in order to break down organic contaminants and nutrients within the influent water. The organic content of the water is thus measured as the oxygen demand, or the amount of oxygen required to breakdown the contaminants. The oxygen concentration is replenished, in order to maintain the process rate, through the use of (energy intensive) mechanical aerators. Products from the aerobic process are harmless and non-toxic. Anaerobic treatment involves the breakdown of organic contaminants through the use of anaerobic microorganisms. These microorganisms are able to survive and thrive in the absence of dissolved oxygen, using oxygen that is bound within dissolved salts (SO42-, NO3- etc.) (United States Environmental Protection Agency, 2014, Environmental Business Specialists, 2015, Loughborough University, 2013, United States Environmental Protection Agency, 2013).
Aerobic treatment provides fast ‘breakdown’ rates and is capable of removing dissolved nutrients and other less ‘simple’ wastes, in addition to organic wastes. Aerobic treatment however, is difficult to control, due to the large amount of sludge produced, and is quite costly to operate due to the required energy input. Anaerobic treatment is capable of removing only organic contaminants, at slow rates, but is easy to control and is capable of producing methane (an energy source) (Environmental Business Specialists, 2015, Loughborough University, 2013, United States Environmental Protection Agency, 2013).
The University of KwaZulu-Natal (UKZN) has embarked on a joint project with the eThekwini municipality, in order to fully utilize the current anaerobic digester capacity at one of the municipal wastewater treatment works, through the use of codigestion. Codigestion involves the co-disposal and co-digestion of multiple high strength effluent streams, to create a positive synergistic effect in terms of an increased production of methane and detoxification of toxic compounds and inhibitory components via cometabolic degradation pathways. High strength effluent streams possess a three-fold methane production potential, and can create process upsets in municipal
20 digesters. Other considerable benefits of co-digestion include the usage of existing infrastructure and reduction in greenhouse gas emissions (University of KwaZulu-Natal, 2014).
2.3 SURVEY OF THE SOUTH AFRICAN SOFT DRINK INDUSTRY
The Water Research Commission (WRC) commissioned a series of National Surveys (Natsurv) into water and wastewater practices in various industrial sectors in the 1980’s, one of which has the soft drink sector (Water Research Commission, 1987). This document was developed as a guideline to reduce water intake and to promote better management of industrial waste in the soft drink industry. The Natsurv 3 guide also contains norms for the soft drink industry, including;
water intake and waste water disposal, which were established by undertaking surveys at various soft drink plants. Targets for some of these norms have also been set within the document. The guide is targeted at soft drink industries, municipalities, researchers, legislators and consultants.
The information contained in the 1987 Natsurv 3 guide was obtained from 25 different soft drink plants and focussed primarily on water intake and effluent generation.
2.3.1 WATER INTAKE
The specific water intake (SWI) was calculated for each of the plants by dividing the volume of water used in production by the volume of soft drink produced. This SWI provides an indication of the water efficiency of the plant. The results obtained from the surveys of the 25 plants show that the SWI typically falls within the range of 1.3 and 5.3 litres of water per litre of product with an average SWI of 2.7 (litre/litre). This wide range is explained by differences in the processes, products and packaging. The major water intensive sectors of the factory were also identified and include:
Process water
Bottle washing
Wash-down water
Utilities
21 2.3.2 EFFLUENT GENERATION:
Chemical analysis of the effluent at the various soft drink plants was also performed. The results showed large variances in the volume and pollution loads of the effluent. The range of these variances are summarised in Table 3. These variances were attributed to the differences in the processes, product, bottle washing and management practices. The quality of the effluent is affected by a reduced water intake as this led to an increase in concentration. The sources of contaminants in a typical soft drink plant were identified as:
Water treatment plant
Syrup room
Bottle-washer
Bottling/canning
TABLE 3: SUMMARY OF VARIOUS PARAMETERS IN THE NATSURV 3 GUIDE.
2.3.3 BEST PRACTICES
The following recommendations to reduce effluent load were identified:
Minimise product losses by:
o The collection and storage of remnant syrup which should be used at a later stage o Reducing the number of product changes by planning in advance
o Adjustment of bottle and can handling equipment to reduce product loss o Monitoring of the filling heights of the plants to reduce beverage spilling Parameter Standard
Effluent Volume (SEV)
Specific Water Index (SWI)
Specific Pollution Load (SPL) (kg COD/m3)
Suspended
Solids (SS) (kg/m3)
Total Dissolved Solids (TDS)
(kg/m3)
Range 0.41 – 2.44 2.7- 5.3 0.36 – 8.45 0.01 – 0.95 0.39 – 6.45
Average 1.40 2.7 3.41 0.39 3.70
Target value - 2.3 3.5 - -
22
Minimise the usage of chemicals by:
o Using caustic at lower concentrations and higher temperature combinations o Using cleaning agents at lower dilution and if possible recycle and reclamation of
these chemicals is recommended
Solids reduction
Solids removal:
The effluent from a soft drink plant should undergo solids removal before being discharged. This can be done using screens.
Balancing or segregation:
Balancing refers to the storage and mixing of effluent over a specific period of time to average out the variances that occur as a result of sudden high strength effluent being discharged.
An alternative to balancing is segregation, which is the separation of effluent streams that require treatment from those that do not.
PH Control
Effluent that is of an extremely high pH should be neutralized to bring it to acceptable limits before being discharged.
Biological Treatment:
This option includes the installation of on-site effluent treatment facilities that are intended to treat effluent that is out of specification in order to comply with acceptable effluent discharge limits.
23 2.4 SUMMARY:
The main points from Chapter 2 include:
The major steps in the production of carbonated soft drinks include:
o Water treatment
o Simple syrup preparation o Final syrup preparation o Blending
o De-aeration o Carbonation o Filling
o Capping, labelling and packaging
Effluent in a soft drink plant typically consists of high concentrate syrup, wasted soft drinks, water from the rinsing of cans and bottles, detergents and lubricants.
The primary contaminant in the effluent in sucrose.
The source of effluent are from process areas including:
o Washing and rinsing of the simple syrup equipment, final syrup equipment and filling equipment
o Washing of activated carbon and sand filters o Bottle washing
o Floor washing
Pigs are devices that move through the pipeline and create a seal at the pipe wall. The implementation of pigs results in faster product changeovers and decreased product wastage.
Municipalities treat water using aerobic or anaerobic digestion.
The University of KwaZulu-Natal (UKZN) has embarked on a joint project with the eThekwini municipality in order to fully utilize the current anaerobic digester capacity through the use of codigestion. High strength effluent streams will be treated using codigestion which will ultimately result in the production of energy in the form of methane.
The Natsurv 3 guide outlines norms for the soft drink industry, targets for these established norms and proven methods (best practices) to improve a soft drink plant.
24
THE PREVENTION AND CONTROL OF WATER POLLUTION:
Pollution can be defined as the release of any substance into the environment which has a harmful or poisonous effect on the environment or damages it in any way (The Foundation for Water Research, 2010, Pepper et al., 2011). The pollution of water can originate from either a point source or a non-point source. Point source pollution can be traced to specific sources, such as any pipes, industrial outfalls, municipal sewers, domestic drains etc. This can be regulated with the purpose of controlling the quantity of waste discharged. Non-point sources have sources that are not clearly defined and difficult to determine and require adequate land use management to be controlled (U.S.
Environmental Protection Agency, 2012, Environmental Protection Agency Victoria, 2012, Water Encyclopedia, 2014, Utah State University, 2014).
The prevention and control of water pollution is a function of government as the decrease in the quality of water has major social, economic and environmental implications (Burchi and D'Andrea, 2003).
3.1 LEGISLATIVE APPROACH TO THE PREVENTION OF WATER POLLUTION To achieve water pollution control the implementation of legislation which is built on a range of approaches has to be applied. These approaches lie within the following categories (Burchi and D'Andrea, 2003):
Prohibiting the discharge of waste into bodies of freshwater whether they exist on the ground or underground.
Restrict the discharge of wastes by implementing licences, permits, authorizations granted by government.
Charging for the discharge of wastes. This charge should take into account the external costs of pollution.
Advocate precautionary measures with regards to selected land-based activities.
The aforementioned water pollution control measures work in conjunction with other mechanisms to counter water pollution, namely: quality standards for waste and treated effluent, retaining the
25 type, extent and source of pollution, sampling and testing of the qualities of waste and waters and water quality management planning (Burchi and D'Andrea, 2003).
3.2 THE MANAGEMENT OF WATER RESOURCES IN SOUTH AFRICA
The constitution of South Africa states that the management of water resources is a national responsibility and that water is a public commodity (South African Government, 1996). The National Water Act (Act No. 36 of 1998) is born out of the South African Constitution and contains ideologies regarding water resources and its conservation. This Act accommodates for the manner in which water resources are to be developed, managed and allocated and makes use of incentives and disincentives to encourage water conservation and waste reduction. This Act also commissions the Minister of Water Affairs and Forestry (now the Department of Water and Sanitation) to ensure that water resources are conserved, protected, used and managed equally for the benefit of the people. The Department of Water and Sanitation (DWAS) is the custodian of the water resources of South Africa and is primarily responsible for the formulation and implementation of policies governing water (Department of Water and Sanitation, 2014a). These policies are then carried out by municipalities which ensure the effective and sustainable use of the nation’s water.
3.3 WATER RESOURCE MANAGEMENT BY MUNICIPALITIES
Municipalities deal with water pollution by the collection and treatment of this water in wastewater treatment works. The Water Services Act states clearly that the water authority that either provides water for industrial use, or controls the system through which effluent is disposed, is obliged to create bylaws. These bylaws also help to regulate water pollution where non-compliance is an offence. Wastewater discharge permit are one of the ways of controlling water pollution (Burchi and D'Andrea, 2003).