The Confirmatory Factor Analysis, Structural Equation Modeling and multiple regression statistical analysis were used to analyze the data. 62 Equation 4 - Structural Equation Modeling - Measurement Model - Composite Reliability 114 Equation 5 - Structural Equation Modeling - Measurement Model - Mean Variance Extracted.
Introduction to Research Problem
- Research Title
- Introduction
- Background of the Research Problem
- Research Problem
- Significance of the Research
- Scope of the Research
- Research Purpose
- Research Structure
The objectives of project management include controlling the time, cost and progress of the projects. In fact, project management is the process of controlling the project in achieving success and its objectives of the project (Asad Mir & Pinnington, 2014). Project success is achieved when the.
Literature Review
- Introduction
- Project Features
- Project Life Cycle / Project Phases
- Project Success
- Project Management
- Time and Cost in Projects Planning
- Time Management
- Cost Management
- Stakeholder Theory
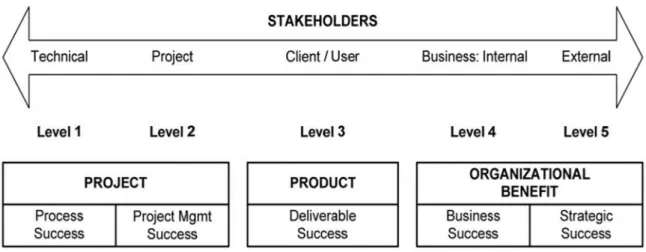
- Project Success Framework
- Factors of Success and Planning
- Conclusion
Proper understanding of the project and the project team and its necessary capabilities and competencies;. And the impact of external factors on the ability to solve problems of the project.
Research Hypotheses
Introduction
Research Hypotheses
- Hypothesis One
- Hypothesis Two
- Hypothesis Three
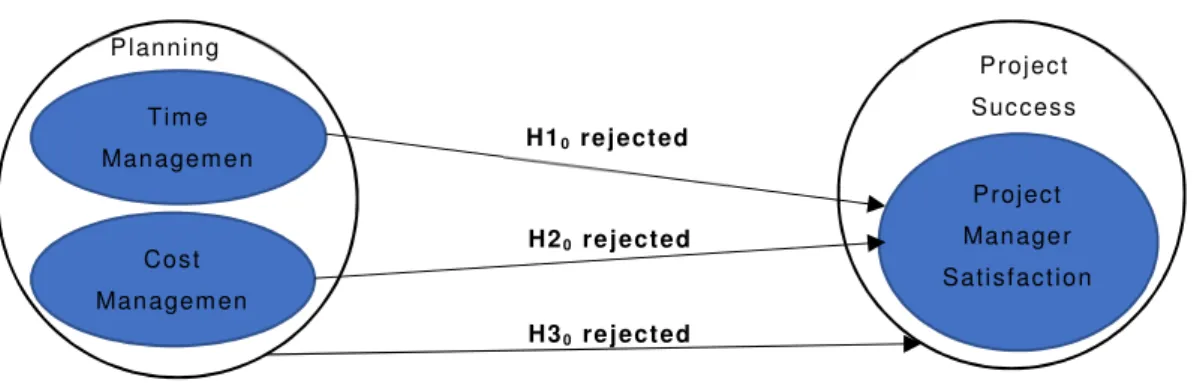
H10: There is no statistically significant positive relationship between time management and project manager satisfaction (as project success). H20: There is no statistically significant positive relationship between cost control and project manager satisfaction (as project success).
Conclusion
H1A: There is a statistically significant positive correlation between time management and project manager satisfaction (as project success). H2A: There is a statistically significant positive relationship between cost management and project manager satisfaction (as project success).
Research Methodology
- Introduction
- Methodology
- The Statistical Population of the Research
- Unit of Analysis
- The Sample Size
- Measurement Instrument
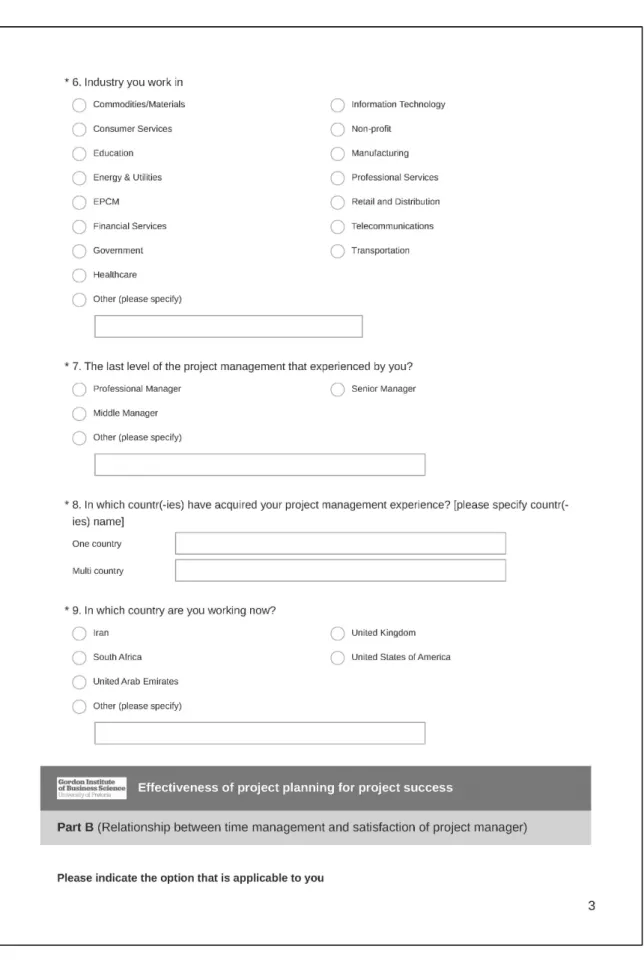
- Questionnaire
- Questions of the Questionnaire
- Pre-test
- Data Gathering Method
- Scale of Variables and Level of Reliability
- Data Coding
- Data Cleaning
- Data Analysis
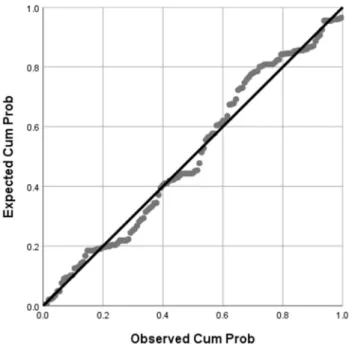
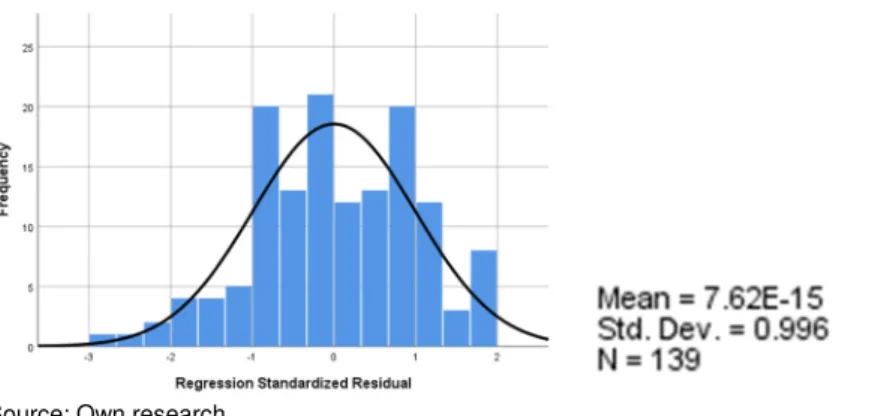
- Remove Outliers and Normality of Distribution
- Validity and Reliability
- Structural Equation Modelling (CFA/ Measurement and Structure Models)
- Statistical Tests to Explore Relationships among Variables
- Limitations
- Conclusion
Making the basic concepts practical had a decisive impact on the results of the research results. Respondents and their responses were removed from the analysis if the respondent did not answer any of the questions. Reliability and validity can affect the quality of the data you receive, based on which it was first checked.
Also a Bartlett's test of sphericity was used to acknowledge the suitability of the data for factor analysis and it is significant if the p-value is less than 0.05 at a 95% confidence level (Pallant, 2011). To examine the effect of the independent variables on the dependent variable, used a two-way analysis of variance (ANOVA). Then the beta was specified (as regression coefficients) to show the strength of the relationship between the dependent variable and each of the independent variables.
A portion of the population was not selected due to restricted access to all project managers. According to the limitation of time and access to information, this study only focused on the project managers who were one of the main stakeholders of the projects.
Results
Introduction
Sample Description
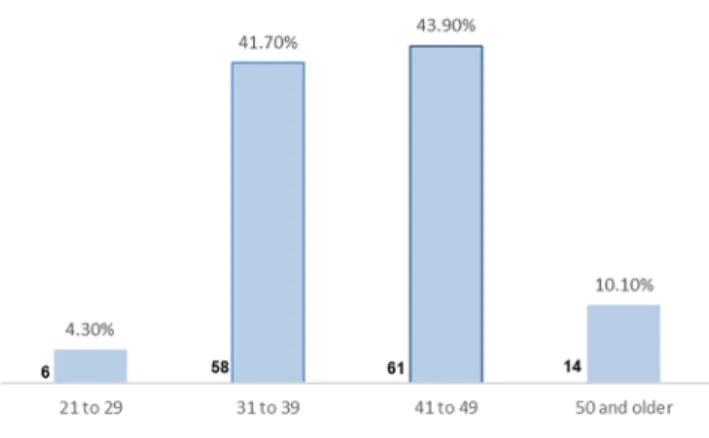
Demography and Frequency of Sample
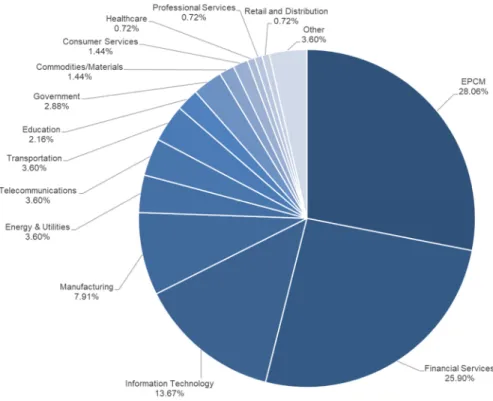
Work experience of the majority of respondents was within South Africa (34.53%), followed by the United States of America (13.6%); out of 139 respondents, 18 respondents worked in several countries. Almost 54% of respondents worked in two sectors: 28.1% worked in the EPCM industry and 25.9% in the financial services industry.
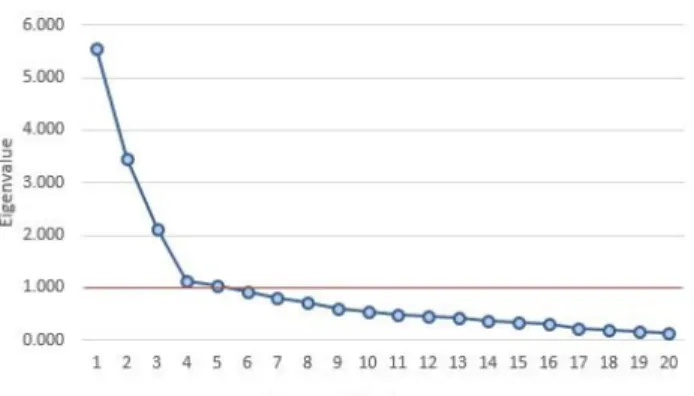
Validity/ Principal Component Analysis
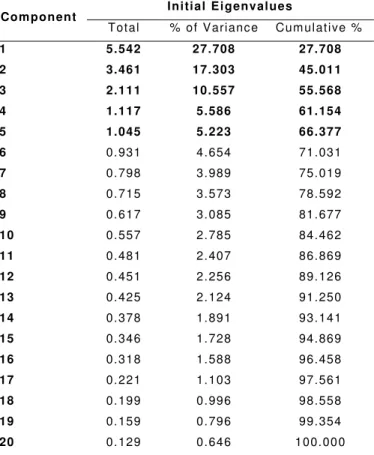
The cumulative percentage of variance that can be explained by the first five components is 66.377%, which means that about 66% of the total variance shared by the 20 variables can be attributed to the five factors.
Exploratory Factor Analysis with Varimax Rotation
Based on the KMO and Bartlett's test (Appendix 7), the KMO was equal to 0.75, which was greater than the minimum value (0.6), and the p-value of Bartlett's test of sphericity was less than 0.001 at the 95% confidence level, which means it was statistically significant; According to all these parameters, the validity was approved and the EFA was significant.
Reliability
- Project Management Satisfaction
- Time Management
- Cost Management
The first component is included in the eight questions related to the dependent variable - project success (project management satisfaction). The second component is included in the six questions related to the independent variable - time management (as construction of planning). According to the related total statistics table (Appendix 8), Cronbach's Alpha cannot be improved by removing any of the variables.
The third component includes five questions related to the independent variable – cost control (as a planning construct).
Structural Equation Modelling
- Confirmatory Factor Analysis on Measurement Model
- Confirmatory Factor Analysis on Structural Model
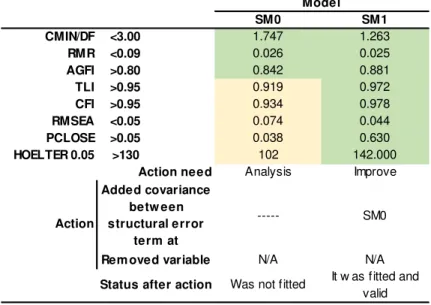
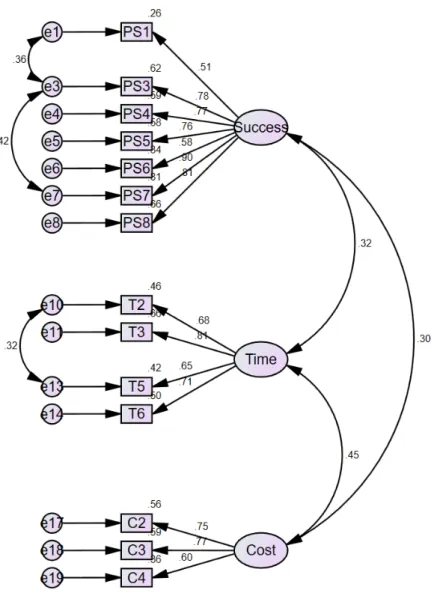
Then the main parameters based on Table 4 in Section 4.12.3 were checked; the model did not fit and it was improved by adding correlation of some of the error terms. The researcher improved the failed model based on understanding the results, for example, he removed the variable with the lowest standard regression for the factors that failed validity. One variable (PS2) was removed from the project success factor, three variables (T7, T4, and T1) were removed from the time management factor, and two variables (C1 and C5) were removed from the cost management factor.
Was not fitted Was not fitted Was not fitted It was fitted, but was not valid. According to the final standardized measurement model that eventually identified appropriate factors and variables, the researcher created the first structural SEM model (MS0) based on a conceptual model and hypothesis identified in chapter three. This was followed by an enhancement of the model similar to the process used during measurement model optimization to arrive at a final fit standardized structural model that passed validity and reliability.
The factors and variable were the same as measurement model with an improvement in the model. Finally, four variables from the original six variables were kept under the time factor (T1 and T4 removed), three variables from five variables were kept under the cost factor (C1 and C5 removed), and seven variables from eight variables were kept under the success factor (SP2 removed) to allow the model to meet both validity and reliability criteria.
Statistical test
- Pearson Correlation (two-tailed)
- Hypothesis 1 (Time and Project Management Satisfaction)
- Hypothesis 2 (Cost and Project Management Satisfaction)
- Hypothesis 3 (Planning and Success)
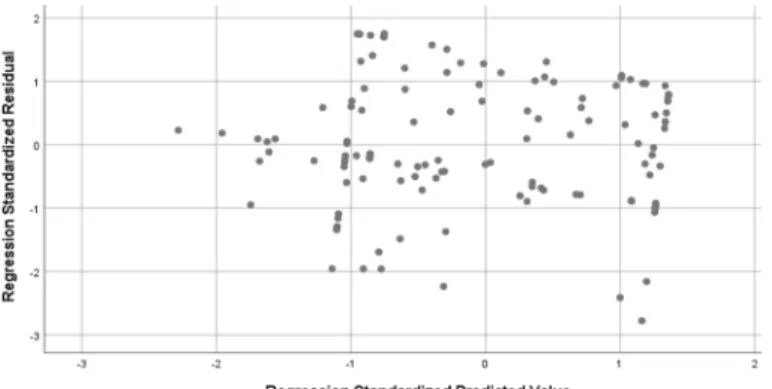
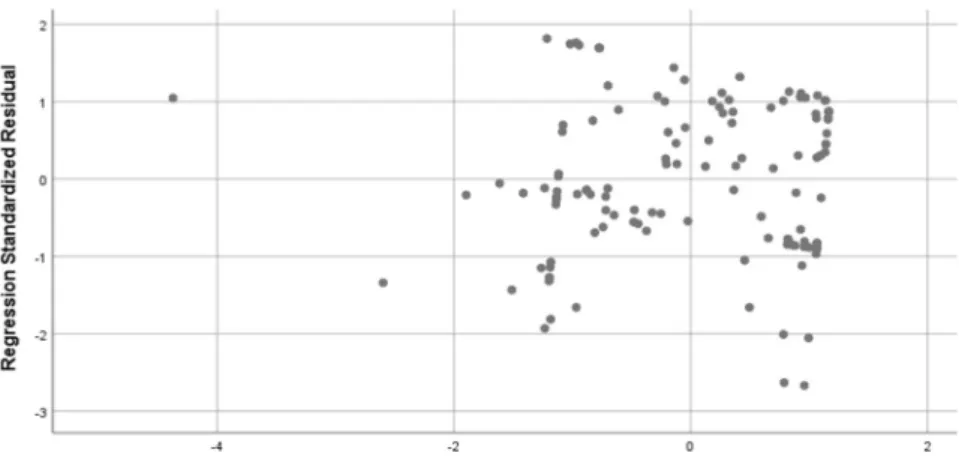
- Standard Multiple Regression
- Hypothesis 1 (Time and Project Management Satisfaction)
- Hypothesis 2 (Cost and Project Management Satisfaction)
- Hypothesis 3 (Planning and Success)
- Hypotheses
- Hypothesis 1
- Hypothesis 2
- Hypothesis 3
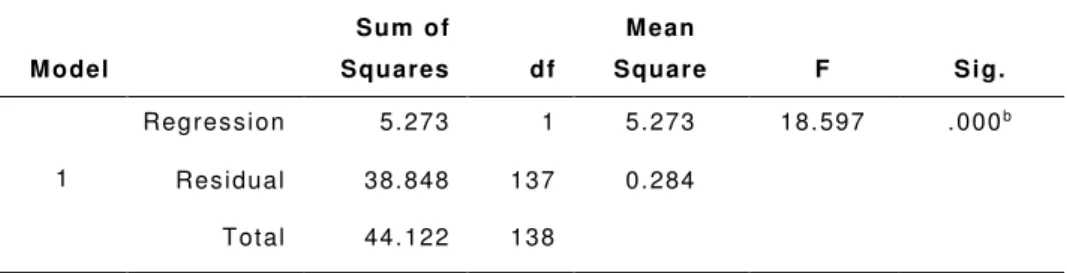
The Pearson correlation coefficient (+0.346) indicated a positive relationship between cost management and success (project management satisfaction). In this study, time management and cost management were the constructs of planning, and management satisfaction was the construct of project success. The R Square (0.130) in Table 18 indicated that cost management predicted approx. 13% of the variance in project management satisfaction.
Time management and cost control were the planning constructs and project management satisfaction was the Project success construct. Based on the results in section 5.8.1.1, there was a positive relationship between time management and project success (project manager satisfaction). Based on the results in section 5.8.1.2, there was a positive relationship between cost control and project success (project manager satisfaction).
As mentioned earlier, time management and cost management were the construct for planning, and project management satisfaction was the construct for project success. Researcher reviewed the relationship between time and cost management along with project management satisfaction, that means researcher reviewed the relationship between planning and project success.
Conclusion
Discussion of Results
- Introduction
- Overview of Dataset
- Overview of Constructs
- Time Management
- Cost Management
- Project Management Satisfaction
- Hypothesises
- Hypothesis 1
- Hypothesis 2
- Hypothesis 3
- Conclusion
In this research time management and cost management as independent variables were the construct for planning and project management satisfaction was the construct of project success. According to the information in section 9.4, the mean score for project management satisfaction was 4.18 indicating a high perceived level of project management satisfaction. According to section 5.8.1.1, the Pearson correlation coefficient (+0.361) showed a positive correlation between time management and project management satisfaction (as a project success construct).
This means that there was a statistically significant positive correlation between time management and project management satisfaction (as a success of the project). According to Section 5.8.1.2, the Pearson correlation coefficient (+0.346) indicated a positive relationship between cost management and project management satisfaction (as a construct of project success). This means that there was a statistically significant positive relationship between cost management and project management satisfaction (as a success with the . project). The findings of this research are consistent with the findings of other studies (Chen, 2015; Smith, 2014).
In this research, time management and cost control were the planning constructs, and project management satisfaction was the project success construct. This means that there is a statistically significant positive relationship between time management and project management satisfaction (as project success), so that the result of this research is consistent with the results of other studies (Sanchez et al., 2017).
Conclusion
- Introduction
- Findings
- Hypothesis 1
- Hypothesis 2
- Hypothesis 3
- Implicate for Management
- Time Management
- Cost Management
- Planning
- Limitation of the Research
- Recommendation for Future Research
- Conclusion
The results of the study indicate a positive relationship between time management and project management satisfaction. Based on the project success framework (Bannerman, 2008), time management is one of the most important factors contributing to project management success. In other words, the project is successful if the project management as shareholder is satisfied (Fonseca et al., 2016; Williams et al., 2015).
The research results show a positive relationship between cost control and project management satisfaction. According to the project success framework, cost control is one of the main tools for successful project management. According to the findings of this research, time and cost management have a positive relationship with project management satisfaction.
Project management can use time management and cost management as constructs of planning to have an impact on project stakeholders' satisfaction and make the project successful. The impact of project management (PM) and benefits management (BM) practices on project success: Towards the development of a project benefits management framework.
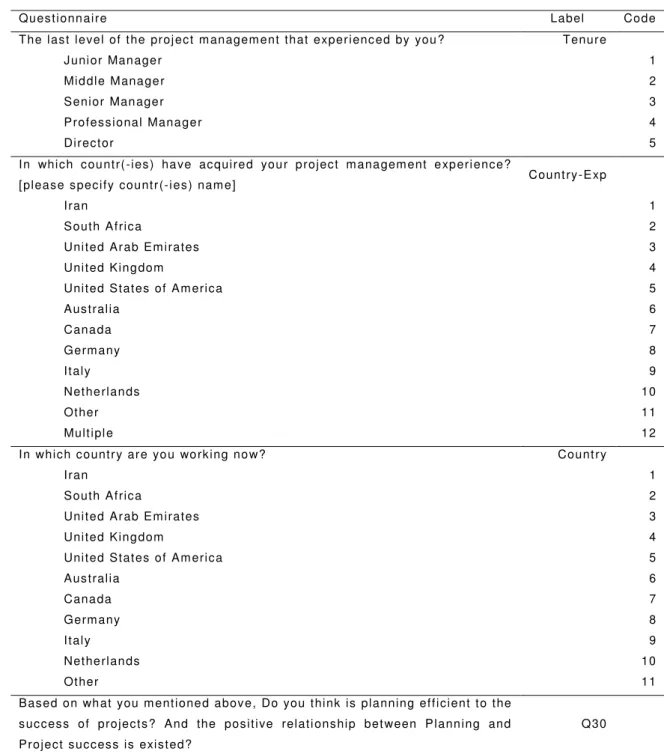
Codebook
The last level of project management that you have experienced. Identifying and documenting relationships hi ps between project activities will satisfy project management. A project manager will be content to monitor the status of project activities to update project progress, and manage changes to the schedule to achieve the plan.
Fɔ mek polisi, prosidyuz, ɛn dɔkyumentri fɔ kɔntrol di kɔst fɔ di prɔjek (planin, manejmɛnt, spɛndin, ɛn ɔda kɔst dɛn) go mek di prɔjek manija satisfay. Fɔ monitar di prɔjek stetɔs fɔ ɔpdet di prɔjek kɔst ɛn fɔ manej di kɔst bays chenj dɛn go satisfay di prɔjek manija. Frɔm di we aw di prɔjek manija de si tin, di prɔjek dɛn kin mit dɛn opareshɔnal pefɔmɛns gol dɛn wit bɛtɛ planin.
From the project manager's point of view, projects achieve their technical performance goals with better planning. From the project manager's point of view, the project results meet the expectations of the holders, with better planning.
Consent Statement and Questionnaire
Mahalanobis distance
Test of normality (skewness and kurtosis)
Frequency analysis
Principal Component Analysis
Exploratory Factor Analysis
Reliability analysis
Structural Equation Modelling - Measurement Model analysis
Structural Equation Modelling - Structural Model analysis
Standard multiple regression analysis
Consistency matrix
Ethical Clearance Approval