RELIABILITY ANALYSIS OF POWER TRANSFORMERS. Case: Eskom Distribution Eastern Region, lMY A to 80MV A power transformers. Reliability analysis of power transformers (Case: Eskom Distribution Eastern Region, . IMV A to gOMV A power transformers). Submitted in partial fulfillment of the academic requirements for the degree of Masters of Science in Engineering.
This thesis analyzes the reliability of current transformers and its impact of faults on system performance. The research further examines the reliability of series and parallel systems using actual component reliability values. The Distribution Supply Loss Index was determined to be the largest impact Key Performance Index due to [0 ttansformer errors.
Transformer failures using statistical methods showed the HV/LV winding to be the main failure component. This study has concluded that the reliability of transformers is affected by changes in transformer design, increased maintenance failures, and inadequate protection of transformers in substations.
Introduction
- ReliabUity
- System evaluation
- Utility systems
- Parallel systems
- Rati onale for the disse nation
- Re search methodology .................. ........................................................................ .. ..... "
- Summary description of me dissertation
The role of the transformer is to facilitate the transfer of power to the end user. The magnitude of the input voltage V! is usually different from the output voltage V1. the transformer is a step-up transformer. The heating of the copper windings can cause the moisture in the paper to form bubbles.
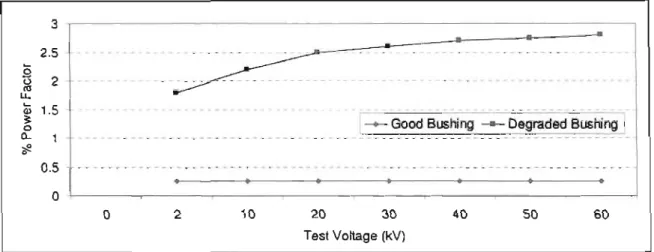
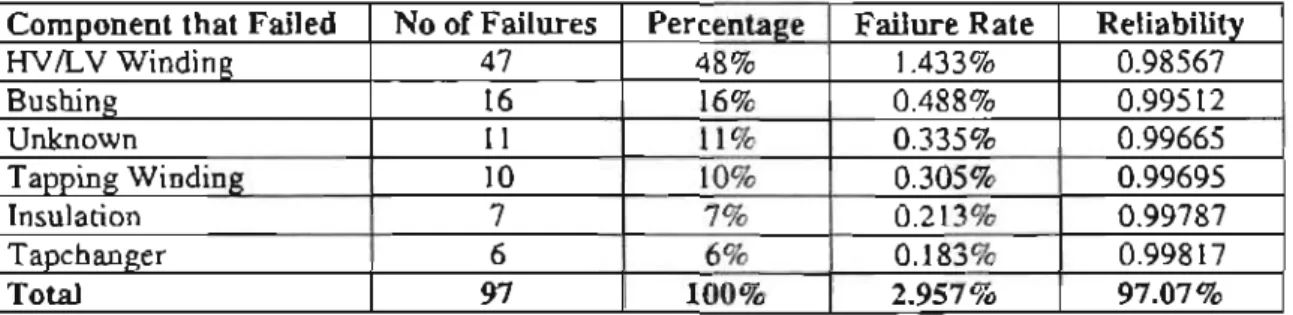
This test is performed on bundles that have a potentia1 tap point. The capacitance between [the top of the bushing and the bottom tap and the capacitance between the tap and ground are measured. Failure rates and reliability for components are shown in Table 4-4. The Tate equivalent failure per component is calculated per year and averaged. RSLI and DSLI are affected by the installed MY A. The meaning and example of each KPI follows [84]:.
If the result is above the upper limit, the result is 4. The DP values in Table 5·6 can be used to estimate the condition of the paper and pulp and the remaining useful life of the power transformer [47]. The power transformer failure rate was calculated to be 3.4%, The component that contributed the highest unreliability is the HV/LV winding (48% of failures).
Transfonner Design, Reliability and Failure Mode Analysis
Chapter overview
Basic principles of transformer operations
Major transformer components
- Core materials
- Tapchanger
- Bushings
- Surge arrestors
- Transformer cooling
- Alarms and indicating devices
Evaluation of modem and older transformer designs
- lncreased volts pertum
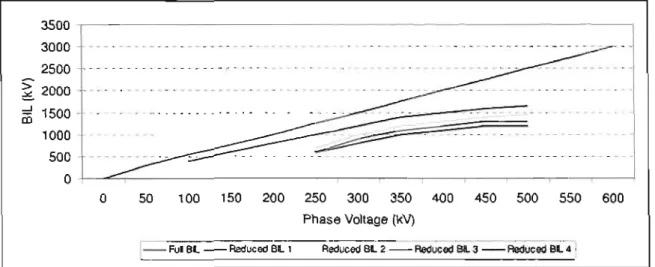
- Reduced basic insulation levels
- Reduced impedances
- Reduction in physical size
- Reduced insulation system
- Ins talled power transformer per year
It is the single largest asset of the substation and almost 60 percent of the substation costs are attributable to the transformer. The most basic elements of the transformer are the primary and secondary side windings and the magnetic core. A common practice is to place the tap-changer windings on the high-voltage side of the transformer.
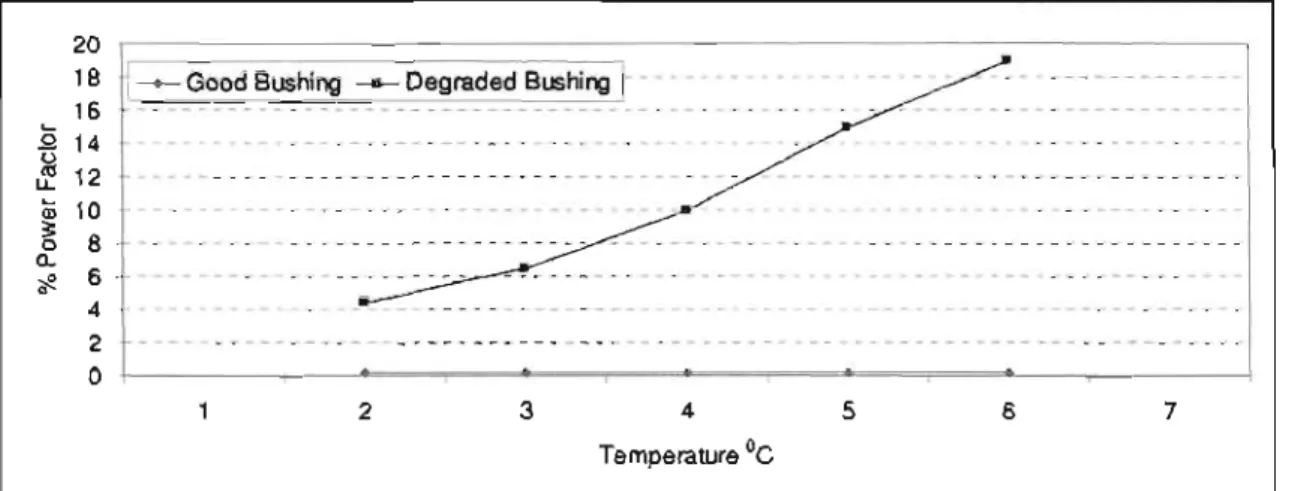
There is a hand lever on the side of the main tank with a tap position indicator. The slope of the power factor versus temperature curve of the degraded bus was enormous compared to the good bus. Many forms of insulation degradation significantly increase the slope of the power factor versus temperature characteristic.
The indicators also ensure that the cooling fans are switched on and the transformer is switched off in case of overload. A transformer 'breathes' during operation due to changes in load and the expansion and contact of the oil and components in the main tank.
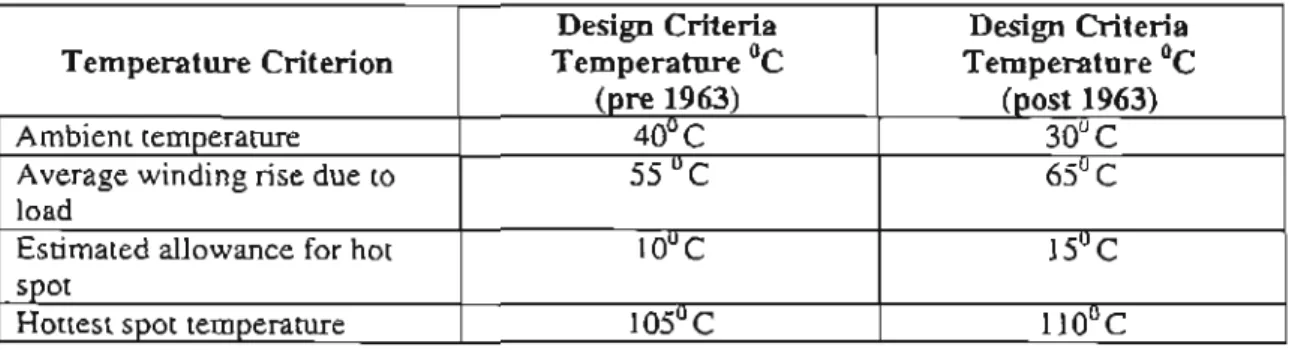
Changes in desig n criteria of transformers
Cellulose products used in power transformers
- Classifications of solid insulating materials
- Oil-impregnated cellulose
- Insulation properties
- Dielectric loss measurements
Mineral oil used in power transformers
- Qualit y type tests of mineral oil .",
- Oil testing as a condition indicator
- Mois[Ure analysis , effects and testing
- Condition assessment of power transfo rmer using DGA
- DGA interpretation
Transformer faults and failures
- Analysis of transformer failures globally
- Mechanical fai.1u re
- Cost of unserved energy
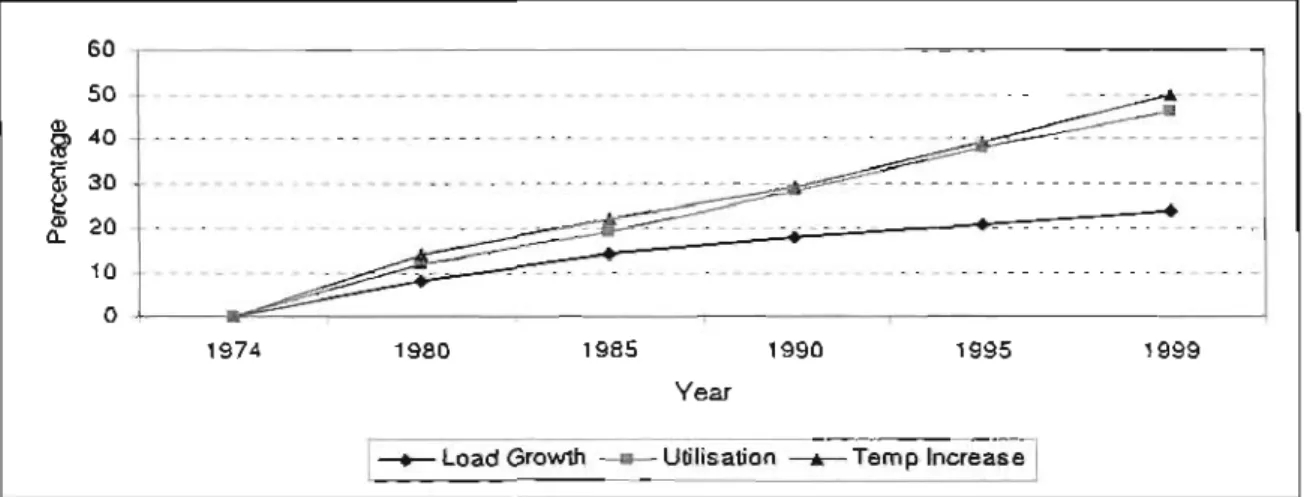
The BPF captures ha( oil from the top of the transformer and feeds it to the inlet of the oil circulation pump. Manufacturers achieve these very high MVA ratings by using bener quality steel, lowering the BIL and impedance, increasing the volts per turn, using then upgraded paper, improving cooling methods and by significantly reducing the amount of oil per kV A. Reducing the amount of oil has negative effects. Figure 2_7: Installed capacity of the transformer per year. the load growth was about 2% and the utilization of the transformer increased by 22% as shown in the figure 2-8.
A 22% increase in load corresponds to a 37% increase in hotspot temperature. the average hotspot increase is 73 Q c. The pennity and losses within the cellulose are determined by the polarization of the cellulose. The dielectric state of the cellulosic material can be determined by performing a power factor or loss tangent measurement [31].
Dielectric faults, the presence of moisture, contamination and degradation of the oil affect the loss tangent values and the power factor. There are cases where the clamping pressure was insufficient and a fault sustained by the transformer would lead to the loosening of the core.
Eskom's operations and mai ntenance practices
Eskom's transformer protection philosophy
The air gaps between the ends of the lamination are overlapped by the next lamination layer. The value of the zero-load excitation current is determined by the air gaps in the joints of the laminations [16]. There are temperature limits that must be followed to obtain maximum life of the transformer and minimum insulation damage.
The most important source of moisture will be the degradation of cellulose caused by aging. The last type is frame isolation core failure and link failure. The insulation will age at an accelerated rate and thus reduce the lifetime of the transformer.
On an operating transformer, no short circuit fault results in the transformer being tested to determine the condition of the winding.
Conditi on Assessment of Transfonner
Chapte r overvi ew
Maintenance methodol ogy
- Maintenance steps ................................. ........... .. .... .. ............................................... 3S
- Limilations
- Eskom's site inspecti on sheet
Oil analys is
- Sample poinL
- Dielectric breakdown
- Moisture con tent
- Acidity
- Furans
Di ssolved gas in oil analysis
- Origin of gases in transformer oil
- Ageing
- Interpretati on of dissolved gas analysis
The degree of reduced electrical strength depends on the panic type involved, panic size and the water content of the oil. As the temperature of the oil increases, so does its ability to receive water (this phenomenon is referred to as the saturation point curve [61} where the water is dissolved in the oil up to the point of saturation where water particles stand to form) . As the oil ages, the ability of the oil to hold more and more moisture increases.
The distribution of moisture in a transformer is a function of the overall temperature of the transformer. The dehydration of the glucose molecules is responsible for the production of furan derivatives, which are partially soluble in the oil. Cellulose degradation is accelerated by the presence of moisture, oxygen and temperature, all of which are available to the cellulose in the transformer's environment.
This is due to the breakdown products of the oil under electrical and thermal activity [61]. Heat or electrical discharges occurring in the power transformer result in the decomposition of the insulating oil and other insulating materials. The end result and composition are indicative of the type and severity of the transformer fault.
Electrical testing
- Leakage reactance
- Bushing tan delta
- Winding lan deila
- Frequency response analysis
- Core insulation rest
- Audible transformer sound It:ve l
Eastern Region transformer condition anal ysis
- Water content & pipers ch art profile
- Predicted DP profil e
- Ethane profile
- Ethylene profile
- Electric strength & moistu re
- Percentage Trending Method
Chapter summary
Reliability Analysis of Power Transformers
Reliability of a simple network
- Reliability of a paralIt:1 system
Netw ork sensitivity
Reliability of transformer and its components
- Transformer failure rate calculation
- Mean Time to Failure
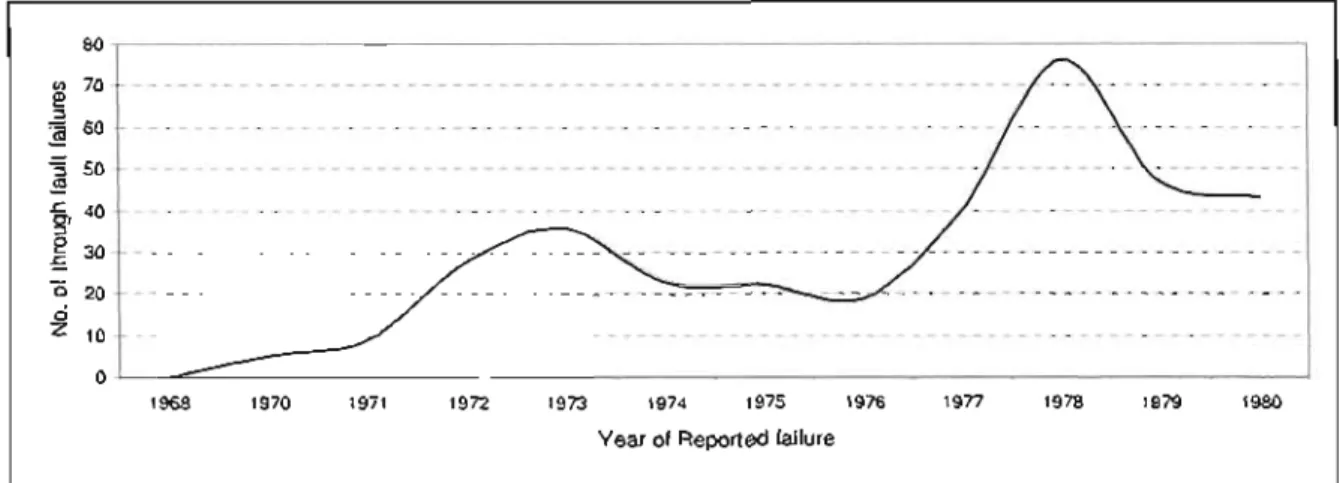
Error levels at each ltanfonner in the network were calculated using DIGsILENT Power Factory software. The number of circuit breakers through faults from 1999 to 2006 was summed and linked to a kA kA profile. The aim of this exercise was to determine the number of faults experienced by each transformer and the impact this would have on the short circuit withstand capability of the transformer and the level of stress imposed on the transformer insulation.
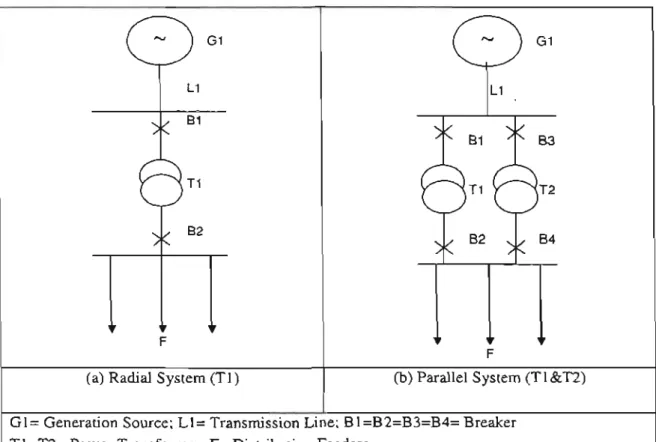
However, 30 of the switching faults were hidden in the 0 to 5kA range and 3 in the 6 to IOkA range. Foul currem is considered to have minimal impact on the transformer as its magnitude is very low and the duration does not exceed 400 milli-seconds. Using the data from Table 4-4, the reliability of the series transformer model can be calculated as follows:
Based on the failure rate of each component from 1999 to 2006, the transformer series model shows that the reliability of transformers in Eskom's Eastern Region is 97.07 percent. The failure rate equation can then be used to determine the failure rate of a particular transformer base. The failure rate comparison shows that the higher the transformer base, the lower the failure rate.
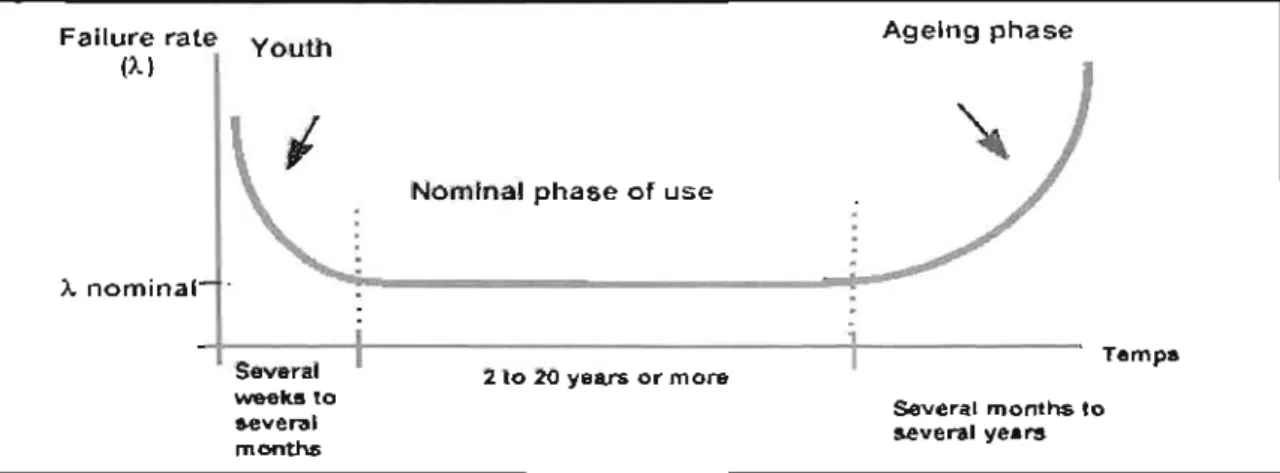
The error pattern is a typical basket curve. The initial 3-year period shows a high number of errors. This implies that, based on a failure rate of 3.43%, the average time between failures is 29 years.
System to mitigate un-reliability
- System design and operating options
- Factors contributing to failures
- Categories of failures
Design reliability
The impact of reliability on system performance
- Reliability evaluation criteria
- Reli ability Calculations of Failed Tra nsformers
- Failure rate versus impact to performance KPJ' s
- Measures to improve transformer reliability
Transform er failure analysis
- Failure analysis per year
- Failure analysis per age category
- Failure analysis per MV A category
- Failure analysis per manufacturer
- Failure analysis per fai lure triggers
- Failure analysis per transformer component
The cost of a transformer failure
- Equipment fai lure loss
- Cost of unserved energy
This refers to the loss of income for the consumer during the duration of the outage.
Chapter summary
Transformer Risk Ran king and Associated KPI's
Chapter o verview
- Risk ranking methodology
- Establi shin g risk ranking and Priori ty Index
- Weighted Condition Factor methodology
- Transformer Priority Index
- Eastern Region's transfonner risk ma trix
International KPI benchmarking
- Innuence of key factors for network reliability benchmarking
- Compari son of Eskom and imernational utilities network infrastructure ..... ... ....... t02
- Analysis of Eskom Distribution performance
- Comparison of faults that effect Eskom's performance KPI's
Causes and mitigation of poor reliability
- Causes
- Mitigation ... .. ..... .. ........................ .... ... ...... ............... ................ ............................... 1 06
Tr ansformer reliability impacted by design evolution
Transformer reliability impacted by maintenance and operation
Transformer failure mode analysis
The condition factor should be weighted (WCF) against the level of importance of the transformer in the system.
The impact of transfonner failures on system reliability
Financial impact of transformer fai lures
Identification of high risk transformers using a risk matrix
Research objectives
Recommendations
![Table 2-6 [34] summarizes the pbysical, electrical and chemical tests performed, to establish the quality of the mineral oil](https://thumb-ap.123doks.com/thumbv2/pubpdfnet/10638117.0/37.892.128.786.703.843/summarizes-pbysical-electrical-chemical-performed-establish-quality-mineral.webp)