I
UNIVERSITY OF KWA-ZULU NATAL
RESIDENTIAL CUSTOMERS EXPECTATION AND PERCECTION OF SERVICES PROVIDED BY ETHEKWINI MUNICIPALITY
ELECTRICITY CALL CENTRE
BY
Zola Shabalala 214580907
A dissertation submitted in partial fulfilment of the requirement for the degree of Master of Business Administration
Graduate School of Business & Leadership College of Law and Management Studies
Supervisor: Dr MacDonald Kanyangale
2018
II
DECLARATION
I Zola Shabalala declare that
i. The research reported in this dissertation, except where otherwise indicated, is my original work.
ii. This dissertation has not been submitted for any degree or examination at any other university.
iii. This dissertation does not contain the other persons’ data, pictures, graphs or other information, unless specifically acknowledged as being sourced from other persons.
iv. This dissertation does not contain other persons’ writing, unless specifically acknowledged as being sourced from other researchers.
Where other written sources have been quoted, then:
a) Their words have been re-written but the general information attributed to them has been referenced.
b) Where their exact words have been used, their writing has been placed inside quotation marks, and referenced.
c) Where I have reproduced a publication of which I am an author, co- author or editor, I have indicated in detail which part of the publication was actually written by myself alone and have fully referenced such publications.
d) This dissertation does not contain text, graphics or tables copied and pasted from internet, unless specifically acknowledged, and the source being detailed in the dissertation and in the References section.
Name: Zola Shabalala
Student Number: 214580907
Signed: _______________________ Date: November 2018
III
ACKNOWLEDMENTS
My most sincere appreciation and gratitude goes to the following people without whose assistance and support this study would not have been successful.
First I give thanks to Christ Jesus, my Saviour, for His grace upon my life
My supervisor, Dr MacDonald Kanyangale for his invaluable support and being a great inspiration throughout this study.
I am also thankful to my wife, the love of my life, Thandazile for her support and my children Fezeka, Unesuelihle and Ziphakeme for understating my absence during my studies.
To my parents Mr Musawenkosi Shabalala and Mrs Sibongile Shabalala for their unwavering support and encouragement till the finish of my studies.
To my MBA Block Group 3 members with whom I have interacted with, for their words of encouragement and support over the years. Tito for the friendship and support during the course work.
My colleagues at eThekwini Municipality Electricity Department for their support and patience during the times when I was away from the office
This project also would not have been possible without the active participation of the Clare-Hills Community in the data generation process.
To University of KwaZulu-Natal Graduate School of Business Staff and for the entire school for the support to carry out this research.
Lastly, I am grateful for the invisible support from Restoration House Ministries Family
IV
ABSTRACT
Customer service and customer satisfaction play a vital role in any business. The success of any organisation is largely dependent on how they satisfy their customers by ensuring that quality customer service is delivered across all levels of the organisation. Businesses and public service organisations, together with their employees need to understand the perceptions and expectations of their customers in order to provide optimum quality service to the customer. Focusing on Clare-Hills Ward 23 in eThekwini Municipality, the research investigated residential customers’
expectations and perceptions of service quality using SERVQUAL model by focusing specifically on services provided by eThekwini Municipality Electricity Call Centre in Durban, KwaZulu-Natal.
A quantitative research approach was utilised for this study. The study adopted
“stratified random sampling” to select 80 residential customers as participants from Clare-Hills Ward 23 with experience of service provided by eThekwini Municipality Electricity Call Centre. Data was collected using a questionnaire, and analysed using descriptive statistics.
The study revealed that Clare-Hills residents had high expectations of a reliable and responsive service by eThekwini Municipality Electricity Call Centre. More specifically, the highest expectations of residential customers were on eThekwini Municipality Electricity Call Centre having the consumer’s best interest at heart but also the expectation of EMECC “fulfilling the promise to do something by a certain time”. The study also found gaps between Clare-Hills customers’ expectations and their respective perceptions on all the dimensions of SERVQUAL, which were all negative and not met.
In conclusion, the overall negative gaps between customer expectations and perceptions obtained on all dimensions of SERVQUAL show that eThekwini Municipality Electricity Unit through call centre services have failed the residents of Clare-Hills Ward 23 in Durban by not meeting their expectations in terms of service quality as users of eThekwini Municipality Electricity Unit.
V
Recommendation on service quality improvements by eThekwini Municipality Call Centre are highlighted in this study. Areas for future research are also illuminated.
VI TABLE OF CONTENTS
DECLARATION ... ii
ACKNOWLEDMENTS ... iii
ABSTRACT ... iv
TABLE OF CONTENTS ... vi
LIST OF TABLES ... xii
LIST OF FIGURES ... xiii
CHAPTER ONE ... 1
INTRODUCTION TO THE STUDY ... 1
1.1 Introduction ... 1
1.2 Motivation for the Study ... 3
1.3 Focus of the Study ... 4
1.4 Problem Statement ... 4
1.5 Aims of the Study ... 5
1.6 Research Objectives ... 5
1.7 Research Questions ... 6
1.8 Research Methodology ... 6
1.9 Limitations of the Study ... 7
1.10 Structure of the Study ... 7
VII
1.11 Conclusion ... 8
CHAPTER TWO ... 9
LITERATURE REVIEW... 9
2.0 Introduction ... 9
2.1 Overview on Customer Expectation and Perception ... 9
2.2 Definition of Service ... 10
2.2.1 Definition of Customer Service ... 11
2.2.2 Difference between Services and Goods ... 13
2.3 Customer Perception ... 14
2.4 Customer Expectation of Service ... 15
2.5 The Gap Model ... 17
2.6 The Customer Gap ... 22
2.7 Service Quality ... 22
2.7.1 Importance of Service Quality ... 25
2.7.2 Measuring of Service Quality ... 25
2.7.3 Maintaining Service Quality ... 26
2.8 SERVQUAL MODEL ... 28
2.8.1 Strengths and Weakness of the SERVQUAL Tool ... 29
2.8.2 The Five Dimensions of SERVQUAL DEFINED ... 31
VIII
2.9 Dimensions of Service Quality ... 31
2.9.1 Reliability Dimension ... 32
2.9.2 Responsiveness Dimension ... 33
2.9.3 Assurance Dimension ... 34
2.9.4 Empathy Dimension ... 34
2.9.5 Tangibles Dimension ... 35
2.10 Legislations Applicable to Municipalities to Supply Electricity ... 35
2.11 Importance of Service Quality at eThekwini Municipality ... 36
2.12 Improving Service Delivery ... 37
2.12.1 Consultation ... 37
2.12.2 Service Standards ... 38
2.12.3 Access ... 38
2.12.4 Courtesy ... 38
2.12.5 Information ... 39
2.12.6 Openness and Transparency ... 39
2.12.7 Redress ... 40
2.12.8 Value of Money ... 40
2.13 Application of SERVQUAL Model ... 41
2.14 Conclusion ... 42
IX
CHAPTER THREE ... 43
RESEARCH METHODOLOGY ... 43
3.1 Introduction ... 43
3.2 Research Objectives ... 43
3.3 Research Focus ... 43
3.4 Research Design... 44
3.5 Location of the Study ... 48
3.6 Study Target Population ... 48
3.7 Sampling and Sampling Size ... 49
3.8 Questionnaire Design and Data Collection Method ... 50
3.9 Data Analysis ... 51
3.10 Pilot Test and Pretesting ... 52
3.11 Research Validity and Reliability ... 53
3.12 Validity ... 53
3.13 Reliability ... 54
3.14 Confidentiality ... 54
3.15 Ethical Issues ... 55
3.16 Conclusion ... 55
CHAPTER FOUR ... 57
X
DATA PRESENTATION AND DISCUSSION OF RESULTS ... 57
4.0 Introduction ... 57
4.1 Statistical Analysis and Discussion of Findings ... 57
4.1.2 Reliability of the Findings ... 65
4.2.1 Tangibility Dimension ... 68
4.2.2 Reliability Dimension ... 68
4.2.3 Responsiveness Dimension ... 69
4.2.4 Assurance Dimension ... 70
4.2.5 Empathy Dimension ... 70
4.3 Conclusion ... 70
CHAPTER FIVE ... 72
CONCLUSIONS AND RECOMMENDATIONS ... 72
5.0 Introduction ... 72
5.1 Description of Respondents and Study Objectives ... 72
5.1.1 Target Population and Sample Size ... 72
5.1.2 Study Objectives ... 72
5.2 Findings from Primary Data and Conclusions ... 73
5.3 Study Recommendations ... 76
5.4 Scope for Further Study ... 77
XI
5.5 Conclusion ... 77 REFERENCES ... 78 APPENDICES ... 87
XII
LIST OF TABLES
Table 1: Gap Analysis on Perception and Expectation: Gap analysis on
perception and expectation ... 47
Table 2: Five Dimensions of the Service Quality ... 51
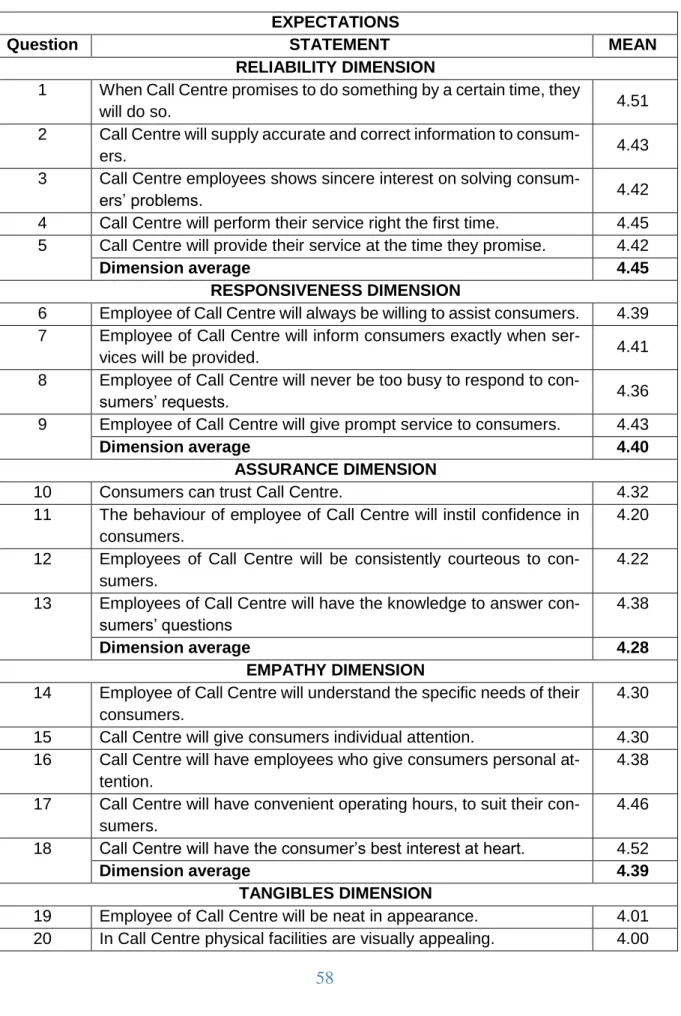
Table 3: Expectations Mean Scores per Statement (n=69) ... 58
Table 4: Perceptions Mean Scores per Statement (n=69) ... 61
Table 5: Service Quality Gap between Perceptions and Expectations (n=69) ... 64
Table 6: Cronbach Alpha Coefficient Results ... 66
Table 7: Descriptive Statistics per Dimension – Expectations ... 66
Table 8: Descriptive Statistics per Dimension – Perceptions ... 67
Table 9: Paired Samples Statistics ... 67
XIII
LIST OF FIGURES
Figure 1: Factors that Influence Customers' Service Levels (Source: Fourie 2015,
p. 33) ... 16
Figure 2: The Gap Model (Source: Naik, et al., 2010, p. 240) ... 19
Figure 3: Service Quality (Source: Fourie, 2015, p. 31) ... 24
Figure 4: Five Dimensions of Service Quality (Source: El Saghier, 2015) ... 32
Figure 5: Clare-Hills Population by Category, 2018 ... 49
1
CHAPTER ONE
INTRODUCTION TO THE STUDY
1.1 Introduction
This introductory chapter provides the inspiration and emphasis of this study. It correspondingly offers the research objectives, research questions, scope and the essential assumptions for the study.
In the present global business environment, the basic principles of customer service are ageless, but consumer expectations are not. Customers in this day and age are increasingly demanding. They are always seeking pleasant, efficient and reliable services. On a day to day basis, customers’ desire quality and proficient services which makes them feel like the services rendered has been specially personalized for them. Quality products are good but high quality customer service is a major part of every customer's expectation (Amorim & Saghezchi, 2014). Even physical products like electronics, cars, etc. cannot gain a tactical competitive advantage on their own. This means that the feedback from customers after they have received the services of the vendor/seller, forms various perceptions that are very much part of the product. Delivering higher value to any customer is an ongoing challenge for businesses and various product marketers (Andreassen & Olsen, 2008). However, most businesses have a good understanding of the term customer perception and have gathered good archives of experience based on years of being in a particular business (Mmutle & Campus, 2017). Nevertheless, the customer expectations of a business may not match the perception of the customers after services are rendered to them (Amorim & Saghezchi, 2014). This variance amongst the expectations and the perceptions of a consumer is regarded as the customer gap (Roman, 2016). This gap is a very important gap because in an ideal world the customers would want their expectations to be almost identical to their perceptions.
This study focus on customer expectations and perceptions regarding services pro- vided by EThekwini Municipality situated in the South African province of KwaZulu-
2
Natal. The study focused on the quality and services of eThekwini Municipality Elec- tricity Unit. This unit is broken down into five departments that are managed by several deputy heads (Municipality, 2016-2017). These departments are High Volt- age Operations, Medium Voltage/Low Voltage Operations, Customer and Retail Services, Technical Services Support, and Human Resources. The EThekwini Mu- nicipality Electricity Unit (EMEU) also have a call centre known as eThekwini Mu- nicipality Electricity Call Centre (otherwise known as EMECC) (Municipality, 2016- 2017). Electricity contribute a significant portion in the improvement of human life globally also in South Africa. Apart from its public benefits, electricity is also a driv- ing aspect in the economy. Municipalities have an important role to distribute elec- tricity nationally. EMEU provides further than 700 000 consumers in an area cover- ing approximately 2 000 square kilometres (Mthethwa, 2016). This includes the area of the eThekwini Metropolitan Region and some adjacent areas. EMEU oper- ates under the Regulation Act of Electricity 2006. Its procedures are regulated by the National Energy Regulator of South Africa (NERSA) and also eThekwini Munic- ipality. EMEU’s primary objective is to supply good quality electricity that enables an uninterrupted supply in a safe and affordable manner.
The Sitaram and Imona informal settlement in uThongathi were the areas recognised as one of the City’s hotspots for illegal connection (Mthethwa, 2016).
These were successfully removed by EMEU’s Multitask Joint Operation. The area was recognised as one of the City’s hotspots for illegal connection and which was surrounded by a web of live wires that hung hazardously over wire fencing, trees, houses, washing lines and in pathways. The Municipality has constantly advised residents against cable and electricity robbery as it often leads to devastating and tragic penalties like loss of lives. These electricity thefts are also known to cost the Municipality around R230 million annually because of its impairment to infrastructures within the municipality (Mthethwa, 2016). These illegal connections create delays and limitations on the services provided by the EMEU operations team.
3
In providing electricity services, the call centre plays an essential role in receiving details about faults but also allocating these to EMEU for immediate response.
According to Brophy, 2017 says a call centre is a centralised place of work utilised for getting or transferring a high capacity of requests by landline or handset. Within the contact centre at EMEU, important data about electricity faults are reported and assigned to the relevant sections to despatch the specific field staff. In this regard, it is interesting to understand expectations but also perceptions of customers of EMEU regarding services that are delivered by EMECC in Durban.
1.2 Motivation for the Study
Electricity interruptions no longer arise as a surprise or shock to the residents (i.e.
customers) of areas such as the Clare-Hills in Ward 23, under eThekwini Municipality. These customers experience outages on a daily basis due to illegal connections (Mthethwa, 2016). In addition to their complaints about the outages, these customers are also known to complain about the poor responses of EMEU, due to the fact that they delay in fault logging calls that are made to EEMCC.
Customer complaints on EMEU response and their perceptions on their services is not a new development. One customer complained that “their service delivery is very weak because he never received good feedback on logged issues” (Ngema, 2017). He further lamented that eThekwini Municipality is the heart of communication between the city and the customers and that their services require serious improvement (Ngema, 2017). The municipality also responded to the complaints, indicating that they were addressing calls in an orderly manner and that delay in response is due to high call volumes emanating from natural disasters (Mthethwa, 2017). EMEU also stated that they have begun putting comprehensive plans in place to provide a better and more efficient service. They therefore asked the customers with specific concerns regarding the services they need, to contact a specific number on EMECC lines (Mthethwa, 2017).
Given the above, this investigation seeks to understand the customers’ perceptions and expectations of services provided by the EMEU through EMECC. In this regard, the study focuses on the Call Centre. The study specifically focuses on views of
4
customers from Clare-Hills in Ward 23 regarding their experiences of EMEU services, and how to improve service delivery. It is envisaged that this study will identify gaps between expectations and perceptions and will point to areas whether customer perceptions of service are lower, higher or even equal to the expectations of the service provided by to EEMCC.
In this way, the challenge for EMEU management and staff will be to put interventions in place that will be aimed at bringing the identified gaps between expectations and perceptions closer together, thus improving customer satisfaction, which is one of the organisation’s values.
1.3 Focus of the Study
This investigation focus was to understand residential consumer expectations and experiences of the services provided by the EMECC. In pursuit of this, the study assessed customers’ perceptions of the services provided by the EMECC. The research was conducted on Clare-Hills residential customers in Ward 23 under eThekwini Municipality of Kwa-Zulu Natal province in South Africa. The study was limited to the residential customers who were in contact with EMECC and who were able to rate EMECC and EMEU’s quality of service.
1.4 Problem Statement
Customers have expectations of service which they compare with their actual experiences in judging the quality of services received. The residential customers in Ward 23 under eThekwini Municipality are currently dissatisfied with the services offered by EMECC. Some of the challenges they encounter include long waiting time on EMECC fault lines and late response from their field operations team regarding logged calls (Mthethwa, 2016). This has resulted in very poor perception from the residential customers. Frustrations arise when expectations as customers are not being met. However, the range and variety of expectations and experiences by residential customers of EMECC is not known yet.
It is notable that a previous study was conducted on the service quality of eThekwini Municipality Electricity Unit. For example, a qualitative and quantitative study
5
conducted by Sibiya in 2013 focused on the customer satisfaction to improve the service delivery of eThekwini Municipality. While it is remarkable that past study on eThekwini Municipality Electricity Unit has also used the SERVQUAL instrument, the current study is distinct, because it the first time used at eThekwini Municipality Electricity Call Centre. First, it focuses on residential customers and their expectations of service quality by eThekwini Municipality Electricity Call Centre (otherwise known as EMECC).
Second, no study of customer perceptions has been conducted in Clare-Hills residential customers Ward 23 regarding services provided by EMEC. This has made the municipality to be more concerned and as a result, believe that their reputation is at stake. This study, therefore sought to investigate the expectations and perceptions of residential customers of Clare-Hills especially Ward 23 regarding the services provided by EMECC in Durban.
1.5 Aims of the Study
The purpose of this quantitative research was to assess expectations and percep- tions of services provided by the EMECC in Durban according to residential cus- tomers from Clare-Hills residential ward 23.
1.6 Research Objectives
The research objectives remain as follows:
a) To determine residential customers’ expectations of services provided by EMECC in Durban.
b) To determine residential customers’ perceptions of services provided by EMECC in Durban.
c) To assess gaps between residential customers’ perceptions and their expectations of the quality of services provided by EMECC in Durban.
6 1.7 Research Questions
The research had the subsequent questions:
1. What are the residential customers’ expectations of services provided by EMECC?
2. What are the customers’ perceptions of services provided by EMECC?
3. What are gaps between residential customers’ perceptions and their expectations of services provided by EMECC?
1.8 Research Methodology
The research used positivism paradigm and survey to collect data from residential customers of EMECC. Positivism was the best suitable worldview that formed the author’s research design and information claims (Creswell, 2012). According to Cooper and Schindler (2014), positivism approach is usually associated with quantitative research. The research considered three types of research methodology which could either be quantitative, qualitative or mixed methods.
Quantitative method was selected because objective answers were obtained, this therefore provided suitable answers to the study questions and enabled the hypotheses to be tried. Quantitative design also has the ability to draw exact and succinct variables that can be measured, organised and employed (Cooper &
Schindler, 2014). This study employed descriptive study to gather of information that either defines the characteristics of a person or that of a circumstance (Sekaran
& Bougie, 2013).
The study was conducted at Clare-Hills, Unit 23 eThekwini Municipality. Random sampling was used as it gives all the elements of the population like chance of being nominated as a subject (Sekaran & Bougie, 2013). A primary data gathering approach was applied in the research and the tactics for data collection guaranteed that areas like confidentiality of data, protection of respondent’s privacy, equal participation opportunity and no mandatory obligation were addressed. The research surveyed 80 participants from a population of 814 residential customers, using the random sampling technique. The sample size is small as it was difficult to
7
get residents to participate in the study. The research ensured that respondents’
responded willingly with no coercion and maintained anonymity. Cronbach alpha coefficient was utilised to test the estimation scale for inward consistency. The data was coded and tested through SPSS software and the data analysis were free of researcher’s interference (Abeyasekera, 2006).
1.9 Limitations of the Study
The study employed a quantitative method to collect primary data, hence limiting the research to only quantitative method and no qualitative approach of data collection. According to Sekaran and Bougie (2013), qualitative and quantitative approaches are very necessary in obtaining a broad outlook of service quality.
Usually, both methods are highly encouraged during human behaviour research as they contribute valuable benefits to the study (Sekaran & Bougie, 2013). Future studies may use mixed method to understand expectations, experiences but also a gap between these. The use qualitative data collection is likely to be helpful to complement the small sample size.
1.10 Structure of the Study
This study is set into five chapters that comprise the subsequent details:
Chapter One: Chapter 1 covers an introduction to the study. It encompasses the inspiration and emphasis of the study, problem statement, research objectives and research questions. It moreover displays the scope and the structure of the study.
Chapter Two: Chapter 2 deals with the literature of the study. It covers definitions of customer expectations, perceptions and the gap amongst consumer expectations and perceptions. The chapter also discusses the SERVQUAL and other models of service quality.
Chapter Three: This chapter covers the research methodology. It presents the research philosophy, research design method, study location, population, sampling,
8
and collection approach. It also includes reliability, validity, and analysis of data and the administration of questionnaire.
Chapter Four: Chapter 4 presents findings of the study. This chapter also discusses findings of the study in relation with existing literature and theory.
Chapter Five: Chapter 5 provides recommendation and conclusions of study.
1.11 Conclusion
This chapter presented the framework of the study, motivation and focus of the study. It has also provided the problem statement, research objectives, research question, research methodology and the limitations of the study. Each business needs to understand the gap that exists between the customer expectation and perception of services that are provided such as eThekwini Municipality Electricity Call Centre. Therefore, it is imperative for businesses and organisations to have good perception from their customers and in turn strive to satisfy their expectations as this improves service delivery and organisational ratings. This study assists in understanding the residential customer expectation and perceptions of services provided by EMECC. The following chapter presents the literature review.
9
CHAPTER TWO LITERATURE REVIEW
2.0 Introduction
The preceding chapter prepared the overview of the study. This chapter provide the literature associated to the study. It begins by presenting a summary on the definitions and different viewpoints on service, service quality, and characteristics of service quality, importance of service quality, customer service and importance of customer service. It also gives a background on the gap model, SERVQUAL model, dimensions of SERVQUAL model and its application to customer perceptions and services This chapter additionally explains the application of SERVQUAL model to the public sector.
2.1 Overview on Customer Expectation and Perception
As a business organisation, you are rated depending on each customer’s expectation of you, your competitors, your industry and your business in general (Doerr, 2018). He also said that expectations are a summation of beliefs and assumptions regarding what is likely to happen in the future hence, it is vital in comprehending customer expectation. According to Roman (2016), customer expectations on what comprises great administration fluctuate starting with one business then onto the next. Expectations are too probable to differ not only in relation to various service suppliers in the similar industry, but as well since one industry to a different industry, and as of one country to a different country (Roman, 2016). A research by some salesforce (a foremost customer relationship management system) highlighted that today’s customers expect quick answer, genuineness, etc. When you do not meet these expectations as an organisation, your business could be perceived negatively (Doerr, 2018).
According to Doerr (2018), perceived quality of service is an extensively studied concept. Perception is well-defined as the consumer’s assessment of the inclusive supremacy or quality of a service (Doerr, 2018). According to Yusof, Joseph and
10
Shah (2017), it can also be defined as the customer’s feel for the “quality” of the service. Perceptions measure those aspects of the service as actually provided or experienced and is a contrast to excellence in service by the customer (Yusof, et al., 2017).
2.2 Definition of Service
Service sector plays a crucial role in any economy and service is the strength of any economy. In any advanced or developing country, the focus is to advance the economy using various industries to produce services like in mining, agriculture, wholesale, retail, etc. According to Bhorat, Steenkamp, Rooney, Kachingwe and Lees (2016), the biggest portion of the South African economic system, accounts for about 71% of Gross Domestic Product in South Africa. According to Fourie (2015, p.25), service is defined as a procedure comprising of chains of added or less intangible activities that ordinarily, but not essentially to meet expectation and perception of customers. Service occurs in dealings among the customer and employee of service provider or goods and service provider has put in place systems that addresses customers’ problems (Fourie, 2015, p. 25).
According to Rapp, Bachrach, Flaherty, Hughes, Sharma, and Voorhees (2017), service can be defined as the capability of an organisation to meet customer expectations. Some of the benefits of understanding and meeting customer expectations include that:
- They help the organisation to know what service levels it is expected to maintain in order to keep its customers happy and achieve higher customer satisfaction. This creates opportunities for exceeding expectations thereby creating raving promoters.
- They help to resolve customer complaints. By knowing the customer expectations, the organisation’s employees are able to focus solely on fulfilling customers’ expectations. Problems are fixed quickly hence;
business retention is improved.
11
According to Bhorat, et al., (2017), without any doubt customers play a pivotal role in any organisation as without customers organisations cannot survive. Hence, service quality becomes very necessary, as it helps to single out a business from its opponents, which similarly assists as a basis of marketing (Bhorat, et al., 2016).
A company can differentiate itself from the competitors by rendering an excellent service quality which can generate high profits (Rapp, et al., 2017). It is important to note that most times, service quality does bear fruit over a period of time in the business. However, organisations recognise the importance of how the service is provided to the customers.
Organisations endeavour to cultivate and keep a maintainable competitive advantage environment by means of high-quality service (Lovelock & Patterson, 2015). Customer satisfaction is an essential element in any organisation interested in ensuring customer retention, loyalty and profitability (Eid, 2015). Indeed, customer satisfaction is at the centre not only of any competitive market, but also for many companies as it aids in improving the competitive advantage over a competitor. Therefore, to maintain customer loyalty, the service must be of quality while frontline employees become effective. Among other factors, service quality is very important to shape or model the way it provided with the aim of leaving positive impression, that the customer wants to buy again, and recommend the service provider to other people in need of the same service (Eid, 2015).
2.2.1 Definition of Customer Service
Although most organisations consider quality of customer service, just not very many really set up frameworks to guarantee it is given (Hill & Alexander, 2017).
According to Scott (2015), it is vital to deal with the variety of meanings of the key concepts. For instance, a customer can be defined as any internal or external stakeholder of the company (Wicks & Roethlen, 2009). Customers can also be viewed as “the heartbeat of any organization; without no buyers, a company has no profit to make, no revenue, and no market value” (Yang, 2011). In the case of public service, beneficiaries or customers of such services involve several stakeholders
12
(e.g. taxpayers, employees, communities etc.) which need to be taken into consideration (Yang, 2011).
Within the electricity industry, a customer can be described according to their individual energy behaviour, by their dwellings (i.e. buildings), their appliances, their energy consumption patterns (e.g. small power user or large power user) and their production processes which could be industrial, agricultural or manufacturing (Environmental Protection Agency "EPA", 2017). EThekwini Electricity Department defines its customers according to the different market segments based on the customers’ individual electricity consumption or the contracted Notified Maximum Demand (NMD) of the customer (Municipality, 2016-2017). The customers are classified as:
Residential Customer (RC)
Business Customer (BC)
Larger Power Users (LPU)
It is important to highlight that this research is mainly on residential customers.
Conveying incredible customer benefit or fulfilling the customer combines comprehension of the consumer desires and in what way those requirements are to be encountered (Hill & Alexander, 2017). In the public sector, the administration structure needs to collaborate with other functions to maintain acceptable standard of service. The feedback from the customers can be utilised as a vital tool in any company to keep the customers happy. Work prepared by Parasuraman, Zeithaml and Berry among 1985 and 1988 provides the base for the measurement of consumer fulfilment through the service rendered, by employing the gap amongst the consumer's anticipation of performance and whatever the consumer really acquires. This strategy furnishes the measurer with the applicable data to adjacent the gap.
13
2.2.2 Difference between Services and Goods
In order to fully appreciate the definition of a service, it is important to differentiate services from goods. Also it is vital to highlight key characteristics that organisations can capitalise on, in order to achieve higher service quality. There are five fundamental differences among services and goods; these are
A service is an insubstantial procedure that could not be directly measured or gauged, whereas a good is a physical production of a procedure that has bodily dimensions. This dissimilarity has vital business insinuations since a service modernism unlike a product improvement unable to be unproved (Fong, et al., 2017).
A service requires some level of coordinated effort with the customer for it to be a service. Goods are for the most part delivered in an office unmistakable from the consumer (Tseng & Wu, 2014).
Services are inherently unrelated— they fluctuate day by day and even hourly as an element of the states of mind of the customer and the employees. Goods in distinction could be shaped to encounter tight conditions all the life long day with basically zero fluctuation (Yang, 2011b).
Services as a technique are delicate and time subordinate, and dissimilar to products as such they can't be supplanted. Production and consumption of services occurs simultaneously, but there is also a time lag between production and consumption of goods (Zameer, Tara, Kausar and Moshin, 2015).
The particulars of a service are all around characterized and evaluated as a bundle of highlights that influence the five detects (Zameer, et al., 2018).
These features are:
o Backing up facility (decoration, location, outline, architectural suitability, supplementary equipment).
o Expediting goods (variation, steadiness, amount of the physical merchandise that run with the administration; for instance, the nourishment things that pursue a dinner benefit).
14 2.3 Customer Perception
Service excellence can be both an individual and an intangible experience to a customer (Mmutle & Campus, 2017). The opinion that an individual customer will have about the services provided by the service provider will rely on the consumer’s anticipations. If the service that the consumer receives is improved than what was estimated previously, the service is outstanding (Andreassen & Olsen, 2008). If the service is fewer than what the customer anticipated, then the service is not good at all. Parasuraman, Ziethaml, and Berry (1985), recommend that service dynamic is very challenging in the municipal segment since it isn't only a matter of addressing expressed necessities, but of discovering allocated resources, establishing priorities, unexpressed needs and publicly validating and accounting for what has been done. Customer perception plays essential role in a company’s capability to attract new customers and to maintain existing customers (Bailey, 2018). Perception can be seen as a marketing idea that covers a customer’s impression and mindfulness about a business (Bailey, 2018). This can simply be defined as what a business customers and potential customers think of any organisation which directly influences the desirability of new customers and capability to retain good relationships with existing customers (Andreassen & Olsen, 2008). According to Bailey (2018), some of the factors that impact individual’s perceptions include;
Advertising: This deals with the promotions a company runs which can produce inferred perceptions about their product.
Influencers: This deals with people that surround an individual that have an enormous influence on their decision. This could be a person, social media, news, press releases, etc. These influencers can form thoughts and opinions around the customer.
Personal experience: This is seen as the biggest of all factors that influence customer perception. A first-hand experience affects the reaction and usefulness of a customer service channel. Thus, it will negatively or positively affect their perception.
15 2.4 Customer Expectation of Service
Consumers have different requests when it comes to service. According to Pride and Ferrell (2010), it is essential to regulate what consumers assume and then improve a service that meets or beats customer expectations. Therefore, it is vital to distinguish between the quality anticipated by a customer and the real quality of service that is delivered during a service progression and the customer’s perception (Pride & Ferrell, 2014). There are many definitions of “customer expectations”, According to Meirovich and Little (2013), customer expectation can be described as the variety of standards set by customers in order to assess the performance of the service provider. Customer expectations are considered as a key element of how the service interactions with service providers can be evaluated (Meirovich & Little, 2013). Customer expectations can also be definite as the needs or wants of consumers or forecasts made by consumers regarding what may occur during an exchange or transaction. Customer expectations are grounded on their expectations, and the buying of a product must contest their value-oriented procedures (Pride & Ferrell, 2014).
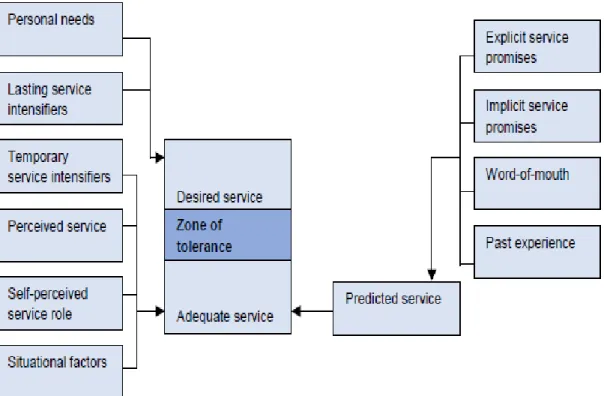
It is necessary to remember that customers have various types of expectations about services rendered to them. Lovelock and Patterson (2015) on service marketing, recognise anticipated service (maximum expectation) and adequate service (what the customer will accept). The variance or gap amongst the two levels is called “the customer’s zone of tolerance” (Fourie, 2015). On the level of the desired service, they identified “derived service expectations, personal needs, lasting service intensifiers, and personal service philosophy”, whereas on the level of acceptable service expectations, the authors recognised “perceived service alternatives, temporary service intensifiers, situational factors, customer self- perceived service role, and predicted service”, as sources of influence (Fourie, 2015). According to the Fourie (2015), the Figure 1 below shows the factors that influence customers’ service levels and clearly shows the zone of tolerance.
16
Figure 1: Factors that Influence Customers' Service Levels (Source: Fourie 2015, p. 33)
The study shows the expectations of customers have different characteristics, namely; what customers consider should be included in the service encounter; what they desire for; what they have faith for; and what they assume from a service provider (Fourie, 2015). Thus, customer expectations can be observed as terminologies of what they trust service providers should offer. In their work on handling customer expectations, Fourie (2009, p. 112) discovered that customers consider not only the purpose of getting a service, but also the likelihood that they will receive it. According to Phiri & Mncwabe (2013), the gap is amongst what they experience, what the customers expect and what will effect customer satisfaction.
In addition, when customer's expectations are more than their experiences, they have a negative perception of satisfaction. When customer's expectations are lower than their experiences, they have a positive perception of satisfaction. Thus, customers’ expectations of service quality have an effect on customer satisfaction and customer experience (Phiri & Mcwabe, 2013). According to Naik, Gantasala
17
and Prabhakar (2010), consumers' view of service quality radiate from a differentiation of their before-benefit desires with their genuine service encounter.
The service will be measured outstanding, if perceptions are more than desires; it will be viewed as acceptable, if it only equals the desire; the service will be categorised as per lacking, if its perceptions are less than expectations (Naik, et al., 2010).
According to Luger and Sellen (2016), customer expectations can be achieved through precise and suitable communiqué. This can be realised by means of marketing (for example, advertisements), as no organisation can advance customer expectations above the level of organisational performance (Pride & Ferrell, 2014, p. 270). According to Fourie (2015), enriched service quality and improved customer satisfaction reduce the gap among customer expectations and their supposed level of performance. This is an endless mission for any company day by day.
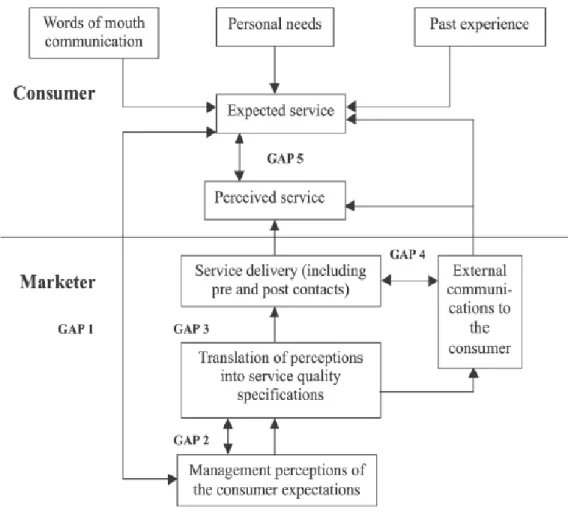
2.5 The Gap Model
Parasuraman, et al, (1985) and subsequent studies did a thorough effort on service quality and established a prolonged model of service quality founded on the gaps amongst consumer expectations of service and what they tend to perceive.
(Parasuraman, et al., 1985). This model is called the Gaps Model of Service Quality (Naik, et al., 2010). Murali, Pugazhendhi, and Muralidharan (2016) mentioned that the Gaps Model of Service Quality highlights that a consumer’s perception of service quality be contingent on the four gaps that occur in any organisation/customer environment. According to Zeithaml, Bitner, Gremler (2006), customer gap is defined as the variance among consumer’s expectations and what they perceive from the service provided from a management point of view.
Service quality gaps model shows that it is a valuable approach to close gaps analysis (Fourie, 2015). As soon as a gap is acknowledged, a plan can be established to bridge the gap (internal analysis includes service design and also service delivery) and (external analysis involves communication with customers) (Murali, et al., 2016).
18
This research study utilised the Gap Model, which not only highlights perception of consumers’ service quality, but also establishes the variance among what consumer expected of service, and what consumer perceived of the same service (Parasuraman, et al., 1985). In this regard, customer gap is defined as the difference between what customers expect and what they perceive from the service provided (Zeithaml, et al., 2006). According to Bailey (2018), a gap is produced when the perceptions of the delivered service differ from what the customer previously had expected. In support, Dudovskiy (2012) notes one of the common reasons for customer disappointment is the service gap. This gap is fundamentally saying that regardless of whether the executives effectively perceive customer desires, there are still probabilities of customer disappointment emerging from error in readiness quality administration as per customer desire (Dudovskiy, 2012). In pondering over this debate, Myoli (2010, p. 45) sees this gap as grasping how customers recognize the genuine service execution in contrast with what they recently anticipated. This is the difference amongst the qualities that a customer observes in a service delivery, compared to perception before receiving that particular service. If customer is not happy after receiving the service, then this is referred to as customer dissatisfaction, which is often a result of the difference between a customer’s expectation and a customer's perception.
The Gaps Model of Service Quality contains two main classes, specifically the Provider Gap and Customer Gap. These Gaps occur contained by a service- providing organisation. According to Lovelock and Patterson (2015), the Customer Gap signifies the difference among a perception of a service encounter and the customer’s expectation. The Provider Gap consists of four Gaps; namely the Services Design, Listening Gap and Standards Gap, the Service Performance Gap and the Communication Gap. These four Gaps, which occur within service organisations, are accountable for the Customer Gap that is Gap 5 Service Quality (Lovelock & Patterson, 2015).
The customer gap, which is the gap that exists between the customer expectation and perception of a service, is the fundamental basis of the Gaps model. According to Eastman, Teicholz, Sacks, and Liston (2011), this model is used by many
19
companies around the world and assists management in ascertaining information which ultimately results in providing a model of how service quality should work (Eastman, et al., 2011). Most companies who strive to maintain or create a sustainable competitive advantage know that the idea of customer service and customer satisfaction are at the forefront of its business strategy (Eastman, et al., 2011). The Figure 2 below shows the Gaps Model which were recognised by Parasuraman and his co-researchers in 1985.
Figure 2: The Gap Model (Source: Naik, et al., 2010, p. 240)
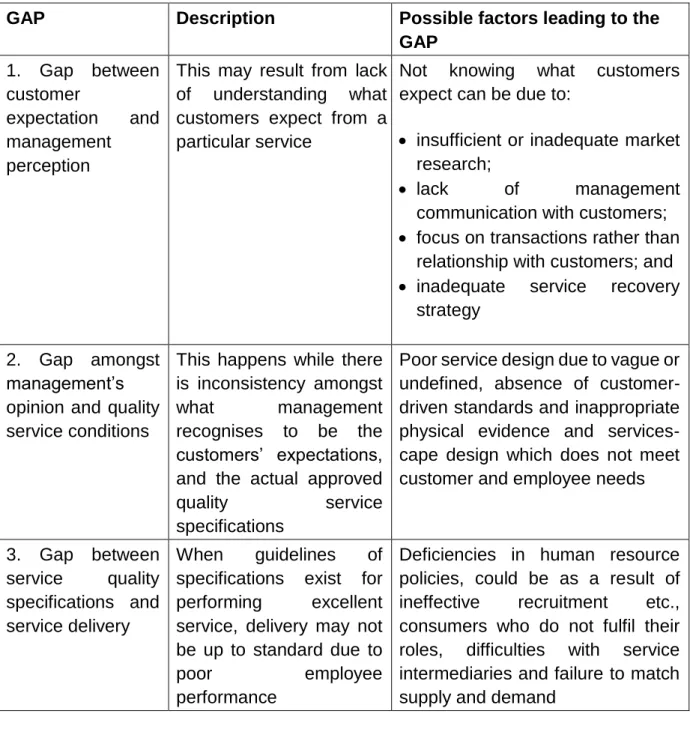
The five gaps that were identified by the above study are described below. They include;
20
Gap 1: Consumer Expectations – Management Perception Gap
This gap refers to a discrepancy between top management or company perceptions and consumer expectations (Myoli, 2010). Business executives in this case may not continuously comprehend what features represent high quality to consumers, what features a service must possess in order to meet these customers’ needs and at what level the features which are required to provide high quality service will be accomplished (Myoli, 2010). The outcome of this discrepancy may activate a chain of wrong decisions and suboptimal resource allocation that result in perceptions of poor service quality (Dudovskiy, 2012). In order to go beyond customer expectations and in order to ensure customer fulfilment, management of service businesses must have a sound and precise perception about customer expectations. The deficiency of such knowledge produces a gap that might possibly the key reasons for service consumers’ unsatisfactory (Dudovskiy, 2012).
Gap 2: Management Perceptions – Service Quality Expectations
Naik, et al., 2010, state that this gap includes the difference between management’s understanding of consumer expectation and the development of customer-driven service designs and standards. This gap basically confirms that customer dissatisfaction are triggered by insufficient planning to meet customer expectation (Dudovskiy, 2012). A study by Dudovskiy (2012) points that there should be no limitations of resources or lack of commitment management that can deprive the consumer to be rendered a service quality that the consumer requests (Dudovskiy, 2012).
Gap 3: Service Quality Specifications – Service Delivery Gap
This gap involves the differences among the enlargement of customer oriented standard of service and real service performance (Dudovskiy, 2012). The argument set forth here is that there could be complications in standardising employee performance despite existence of guidelines for execution the service well and handling customers correctly (Myoli, 2010, p. 44). This could be especially so with a service oriented business where performance is intangible compared to a tangible
21
product. According to (Dudovskiy, 2012) Dudovskiy, (2012) customer displeasure is usually a result of poor work ethic and working conditions.
Gap 4: Service Delivery – External Communications Gap
The gap comprises of the difference between the actual service performances as well as what is communicated, which can influence consumer expectations (Myoli, 2010). Media advertising and other forms of communication can influence customer expectations (Batra & Keller, 2016). However, once there is a gap between the message communicated and actual performance, perceptions are either lower or higher (Myoli, 2010, p. 45). Difficulty may occur when a campaign that promises exceptional services is not communicated to the staff who deals with those customers. This may result in a distortion of the message and low perceptions of that service (Batra & Keller, 2016). For example, EMECC may promise the residential customers a response after twenty-four hours the fault was reported, while the servicing of the fault will depend on the number of faults reported before that consumer. The promise is not fulfilled and then the consumer is frustrated as to why they were not given a realistic information. According to Dudovskiy (2012), the external factors have the ability to cause poor customer satisfaction even though requisite skills and attitude are in place.
Gap 5: Expected Service – Perceived Service Gap
This gap embraces what way customers distinguish the actual service performance in comparison from what they anticipated (Myoli, 2010, p. 45). The perception of the quality differs from customer to customers on basis of the enormity of the gap (Myoli, 2010, p. 45). Service quality as perceived by customers is dependent on the number of encounters they have with the service and is a function of their needs and desires (Dudovskiy, 2012). Satisfaction of consumers is also a function of their expectations and the perceived gap is between what they expect and actual performance (Myoli, 2010). In addition, the fundamental causes for dissatisfaction lie in perceived gap between expectation and service (Dudovskiy, 2012).
22 2.6 The Customer Gap
According to Fourie (2015, p.39), the Customer Gap, also called “Gap 5” is the fundamental emphasis of the Gaps Model and can be presented as “the distance we have with our customers, a measure of the degree of disconnection we have with them”. In addition, the more the disconnection, the more the Customer Gap will be. This Gap signifies the difference among what customers assume and what they perceive (Fourie, 2015). This research focused on Gap 5, where customers were given opportunities to measure customers’ expectations and perceptions at EMECC. A study pointed out that the Customer Gap can be written as “Expected quality by a customer = perceived quality – expected quality” ( (Dudovskiy, 2012). Customer dissatisfaction is often a result of the gap between a customer’s expectation and perception. This gap can be addressed by exceeding customer expectation which will lead to improved competitive advantage. Fourie (2015), indicates that the outcome of the resultant customer gap can be projected in that it was discovered that customer loyalty and dissatisfaction is directly linked to a higher customer gap.
2.7 Service Quality
In the present competitive scene, one of the critical influences that competitive advantage is providing a quality service is that it will please the consumers (Chuang
& Lin, 2017). According to Eid (2015), customer satisfaction is an essential element in any organisation for customer retention, customer loyalty and profitability. In any competitive market, customer satisfaction is at the centre of focus for many companies as this ensures a competitive advantage over a competitor. The other key variables in maintaining customer loyalty are service quality and effective front line employees (Eid, 2015). When these three aspects are combined, the effect is customer satisfaction, loyalty and retention. Ultimately this will ensure long term company benefits such as continued organisational existence and brand recognition. The utmost significance of service quality for consumer satisfaction and loyalty is lengthily captured in literatures as well as its connection with service
23
provider’s success (Amorim & Saghezchi, 2014). Yuen and Thai (2015), state that there is enough evidence that validate relationship between service quality and customer behaviour.
According to Lovelock and Patterson, (2015), services marketing has shown that the customer attempts to provide the customer the best services, thereby only making promises that can be kept. Marketing is all about sustaining the wants and desires of the customer. Consequently, the success of providing a quality service depends on the hands of managers and front-line employees (Rahi, 2016).
Organisational managers encounter increasing stress to determine a customer- focused service whereby customer expectations are met in order to establish approaches of closing service-quality gaps (Rahi, 2016). Due to the improved opposition among businesses, management is forced to focus on the quality of services provided to their customers (Lovelock & Patterson, 2015). Therefore, it is of utmost importance for organisational management team to understand the importance of a service culture that will enhance and inspire customer retention, development and loyalty towards their business, and enhance their market performance.
According to Rahi, (2016), the eThekwini Municipality’s Electricity provides electricity to all types of customers to satisfy their needs while still continuing business by supplying public lighting, domestic and businesses. EThekwini Municipality may be considered as the sole provider of electricity, which contributes to the domination regarding the supply of electricity. The Figure 3 below shows the Service Quality.
24
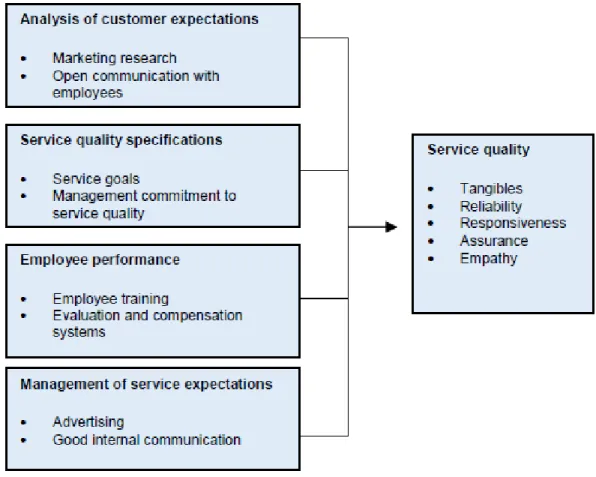
Figure 3: Service Quality (Source: Fourie, 2015, p. 31)
Research by (Fourie, 2015, p. 31) indicates that management of organisations must pay closer care to service processes. The study demonstrated that apparent service is directly influenced by service delivery, and that service delivery is as a result of employee’s performance (Fourie, 2015). The difficulties of catering for various customers’ makes quality service particularly perplexing, as all customers have practised poor service at some point in time. It is crucial that organisations take relevant steps to growth their service quality by considering the four factors that affect service quality, namely; an exploration of customer expectations, service quality specifications, employee performance, and management of service expectations (Fourie, 2015, p. 31).
25 2.7.1 Importance of Service Quality
Lee, et al., (2016) state that both manager and academic scholars have prioritized attention to quality and customer service in their different fields. According to Abedin, Rahman and Mohiuddin (2016), managerial decision is largely influenced by service quality and relevant contacts in any system. The understanding and knowledge of service quality, service and customer service have increased nowadays through publication dedicated to these topics. Organizations should pay more attention to improving service quality and its dimensions and keep on providing the high quality service to meet customer expectation. The customers will remained to the organization although there is a competition because of the excellent customer service they received (Fong, et al., 2017).
Lee, Wang, Chien, Wu, Lu, Tsai and Dong (2016), are of the opinion that poor performance in a service organisation can often be accredited to lack of understanding of the customers’ needs from the company and their subsequent expectation of that service. Providing quality service has therefore become a challenging and dynamic task for many managers (Lee, et al., 2016). The measure between the service provided and the customer’s expectation of the level of service is denoted as service quality (Abedin, et al., 2016). Fong, et al., (2017) are of the view that conforming to customer expectation regularly is what service quality is all about. Others propose that different customers want different levels of service from the same organization and want to at least meet their desires, if not exceed them (Lee, et al., 2016). For this reason, service quality is determined by the difference between the levels of service customers receive compared to the level of service which they desire (Lee, et al., 2016).
2.7.2 Measuring of Service Quality
Two key attributes are present among the distinctive administration quality models accessible. First, these models are assembled on customers’ perceptions regarding the performance of service delivery, instead of an unbiased assessments of quality items (Amorim & Saghezchi, 2014). A second characteristic that is current in the
26
existing quality models is the multidimensional nature of service quality (Amorim &
Saghezchi, 2014). Businesses provide consumers with a combination of consequences, such as: direct process results (e.g. readiness of necessary items in a retail store, on-time arrival to a flight destination in transportation services, etc.) alongside with other results related to the process experience originating from consumers’ contact and participation in the service process (Amorim & Saghezchi, 2014). According to Lovelock and Patterson (2015), it is essential to measure service quality because of the common belief of what is not measured is not managed. If service quality cannot be measured, managers will have doubt whether service quality gaps exists, where they exist, which gap should be closed, and what possible action should be taken (Lovelock & Patterson, 2015).
The service quality is not easy to measure and it is difficult to obtain. Dissimilar product where there are detailed provisions such as color, length, width, depth, weight, etc. a service can have many insubstantial or qualitative specifications (Abedin, et al., 2016). There is an expectation from the consumer with concerns to the service, which may differ noticeably based on a range of aspects such as personal needs, previous knowledge and what other people influence with (Fong, et al., 2017). According to Naik, et al., (2010), SERVQUAL is one of most used instrument for measuring service quality which is discussed in details later.
Another key element to be kept in mind while looking to sustain service quality should be to have measures in place (Naik, et al., 2010). Any type of business depends on what service business model is applied and the customer expectations.
For EMEU, the metric could be how long it takes for a call to be attended and how long it will take for the electricity to be restored. As soon as a system is set up for service quality measure, a standard service quality can then be established for the organization is looking for to preserve (Sibiya, 2013).
2.7.3 Maintaining Service Quality
After reaching an expected service level, the service providers should make sure that the correct service standard quality is maintained at all times (Management
27
Study Guide "MSG", 2017). The organization should be able to set up standards and policies of customers’ service quality at the first time (Sarrico, et al., 2013).
Yuen and Thai (2015) propose that companies should provide their staff suitable training and expansion after they are employed. The employees need to acquire the skills and abilities essential for the trades offered. The more accomplished specialists have skills for a specific employment, the less preparing they will require (Yuen & Thai, 2015). As expertise is getting more progressive, an incredible organization will be devoted to continually retraining and instructing its representatives with the goal that the workers will have the reasonable front line information of the work (Yuen & Thai, 2015). According to Sarrico, et al., (2013), service quality is the extent to which an organisation is able to fulfil the desires of customers. The crucial expectation of any customer is to get the top and cost saving service, which can only be delivered by a well-trained workers (El Saghier, 2015).
Yuen and Thai (2015) further recommend organisations retain their knowledgeable employees and use their decision, which can assist in managing cost. This outcome can only be accomplished by well-trained employees, as an organisation is assessed by how swiftly it can answer to customer needs and problems (Yuen &
Thai, 2015). The customers can easily assess a company by the employees who are answering the phone at the office or call centres, greeting them and answering to their grievances (Amorim & Saghezchi, 2014). In general, public demand the best service and require it quickly. Therefore, the significance of creating an encouraging environment for the staff or employees working in the organisation; and the staff need an organisational structure that is not limited to only what an employee is employed for, but to allow them to be the best employee (Amorim & Saghezchi, 2014). Lack of accurate information which is a direct result of poor training will lead to substantial customer dissatisfaction (Bakti & Sumaedi, 2015). At eThekwini Electricity, it is perceived that there is gap with regards to front-line employees with regards to proper skills. EThekwini Electricity has not done many surveys in order to get customer’s expectations and perceptions. Bakti and Sumaedi (2013), recommends that front-line employee should be provided with suitable training for new staff; early training and also follow-up training within 90 days. Secondly, the
28
implementation of refresher course that will be done after every 90 days. This refresher course will be applicable to all front-line employees or staff that interact with customers. This suggestion may not be applicable to all organisation but each organisation is expected to come up with what will fit the current gap in their operation. Thirdly, after a negative evaluation on any customer relations, solutions to such incident not repeating itself should also be in place (Batra & Keller, 2016).
2.8 SERVQUAL MODEL
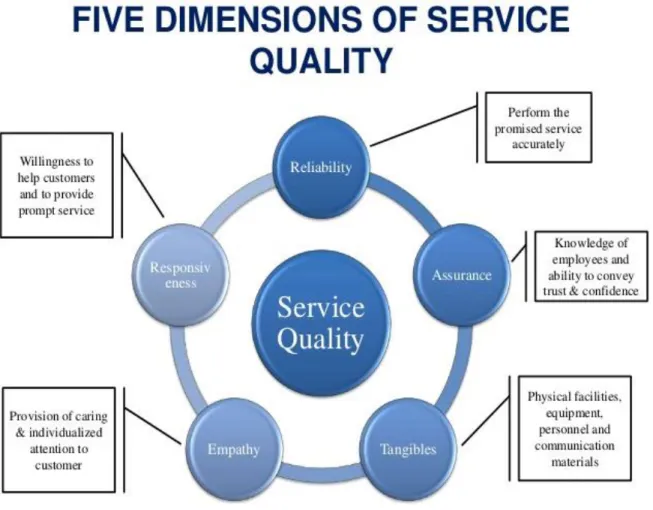
SERVQUAL (SQ) is unique when compared to most generally used scales within practice that measures consumers' impression of service quality. SQ has been established to be relevant for an extensive variety of administration commercial projects (Naik, et al., 2010). SQ is focused on carrying out a gap analysis and investigation of five separate business and five measurements structure tools namely, Reliability, Tangibles, Assurance, Responsibility and Empathy (Naik, et al., 2010).
SQ, formed by Parasuraman is generally employed by both scholars and experts (Naik, et al., 2010). SQ is concentrated around the gap model of service quality, which characterises service quality as a capacity of the whole between desires of a specific service and impression of the actual service experienced by the customer. According to Chuang and Lin (2017), the verbal communications; the personal needs; previous experience and exterior communications can sway the customer’s expectations. A gap is formed when the perceptions of the service delivered is not the same as what the customer expected (Bailey, 2018). This gap is reviewed by recognising and executing approaches that affect perceptions, or expectations, or both (Naik, et al., 2010). Parasuraman, et al., (1985) states that SQ had been considered to be “applicable across a broad spectrum of services” and the format could be adapted to fit specific needs, and that it would be most valuable when utilised to track service quality trends occasionally. They suggested that the SQ model could be prolonged to measure gaps in quality and could therefore be used as a diagnostic tool to empower management to identify service quality shortfalls (Amorim & Saghezchi, 2014). The gap score is achieved by the perception
29
proclamations being taken from the expectation statements. If any gap scores is positive, then this implies that expectations are actually being exceeded (Hofmans, et al., 2013). The service managers have an opportunity to allocate their resources to areas that are not doing well or underperformance. The SQ instrument ascertains the level of service quality based on the five key dimensions and also identifies where gaps in service exist and to what extent (Yuen & Thai, 2015).
2.8.1 Strengths and Weakness of the SERVQUAL Tool
SQ questionnaire and its structure have been widely exploited and recognised.
Through numerous studies, a number of paybacks have been drawn from using this survey to measure service quality (Amorim & Saghezchi, 2014);
1. It is a recognized standard for evaluating service quality of the multidimensionality
2. It has been statistically confirmed to be reasonable in a variety of service situations
3. It has confirmed to be consistent
4. It has a standardized analysis procedure
5. The questionnaire sets a quantity of closed questions that it is simple and easily completed
Although SQ addresses the gap amongst expectations and perceptions, actual service criticism is applied to the validity of the five dimensions (Yuen & Thai, 2015).
The criticism applied to this gap model is the fact that there is little evidence that proves that service quality is viewed by customers as gap between perceptions and expectations (Yuen & Thai, 2015). Some review on the SQ also debate on the context of the conceptual and operational differences between service quality and customer satisfaction (Amorim & Saghezchi, 2014). This view argues that these two constructs may be related to each other or different to each other, or may be conceptual companions whose connections may be dependent on a number of other considerations (Sarrico, et al., 2013) . Other views also claimed that the model is generic and can be applied invariantly across all contexts, of which there have