A review of adolescent nutrition in South Africa: transforming adolescent lives through nutrition initiative
Stephanie V Wrottesleya* , Titilola M Pedroa, Caroline H Fallb and Shane A Norrisa
aSAMRC/Wits Developmental Pathways for Health Research Unit, Department of Paediatrics, University of the Witwatersrand, Johannesburg, South Africa
bMRC Lifecourse Epidemiology Unit, University of Southampton, Southampton General Hospital, Southampton, UK
*Corresponding author, Email: [email protected]
Objective:In South Africa, urbanisation is associated with substantial burdens of adolescent overweight and obesity, making teenagers vulnerable to longer-term non-communicable diseases. In addition, as potential future parents, the nutritional status of adolescents is increasingly recognised as a key driver of health and well-being in the next generation. This review reported on the available literature examining nutritional status and dietary intakes and practices, as well as their determinants, in South African adolescents.
Study design and methods:Medline (Pubmed), Web of Science and EMBASE were searched for relevant articles published between 1994 and May 2018. Applicable search terms and phrases were identified in study titles and/or abstracts and full- text articles were reviewed according to inclusion/exclusion criteria. Data were extracted according to specific review objectives.
Results: A total of 67 relevant studies were identified. Only one study used a biochemical marker to describe adolescent nutritional status (vitamin D status; 25(OH)D). Overweight and obesity prevalence increased in South African adolescents over the reference period, with national increases of 6% in boys and 7% in girls between 2002 and 2008. Girls and urban- dwellers were particularly vulnerable to excess adiposity. Dietary intakes demonstrated a transition towards energy-dense, processed foods high in sugar and fat, but low in essential micronutrients. Food choices were driven by the adoption of obesogenic behaviours in the teenage years, including irregular breakfast consumption and fewer family meals, increased snacking and low levels of physical activity.
Conclusion: South African adolescents—particularly girls—are increasingly burdened by obesity as a result of urbanisation- associated shifts in dietary intake and eating behaviours. However, the implications for micronutrient status and long-term nutritional health are not known. Additionally, more data on the clustering of diet, activity and sedentary behaviours in adolescent boys and girls is needed, as well as on behaviour patterns to facilitate healthy growth and reduced adiposity.
KeywordsAdolescence, diet, physical activity, South Africa
Introduction
Adolescence is a period of growth and development that is increasingly being recognised as a critical window for optimising the health and well-being of current and future generations.1,2 While it is principally defined by the puberty-associated physio- logical changes that characterise a child’s transition to adult- hood, adolescence encompasses a range of developmental changes that form the foundation of one’s ability to thrive phys- ically, socially and emotionally as an adult.1,3 In addition, the interplay between early life (prenatal, infant and childhood) growth and development and the physical and social environ- ment experienced during adolescence may play a critical role in shaping the health trajectory of an individual, as well as of any future offspring.2,3
It is widely accepted that optimising growth and development during the first 1 000 days of life can result in substantial benefits, namely: reductions in childhood morbidity and mor- tality risk; improvements in cognitive and motor development, school performance and economic productivity in adulthood;
and reductions in the risk of becoming obese or developing non-communicable diseases (NCDs) in later life.4 While the importance of maternal nutrition and lifestyle in programming early growth and development is well established, research and intervention strategies have focused largely on nutritional status, diet and physical activity during pregnancy when the
maternal risk profile is already established and the scope for affecting both maternal and infant outcomes is limited.5–7 In addition, there has been a lack of focus on the role that paternal nutritional status, attitudes and behaviour may have on the off- spring both physiologically and at the level of partner and/or parental influence.2,8,9As shown recently by Pattonet al., prior- itising adolescent nutritional status in both females and males, as well as promoting healthy attitudes and behaviours around diet, physical activity, substance use and stress in this popu- lation, are critical to improving the intergenerational trans- mission of health and well-being.2 In addition, it provides a window for intervention, during which investment is likely to yield substantial benefits for health, social development and economic growth and capacity.2,10
Adolescents and youth (10–24 years of age) constitute almost one-quarter of the world’s population, with more than 80% of this group living in low- and middle-income countries (LMICs).11 While improvements in childhood nutrition and health, education and rapid technological advancements, as well as access to effective contraception and delayed timing of parenthood, provide a platform upon which adolescents should thrive, their health and well-being face substantial threats during this time.1,3As individuals progress through ado- lescence their exposure to social health determinants undergoes a considerable shift. This means that the parental/family-
https://doi.org/10.1080/16070658.2019.1607481 Open Access article distributed under the terms of the Creative Commons License [CC BY-NC 4.0]
http://creativecommons.org/licenses/by-nc/4.0
SAJCN
ISSN 1607-0658 EISSN 2221-1268
© 2019 The Author(s)
REVIEW ARTICLE
South African Journal of Clinical Nutritionis co-published by NISC (Pty) Ltd, Medpharm Publications, and Informa UK Limited
(trading as the Taylor & Francis Group)
dominated determinants of lifestyle choices in childhood expand to include the influence of peers, the community, culture, edu- cation, the media and the economy.10 Within this context, growing levels of independence make adolescents highly suscep- tible to the adoption of obesogenic behaviours that may persist into adulthood, thereby increasing the risk of obesity and NCDs in later life.1,10,12,13In LMICs rapid urbanisation exacerbates this by exposing young people to increasingly Westernised diets— high in saturated fat, added sugar, salt, processed/convenience foods and edible oils—in environments characterised by low levels of physical activity.14–16This is particularly relevant in sub- Saharan Africa where overweight and inactivity rates are com- paratively higher than in other LMIC regions.17
In South Africa, where this nutrition transition has progressed con- siderably, approximately 27% of females and 9% of males are overweight or obese by 15–19 years of age, with those living in urban settings being particularly vulnerable.18 Additionally, since the dawn of South Africa’s democracy in 1994, policy changes around food production, composition and availability, as well as economic accessibility and education, have further reshaped the landscape of food consumption and activity pat- terns, predominantly in previously restricted black commu- nities.19–21 These policy changes are outlined in Table 1.
Particularly since 1994 school feeding programmes have been implemented and expanded, and child support grants
established, to improve food security at both individual and household levels. In 1995 a multi-sector policy aimed at addres- sing both clinical (leading to hospitalisation) and sub-clinical malnutrition was introduced and in 2003 a mandatory micronutrient fortification policy for maize and wheat was devel- oped. More recently policies for salt reduction (2016) and sugar- sweetened beverage taxation (2017) were introduced in response to the country’s rising obesity and NCD burdens. While these gov- ernment policies highlight that nutrition-based issues are on the national agenda, their coverage and effectiveness are widely debated and their impact on adolescent nutrition is less clear.
Although individual studies have explored nutritional status, dietary intake and physical activity, as well as perceptions and attitudes around healthy eating and body image in rural and/
or urban South Africa, relationships between these components and their determinants are not known. A comprehensive exam- ination of nutritional health and well-being in the adolescent population is therefore critical to understanding the possible means of addressing the rapidly growing obesity epidemic in this—and future—generations.
In this review our aim was to report on the available literature examining nutritional status and dietary intake and practices, as well as their determinants, in South African adolescents.
Data were therefore reviewed according to five specific Table 1:National policy changes that may impact adolescent nutritional status in South Africa (1994–2017)
Policy area/programme Year Action(s)
School feeding programme 1994 School feeding schemes started in primary schools: one meal per day provided; tier 1–3 schools Non-racial schooling Non-racial education system established in new democracy
Child support grant Child support grant can be claimed for children < 7 years
Integrated nutrition programme 1995 Introduction of a multi-sectoral programme aimed at addressing malnutrition by targeting the following key focus areas: (1) household food security; (2) disease-specific nutrition support; (3) food service management; (4) micronutrient malnutrition control; (5) growth monitoring and promotion; (6) nutritional promotion, education and advocacy; (7) breastfeeding; (8) nutrition programme monitoring and support
School fees 1996 Free Primary Health Care for pregnant women and children < 5 years
School feeding programme 1998 Increased funding
Prevention of mother-to-child transmission (PMTCT)
PMTCT programme started for the prevention of vertical transmission of HIV School feeding programme 2000 High school children receive one free meal per day; tier 1–3 schools Child support grant 2002 Child support grant extended to < 9 years
Child support grant 2003 Child support grant extended to < 11 years
Food fortification Mandatory fortification of all maize meal and bread wheat flour with the following micronutrients:
vitamin A, thiamine, riboflavin, niacin, pyridoxine, folic acid, iron, zinc
PMTCT Pregnant HIV-positive women with CD4 counts≤200 eligible for ART
Child support grant 2004 Child support grant extended to < 14 years Child support grant 2005 Child support grant extended to < 15 years
School fees Free basic education (Grade R–Grade 9) for children attending Tier 1–3 schools Maternal and child health 2007 Pregnant girls no longer expelled from school and some care for pregnancy provided Child support grant 2010 Child support grant extended to < 18 years
The Tiger Brands Foundation in-school breakfast feeding programmea
2011 Children in Tier 1 and Tier 2 schools (primary and combined) receive a daily breakfast at school (8 provinces)
HIV 2013 HIV-positive individuals with CD4 counts≤350 eligible for ART
Salt reduction Release of salt regulation policy to reduce content in processed food products
HIV 2014 HIV-positive individuals with CD4 counts≤500 eligible for ART
Salt reduction 2016 Mandatory compliance with maximum limits for salt content by manufacturers of the following food products: bread, breakfast cereals, margarines and butter, savoury snacks, potato crisps, processed meats, sausages, soup and gravy powders, instant noodles, stocks
Sugar-sweetened beverage tax 2017 Taxation of all sugar-sweetened beverages (i.e. those with added caloric sweeteners) by 2.1 cents/g
aPartnership with the Department of Education to extend the national school feeding programme.
A review of adolescent nutrition in South Africa 95
objectives that summarised the following variables in rural and/
or urban South African adolescents (10–20 years):
(1) nutritional status (anthropometric, biochemical and dietary indicators of macro- and micronutrient intakes);
(2) food consumption, dietary patterns and eating habits;
(3) diet, eating habits and demographic and lifestyle factors (age, setting, socioeconomic status (SES) etc.) and their associations with adolescent adiposity (e.g. body mass index [BMI]/fat mass);
(4) body image perceptions and eating attitudes;
(5) qualitative perceptions of, and attitudes towards, healthy eating and physical activity.
Methods
Search strategy
Comprehensive literature searches were performed in March 2018 by a team of researchers. Searches identified all available studies describing adolescent nutritional status, and its determinants, since the establishment of democracy in 1994. Searches were con- ducted using the following databases: Medline (Pubmed), Web of Science and EMBASE. Searches included the following search terms and phrases, as well as any applicable variations: adolescent and anthropometry/(specific anthropometric measure of interest, e.g. body mass index)/nutrition/(specific nutrient of interest, e.g.
protein or iron)/(specific micronutrient deficiency of interest, e.g.
anaemia)/(specific nutritional biomarker of interest, e.g. ferritin)/
(specific dietary intake assessment method of interest, e.g. food frequency questionnaire) and Africa (full description of search terms is provided in Supplementary Appendix A). Search terms and phrases were used in various combinations for identification in study titles and/or abstracts. Full-text articles were obtained and reviewed to select those meeting the inclusion/exclusion cri- teria described below. Data were subsequently extracted from rel- evant publications into appropriate tables.
Selection criteria Inclusion criteria
1. Studies conducted in South Africa.
2. Studies conducted in males and/or females aged 10–20 years.
3. Any study design.
For observational studies:
. studies that described adolescent nutritional status (assessed using anthropometry and/or objectively measured body composition [weight and/or height and/
or BMI and/or waist circumference and/or body fat percen- tage] and/or biochemical indicators and/or reported dietary intakes) as an exposure and/or outcome; and
. studies that used quantitative methods to assess attitudes and/or perceptions and/or degree of satisfaction towards nutritional status (body size, composition, diet) or behaviours.
For intervention studies:
. nutritional intervention studies done in adolescents (with or without physical activity component(s) incorporated) with dietary values and/or where biochemical indicators from both the intervention and control group could be extracted.
For qualitative studies:
. studies that explored thoughts on dietary behaviours and practices (with or without physical activity) and their determinants;
. studies that explored perceptions and attitudes towards healthy dietary and lifestyle (e.g. physical activity) practices;
. studies using any of the following qualitative research methods: observations, face-to-face interviews, focus- group discussions; and
. studies using any qualitative analytical methods.
4. Studies published in peer-reviewed journals and/or as aca- demic dissertations
Exclusion criteria
1. Studies conducted in animals.
2. Studies conducted in languages other than English.
3. Studies published prior to 1994.
4. Studies which do not describe nutritional status (anthropo- metry and/or biochemical indicators and/or reported dietary intakes) using aggregate data summarised as mean (SD) and/or median (IQR or 95% confidence interval).
Results
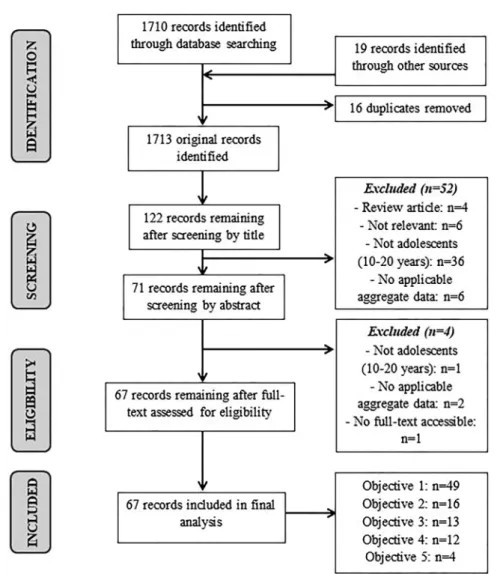
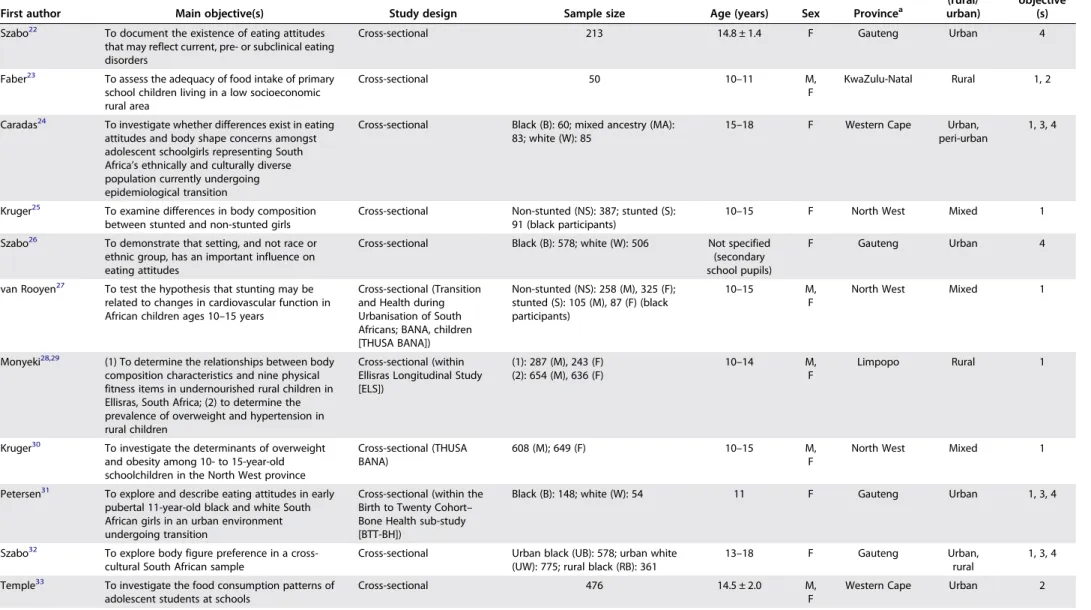
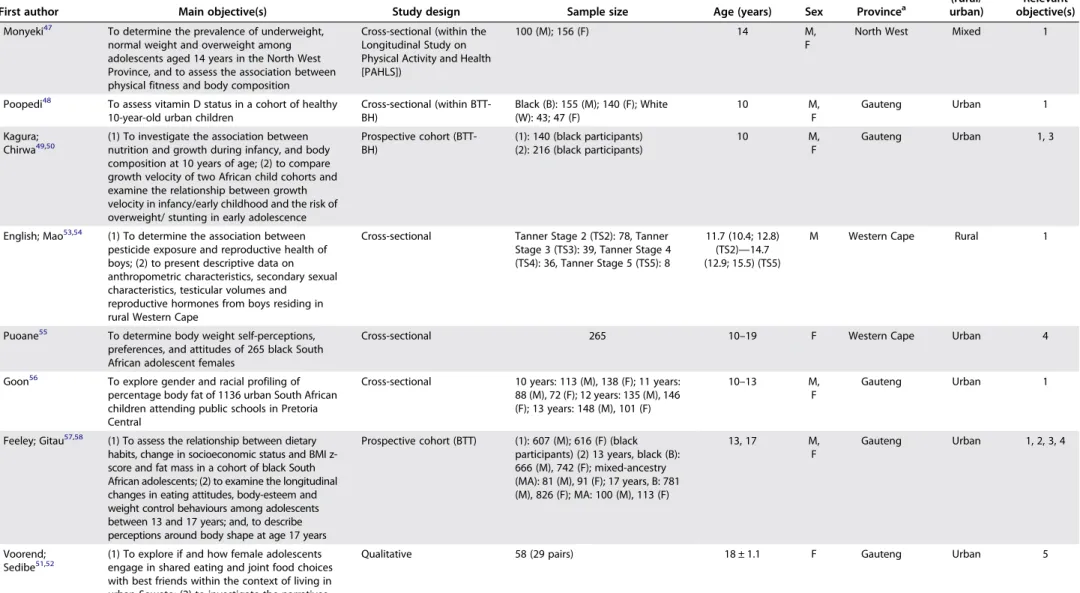
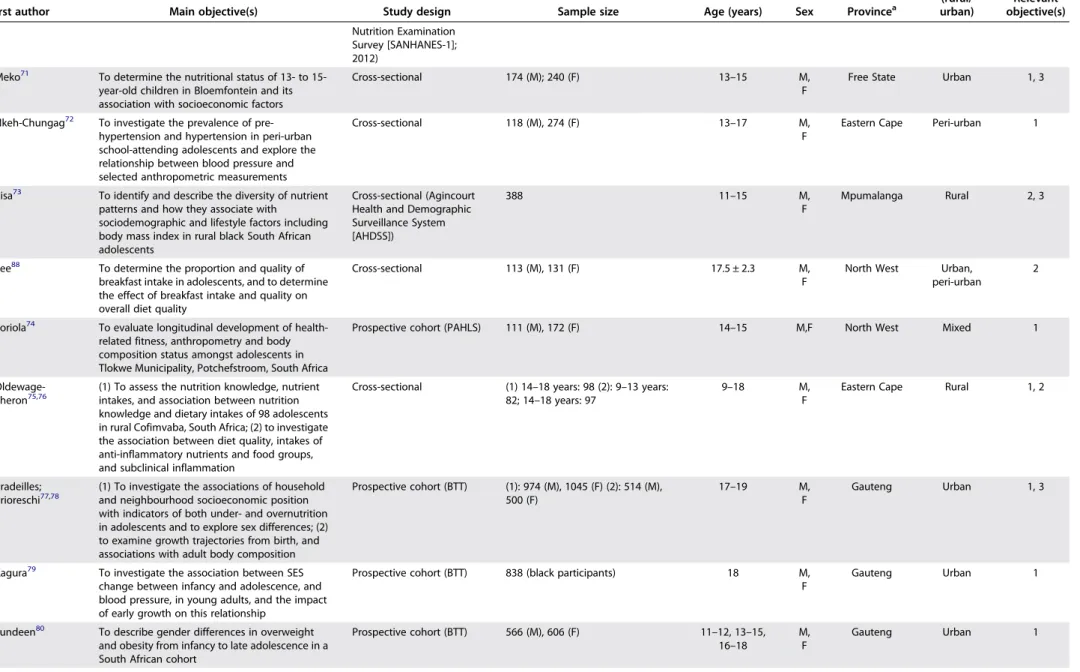
In total, 67 studies met the inclusion/exclusion criteria (Figure 1) and their characteristics are described inTable 2.22–88
The majority of studies were conducted within eight of South Africa’s nine provinces (i.e. the country’s principal administrative districts); specifically: Eastern Cape (n= 3),72,75,76Free State (n= 1),71 Gauteng (n= 25),22,26,31,32,35–37,40,46,48–52,56–58,61–63,69,77–80
KwaZulu -Natal (n= 3),23,59,60Limpopo (n= 4),28,29,81,83
Mpuma- langa (n= 8),44,45,66–68,73,82,86
North West (n= 9)25,27,30,42,47,64,65,74,88
and Western Cape (n= 8).24,33,41,43,53–55,84
In addition, two studies compared adolescents across provinces (Mpumalanga vs. Limpopo85; Mpumalanga vs. Gauteng87) and four used national survey data.34,38,39,70Eleven pairs of studies were based on the same study sample and are therefore pre- sented together.28,29,38,39,44,45,49–54,57–60,66,67,75–78 The publi- cation year ranged from 1997 to 2018. Sixteen studies used quantitative cross-sectional or longitudinal data (various ages between 10 and 19 years) from the Birth-to-Twenty (BTT) cohort, an urban longitudinal birth cohort in Soweto, Gauteng (n= 3273).31,35–37,46,48–50,57,58,61,77–80,87
Of the remaining studies, 47 followed quantitative cross-sectional designs and four were qualitative studies.51,52,68,83
Sample size ranged between 50 and 3 490 for quantitative studies and between 22 and 58 for qualitative studies. 19 studies were conducted in rural contexts23,28,29,44,45,53,54,59,60,66–68,73,75,76,81,82,85,86and 35 in urban and/or peri-urban contexts22,24,26,31,33,35–37,40–42,46,48– 52,55–58,61–65,69,71,72,77–80,84,88; with two studies comparing rural and urban populations.32,87Ten studies included mixed popu- lations25,27,30,34,38,39,43,47,70,74 and one did not specify the context.83 Twelve studies included specifically black adoles- cents25,27,34,35,37,42,49,50,57,65,79,87and one specifically white ado- lescents,69 with the remaining studies using populations of mixed ethnicities.
The results of the included scientific papers are structured and presented below according to the specific review objectives.
No weighting was applied across studies and therefore the data presented are actual findings per study.
Adolescent nutritional status
In total, 49 studies met the inclusion criteria for objective one.23–
25,27–32,34,35,38,39,42–45,47–50,53,54,56–60,62–67,70–72,74–81,84–87
Of the included studies, all but four described adolescent nutritional status using one or more of the following anthropometric measurements: height and weight, BMI and waist circumfer- ence.24,25,27–32,34,38,39,42–45,47–50,53,54,56–60,62–67,70–72,74,77–81,84–87
Where stunting prevalence was included, two studies used the WHO child growth standards43,71,89and one used the Centers for Disease Control and Prevention (CDC)/ National Center for Health Statistics (NCHS) growth charts34,90 to define stunting.
Five studies additionally included objectively measured body fat percentage via dual-energy X-ray absorptiometry (DXA),48,77air displacement plethysmography (ADP)42,65or bio- impedance.59One study used a nutritional biomarker (vitamin D status; 25(OH)D)48 and five used reported dietary intakes25,27,30,31,86
in addition to anthropometric assessments.
The remaining four studies used reported dietary intakes alone.23,35,75,76
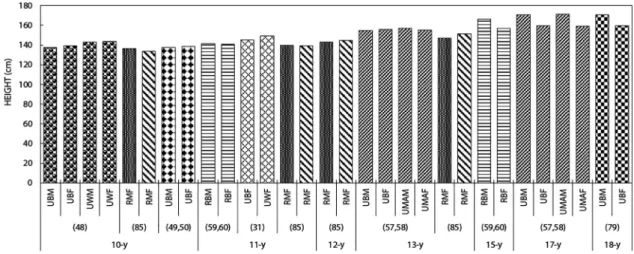
Weight, height and BMI (Figure 2)
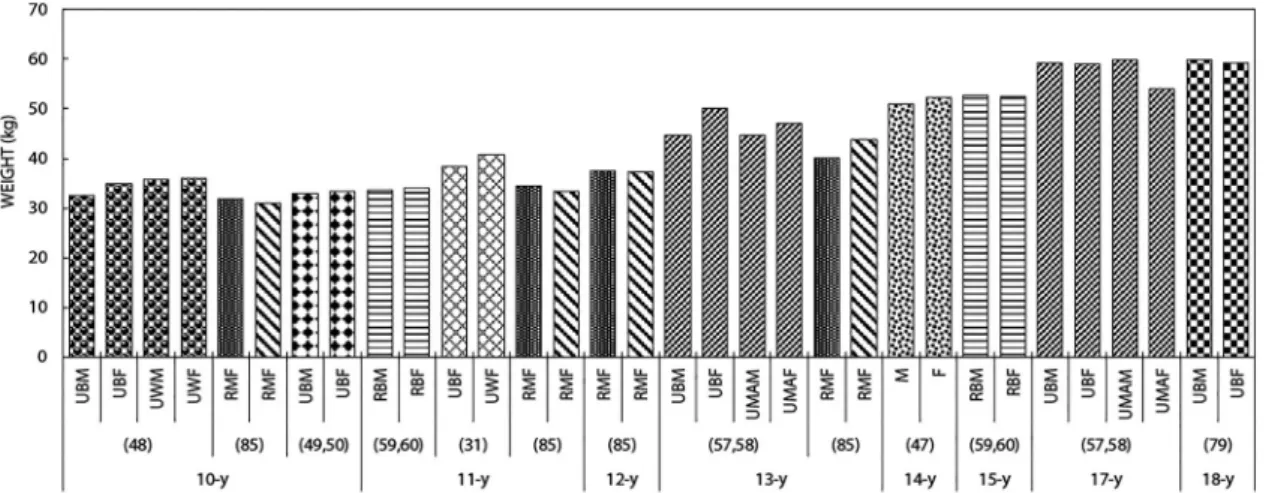
Studies showed an anticipated increase in both height and weight of South African adolescents between 10 and 19 years of age (Figures 2–5). Across age categories, white adolescents were taller than both their black and mixed-ancestry
counterparts and urban dwellers were taller than those from rural settings.24,31,32,48,66,67,87
Similar results were shown for weight; however, the differences according to ethnicity and rural vs. urban settings were less consistent across studies.
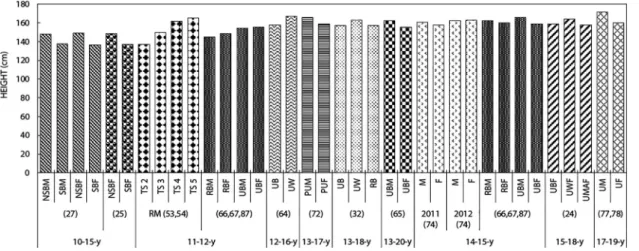
While height was similar in boys and girls between the ages of 10 and 13 years, boys were comparatively taller at older ages (15–18 years).48–50,57,58,66,67,77–79,87
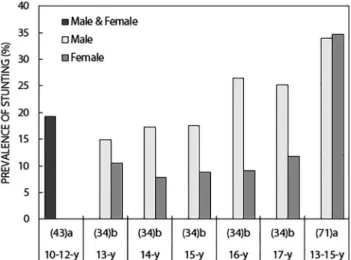
In addition, for boys aged 11–12 years, height was substantially higher in those who had reached greater sexual maturity according to Tanner staging.53,54Although females tended to be smaller in stature than their male counterparts as they aged, they were less likely to be stunted (height-for-age z-score (HAZ) <−2) through- out adolescence ([13 years, stunted: 14.9% (M), 10.5% (F)]; [17 years, stunted: 25.2% (M), 11.8% (F)])34 (Figure 6). Stunting prevalence was relatively stable across age groups in girls;
however, older boys demonstrated approximately 10% higher stunting prevalence than those of younger ages (17 vs. 13 years).34
National survey data demonstrated an increase in combined overweight and obesity prevalence in South African adolescents (13–19 years) between 2002 and 2008, with substantially higher prevalence in girls in both years ([2002: 7.9% (male, M), 29.3%
(female, F)]; [2008: 14.3% (M), 36.5% (F)]) (Figure 10).38,39Over- weight and obesity were defined using the International Obesity Task Force age- and gender-specific cutpoints for chil- dren and adolescents based on BMIs of 25 and 30 kg/m2 respectively at 18 years.91
Figure 1.Flow diagram to illustrate the results of the literature review.
A review of adolescent nutrition in South Africa 97
Table 2:Characteristics of studies meeting inclusion and exclusion criteria
First author Main objective(s) Study design Sample size Age (years) Sex Provincea
Context (rural/
urban)
Relevant objective
(s) Szabo22 To document the existence of eating attitudes
that may reflect current, pre- or subclinical eating disorders
Cross-sectional 213 14.8 ± 1.4 F Gauteng Urban 4
Faber23 To assess the adequacy of food intake of primary school children living in a low socioeconomic rural area
Cross-sectional 50 10–11 M,
F
KwaZulu-Natal Rural 1, 2
Caradas24 To investigate whether differences exist in eating attitudes and body shape concerns amongst adolescent schoolgirls representing South Africa’s ethnically and culturally diverse population currently undergoing epidemiological transition
Cross-sectional Black (B): 60; mixed ancestry (MA):
83; white (W): 85
15–18 F Western Cape Urban,
peri-urban
1, 3, 4
Kruger25 To examine differences in body composition between stunted and non-stunted girls
Cross-sectional Non-stunted (NS): 387; stunted (S):
91 (black participants)
10–15 F North West Mixed 1
Szabo26 To demonstrate that setting, and not race or ethnic group, has an important influence on eating attitudes
Cross-sectional Black (B): 578; white (W): 506 Not specified (secondary school pupils)
F Gauteng Urban 4
van Rooyen27 To test the hypothesis that stunting may be related to changes in cardiovascular function in African children ages 10–15 years
Cross-sectional (Transition and Health during Urbanisation of South Africans; BANA, children [THUSA BANA])
Non-stunted (NS): 258 (M), 325 (F);
stunted (S): 105 (M), 87 (F) (black participants)
10–15 M,
F
North West Mixed 1
Monyeki28,29 (1) To determine the relationships between body composition characteristics and nine physical fitness items in undernourished rural children in Ellisras, South Africa; (2) to determine the prevalence of overweight and hypertension in rural children
Cross-sectional (within Ellisras Longitudinal Study [ELS])
(1): 287 (M), 243 (F) (2): 654 (M), 636 (F)
10–14 M,
F
Limpopo Rural 1
Kruger30 To investigate the determinants of overweight and obesity among 10- to 15-year-old schoolchildren in the North West province
Cross-sectional (THUSA BANA)
608 (M); 649 (F) 10–15 M,
F
North West Mixed 1
Petersen31 To explore and describe eating attitudes in early pubertal 11-year-old black and white South African girls in an urban environment undergoing transition
Cross-sectional (within the Birth to Twenty Cohort– Bone Health sub-study [BTT-BH])
Black (B): 148; white (W): 54 11 F Gauteng Urban 1, 3, 4
Szabo32 To explore body figure preference in a cross- cultural South African sample
Cross-sectional Urban black (UB): 578; urban white (UW): 775; rural black (RB): 361
13–18 F Gauteng Urban,
rural
1, 3, 4 Temple33 To investigate the food consumption patterns of
adolescent students at schools
Cross-sectional 476 14.5 ± 2.0 M,
F
Western Cape Urban 2
SouthAfricanJournalofClinicalNutrition2020;33(4):94–132
Jinabhai34 To investigate the nutritional status of black South African teenagers by sex and compare this with nutritional profiles of teenagers from other countries
Cross-sectional [South African Youth Risk Behaviour Survey (YRBS);
2002]
13 years: 174 (M), 333 (F); 14 years:
400 (M), 604 (F); 15 years: 544 (M), 693 (F); 16 years: 669 (M), 716 (F); 17 years: 611 (M), 578 (F) (black participants)
13–17 M,
F
National Mixed 1
MacKeown35 To report on the energy, macro- and micronutrient intakes of a true longitudinal group of 143 urban black South African children
Prospective cohort (BTT) 143 (black participants) 10, 13 M,
F
Gauteng Urban 1
Pedro36 To report on the variety and total number of food items recorded by a true longitudinal group of urban black South African children from the BTT Study at five interceptions (ages: 5 [1995], 7 [1997], 9 [1999], 10 [2000], 13 [2003] years)
Prospective cohort (Birth to Twenty Cohort [BTT])
143 9, 10, 13 M,
F
Gauteng Urban 2
Feeley37 To assess of fast-food consumption in urban black adolescents
Cross-sectional (within BTT) 320 (M); 335 (F) (black participants) 17 M, F
Gauteng Urban 2
Reddy38,39 (1) To report the prevalence of underweight, overweight and obesity by gender, ethnicity and grade, among participants in a 2002 national survey among South African school-going youth;
(2) to study the prevalence and correlates of overweight and obesity among participants in the SA YRBS in 2002 and 2008
Cross-sectional (SA YRBS;
2002, 2009)
2002: 4184 (M), 5338 (F); 2008: 4565 (M), 4806 (F)
13–19 M,
F
National Mixed 1
Letlape40 To ascertain the knowledge of students on the composition of a healthy diet, daily nutritional requirements and the importance of regular exercise
Cross-sectional 209 (M), 276 (F) 15–18 M,
F
Gauteng Urban 2
Venter41 To investigate the dietary fat knowledge and intake of 17-year-olds
Cross-sectional 183 17–18 M,
F
Western Cape Urban 2
Zeelie42 To determine the relationship between body composition and selected markers of the metabolic syndrome in black adolescents
Cross-sectional (Physical Activity in the Young Study [PLAY])
Normal %fat (NF;≤20%): 72 (M), 29 (F); high %fat (HF; > 20%): 27 (M), 104 (F) (black participants)
15–19 M,
F
North West Urban 1
Abrahams43 To identify and describe factors associated with tuck shop and lunchbox behaviours of primary- school learners in South Africa
Cross-sectional 717 10–12 M,
F
Western Cape Mixed 1, 2
Kimani- Murage44,45
(1) To investigate predictors of adolescent obesity in rural South Africa; (2) to understand the profiles of malnutrition among children and adolescents in a poor, high HIV-prevalent, transitional society in a middle-income country
Cross-sectional (Agincourt Health and Demographic Surveillance System [AHDSS])
903 (M); 945 (F) 10–20 M,
F
Mpumalanga Rural 1, 3
Feeley46 To assess changes in the dietary habits and eating practices of a longitudinal cohort of adolescents over a 5-year period living in Soweto and Johannesburg
Prospective cohort (BTT) 1451 (black/mixed-ancestry participants)
13, 15, 17 M,
F
Gauteng Urban 2
(Continued)
AreviewofadolescentnutritioninSouthAfrica99
Table 2:Continued.
First author Main objective(s) Study design Sample size Age (years) Sex Provincea
Context (rural/
urban)
Relevant objective(s) Monyeki47 To determine the prevalence of underweight,
normal weight and overweight among adolescents aged 14 years in the North West Province, and to assess the association between physical fitness and body composition
Cross-sectional (within the Longitudinal Study on Physical Activity and Health [PAHLS])
100 (M); 156 (F) 14 M,
F
North West Mixed 1
Poopedi48 To assess vitamin D status in a cohort of healthy 10-year-old urban children
Cross-sectional (within BTT- BH)
Black (B): 155 (M); 140 (F); White (W): 43; 47 (F)
10 M,
F
Gauteng Urban 1
Kagura;
Chirwa49,50
(1) To investigate the association between nutrition and growth during infancy, and body composition at 10 years of age; (2) to compare growth velocity of two African child cohorts and examine the relationship between growth velocity in infancy/early childhood and the risk of overweight/ stunting in early adolescence
Prospective cohort (BTT- BH)
(1): 140 (black participants) (2): 216 (black participants)
10 M,
F
Gauteng Urban 1, 3
English; Mao53,54 (1) To determine the association between pesticide exposure and reproductive health of boys; (2) to present descriptive data on anthropometric characteristics, secondary sexual characteristics, testicular volumes and
reproductive hormones from boys residing in rural Western Cape
Cross-sectional Tanner Stage 2 (TS2): 78, Tanner Stage 3 (TS3): 39, Tanner Stage 4 (TS4): 36, Tanner Stage 5 (TS5): 8
11.7 (10.4; 12.8) (TS2)—14.7 (12.9; 15.5) (TS5)
M Western Cape Rural 1
Puoane55 To determine body weight self-perceptions, preferences, and attitudes of 265 black South African adolescent females
Cross-sectional 265 10–19 F Western Cape Urban 4
Goon56 To explore gender and racial profiling of percentage body fat of 1136 urban South African children attending public schools in Pretoria Central
Cross-sectional 10 years: 113 (M), 138 (F); 11 years:
88 (M), 72 (F); 12 years: 135 (M), 146 (F); 13 years: 148 (M), 101 (F)
10–13 M,
F
Gauteng Urban 1
Feeley; Gitau57,58 (1) To assess the relationship between dietary habits, change in socioeconomic status and BMI z- score and fat mass in a cohort of black South African adolescents; (2) to examine the longitudinal changes in eating attitudes, body-esteem and weight control behaviours among adolescents between 13 and 17 years; and, to describe perceptions around body shape at age 17 years
Prospective cohort (BTT) (1): 607 (M); 616 (F) (black participants) (2) 13 years, black (B):
666 (M), 742 (F); mixed-ancestry (MA): 81 (M), 91 (F); 17 years, B: 781 (M), 826 (F); MA: 100 (M), 113 (F)
13, 17 M,
F
Gauteng Urban 1, 2, 3, 4
Voorend;
Sedibe51,52
(1) To explore if and how female adolescents engage in shared eating and joint food choices with best friends within the context of living in urban Soweto; (2) to investigate the narratives
Qualitative 58 (29 pairs) 18 ± 1.1 F Gauteng Urban 5
SouthAfricanJournalofClinicalNutrition2020;33(4):94–132
pertaining to dietary and physical activity practices
Craig59,60 To assess agreement between widely used methods of assessing nutritional status in children and adolescents, and to examine the benefit of body composition estimates
Cross-sectional 11 years: 503; 15 years: 502 11, 15 M,
F
KwaZulu-Natal Rural 1
Feeley61 To determine the consumption of purchased foods and drinks among a cohort of urban adolescents, and to estimate the added sugar and dietary sodium intake from these foods and beverages
Cross-sectional (within BTT) 720 (M); 731 (F) 17 M,
F
Gauteng Urban 2
Gitau63 To examine differences between black and white female adolescents in eating attitudes, body image perceptions, and self-esteem, and the association of these with BMI
Cross-sectional Black (B): 61 (13 years), 59 (15 years), 63 (17 years); white (W): 54 (13 years), 54 (15 years), 49 (17 years)
13, 15, 17 F Gauteng Urban 1, 3, 4
Gitau62 To examine eating attitudes, body image and self-esteem among male adolescents
Cross-sectional Black (B): 60 (13 years), 60 (15 years), 59 (17y); white (W): 68 (13 years), 78 (15 years), 66 (17 years)
13, 15, 17 M Gauteng Urban 1, 3, 4
Mamabolo65 To determine if insulin-like growth factor-1 is a significant predictor of body fat percentage, lean body mass, and insulin resistance in black adolescents presenting with overnutrition and undernutrition
Cross-sectional 70 (M), 111 (F) (black participants) 13–20 M, F
North West Urban 1
Mamabolo64 To determine the association between dyslipidaemia and anthropometric indices in black and white adolescents
Cross-sectional Black (B): 129; White (W): 69 12–16 M,
F
North West Urban 1
Micklesfield;
Pedro66,67
(1) To examine physical activity and sedentary behaviour patterns in South African adolescents;
(2) to determine the prevalence of under- and overnutrition, as well as evidence of metabolic disease risk, in South African children and adolescents
Cross-sectional (AHDSS) (1): 11–12 years: 98 (M), 97 (F); 14– 15 years: 91 (M), 95 (F) (2): 11–12 years: 102 (M), 100 (F); 14–15 years:
92 (M), 97 (F)
11–12; 14–15 M, F
Mpumalanga Rural 1
Sedibe68 To explore perceptions, attitudes, barriers, and facilitators related to healthy eating and physical activity among adolescent girls in rural South Africa
Qualitative 22 (11 pairs) 16–19 F Mpumalanga Rural 5
Visser69 To determine the prevalence of abnormal eating attitudes and weight-loss behaviour in female Jewish adolescents
Cross-sectional 220 (white participants) 15.7 ± 1.2 F Gauteng Urban 4
Mchiza70 To examine body image in relation to body mass index and weight control in South Africa
Cross-sectional (South African National Health and
764 15–18 M,
F
National Mixed 1, 4
(Continued)
AreviewofadolescentnutritioninSouthAfrica101
Table 2:Continued.
First author Main objective(s) Study design Sample size Age (years) Sex Provincea
Context (rural/
urban)
Relevant objective(s) Nutrition Examination
Survey [SANHANES-1];
2012) Meko71 To determine the nutritional status of 13- to 15-
year-old children in Bloemfontein and its association with socioeconomic factors
Cross-sectional 174 (M); 240 (F) 13–15 M,
F
Free State Urban 1, 3
Nkeh-Chungag72 To investigate the prevalence of pre- hypertension and hypertension in peri-urban school-attending adolescents and explore the relationship between blood pressure and selected anthropometric measurements
Cross-sectional 118 (M), 274 (F) 13–17 M,
F
Eastern Cape Peri-urban 1
Pisa73 To identify and describe the diversity of nutrient patterns and how they associate with
sociodemographic and lifestyle factors including body mass index in rural black South African adolescents
Cross-sectional (Agincourt Health and Demographic Surveillance System [AHDSS])
388 11–15 M,
F
Mpumalanga Rural 2, 3
Tee88 To determine the proportion and quality of breakfast intake in adolescents, and to determine the effect of breakfast intake and quality on overall diet quality
Cross-sectional 113 (M), 131 (F) 17.5 ± 2.3 M,
F
North West Urban, peri-urban
2
Toriola74 To evaluate longitudinal development of health- related fitness, anthropometry and body composition status amongst adolescents in Tlokwe Municipality, Potchefstroom, South Africa
Prospective cohort (PAHLS) 111 (M), 172 (F) 14–15 M,F North West Mixed 1
Oldewage- Theron75,76
(1) To assess the nutrition knowledge, nutrient intakes, and association between nutrition knowledge and dietary intakes of 98 adolescents in rural Cofimvaba, South Africa; (2) to investigate the association between diet quality, intakes of anti-inflammatory nutrients and food groups, and subclinical inflammation
Cross-sectional (1) 14–18 years: 98 (2): 9–13 years:
82; 14–18 years: 97
9–18 M,
F
Eastern Cape Rural 1, 2
Pradeilles;
Prioreschi77,78
(1) To investigate the associations of household and neighbourhood socioeconomic position with indicators of both under- and overnutrition in adolescents and to explore sex differences; (2) to examine growth trajectories from birth, and associations with adult body composition
Prospective cohort (BTT) (1): 974 (M), 1045 (F) (2): 514 (M), 500 (F)
17–19 M,
F
Gauteng Urban 1, 3
Kagura79 To investigate the association between SES change between infancy and adolescence, and blood pressure, in young adults, and the impact of early growth on this relationship
Prospective cohort (BTT) 838 (black participants) 18 M,
F
Gauteng Urban 1
Lundeen80 To describe gender differences in overweight and obesity from infancy to late adolescence in a South African cohort
Prospective cohort (BTT) 566 (M), 606 (F) 11–12, 13–15, 16–18
M, F
Gauteng Urban 1
SouthAfricanJournalofClinicalNutrition2020;33(4):94–132
Monyeki81 To determine whether arm span, mid-upper arm and waist circumferences and sum of four skinfolds can be used to predict height
Cross-sectional (within ELS) 310 (M); 298 (F) 15–18 M,
F
Limpopo Rural 1
Pedro82 To examine the associations between BMI, disordered eating attitude, body dissatisfaction in female adolescents, and descriptive attributes assigned to silhouettes of varying sizes in male and female adolescents, aged 11–15 years, in rural South Africa
Cross-sectional (AHDSS) Early puberty (EP): 99 (M), 73 (F);
mid- to post-puberty (MP): 91 (M);
122 (F)
11–15 M,
F
Mpumalanga Rural 3, 4
Tshililo83 To explore factors influencing weight control practices amongst adolescent girls
Qualitative 30 13–19 F Limpopo Not
specified
5 Manyanga84 To examine relationships among dietary patterns
and socioeconomic status of children from countries spanning a wide range of human development
Cross-sectional (International Study of Childhood Obesity, Lifestyle and the Environment [ISCOLE])
167 (M), 256 (F) 9–11 M,
F
Western Cape Urban 1, 2
Moselakgomo85 To estimate overweight and obesity in school children
Cross-sectional Limpopo (L): 168 (10 years), 215 (11 years), 143 (12 years), 56 (13 years);
Mpumalanga (M): 147 (10 years), 128 (11 years), 154 (12 years), 142 (13 years)
10–13 M,
F
Limpopo, Mpumalanga
Rural 1
Pedro86 To assess the association between diet and cardiovascular disease risk factors in rural black South African adolescents
Cross-sectional (AHDSS) 193 (M), 195 (F) 11–15 M,
F
Mpumalanga Rural 1
Sedibe87 To investigate differences/ similarities in dietary habits and eating practices between younger and older, rural and urban South African adolescents
Cross-sectional (within BTT [urban site; U] and AHDSS [rural site; R])
Early adolescent (EA), rural (R): 105 (M), 98 (F); urban (U): 760 (M), 805 (F); mid-adolescent (MA), R: 89 (M), 100 (F); U: 747 (M), 786 (F) (black participants)
EA: 11–12 (R), 13 (U); MA: 14–15
(R), 15 (U)
M, F
Gauteng, Mpumalanga
Urban, rural
1, 2, 3
aProvince refers to a principal administrative district in South Africa.
AreviewofadolescentnutritioninSouthAfrica103
Figure 2:Results from studies describing height (mean/median) of South African adolescents according to age (years).
Abbreviations: UBM, urban black male; UBF, urban black female; UWM, urban white male; UWF, urban white female; RMF, rural male and female; RBM, rural black male; RBF, rural black female; UMAM, urban mixed-ancestry male; UMAF, urban mixed-ancestry female.
Figure 3:Results from studies describing height (mean/median) of South African adolescents according to age (years; range).
Abbreviations: NSBM, non-stunted black male; SBM, stunted black male; NSBF, non-stunted black female; SBF, stunted black female; TS2, Tanner stage 2;
TS3, Tanner stage 3; TS4, Tanner stage 4; TS5, Tanner stage 5; RBM, rural black male; RBF, rural black female; UBM, urban black male; UBF, urban black female; UB, urban black; UW, urban white; PUM, peri-urban male; PUF, peri-urban female; RB, rural black; M, male; F, female; UMAF, urban mixed-ancestry female; UM, urban male; UF, urban female.
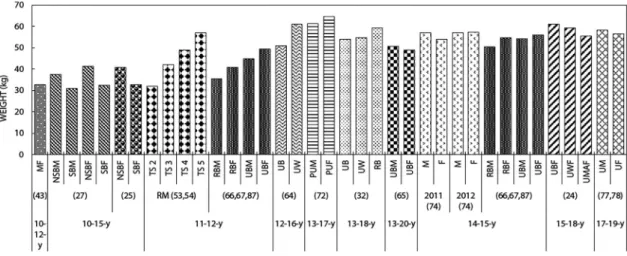
Figure 4:Results from studies describing weight (mean/median) of South African adolescents according to age (years).
Abbreviations: UBM, urban black male; UBF, urban black female; UWM, urban white male; UWF, urban white female; RMF, rural male and female; RBM, rural black male; RBF, rural black female; UMAM, urban mixed-ancestry male; UMAF, urban mixed-ancestry female; M, male; F, female.
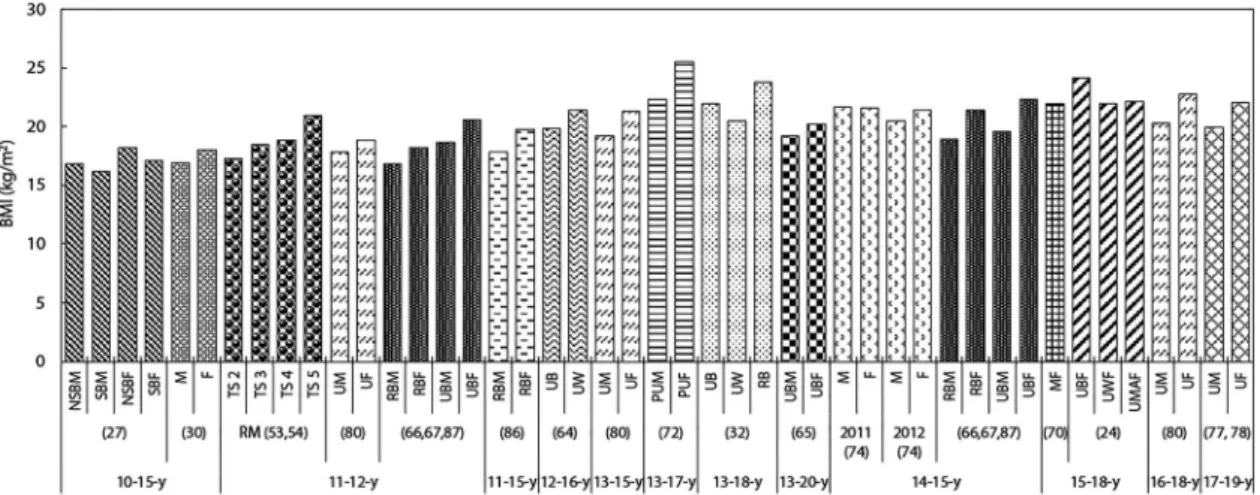
Cross-sectional studies conducted in various rural and/or urban South African settings showed an overall increase in both BMI and prevalence of combined overweight and obesity as adoles- cents aged between 10 and 20 years (Figures 7–10). This increase was predominantly driven by increased adiposity in girls. Longitudinal data from the BTT cohort similarly showed higher overweight/obesity prevalence in girls at all ages, regard- less of ethnicity (black, white and mixed-ancestry partici- pants)57,58,77,78,80
(Figures 9and10).
When comparing black and white adolescents in an urban setting, although the overweight/obesity prevalence was similar in black and white girls at 13 years of age (14.8% [black] vs. 15.7% [white]), there was a substantially higher prevalence of overweight/obesity in black girls at 17 years (16.1% [black] vs. 11.6% [white]).63The opposite was seen in boys (13, 15, 17 years), with higher com- bined overweight/obesity prevalence in white compared with black boys (28.8% [white] vs. 11.2% [black]).62Black girls demon- strated higher overweight/obesity prevalence than their mixed- ancestry counterparts at both 13 and 17 years of age (13 years:
20.2% [black], 13.2% [mixed ancestry]; 17 years: 27.5% [black], 15.9% [mixed ancestry]). While this was similar for boys at 13 Figure 5:Results from studies describing weight (mean/median) of South African adolescents according to age (years; range).
Abbreviations: MF, male and female; NSBM, non-stunted black male; SBM, stunted black male; NSBF, non-stunted black female; SBF, stunted black female; TS2, Tanner stage 2; TS3, Tanner stage 3; TS4, Tanner stage 4; TS5, Tanner stage 5; RBM, rural black male; RBF, rural black female; UBM, urban black male; UBF, urban black female; UB, urban black; UW, urban white; PUM, peri-urban male; PUF, peri-urban female; RB, rural black; M, male; F, female; UMAF, urban mixed-ancestry female; UM, urban male; UF, urban female.
Figure 6: Results from studies describing the stunting prevalence in South African adolescents according to age (years). aWHO child growth standards.89bCDC/NCHS growth charts.90
Figure 7:Results from studies describing body mass index (BMI; mean/median) of South African adolescents according to age (years).
Abbreviations: UBM, urban black male; UBF, urban black female; UWM, urban white male; UWF, urban white female; RMF, rural male and female; RBM, rural black male; RBF, rural black female; UMAM, urban mixed-ancestry male; UMAF, urban mixed-ancestry female; BM, black male; BF, black female; MF, male and female; M, male; F, female.
A review of adolescent nutrition in South Africa 105
Figure 8:Results from studies describing body mass index (BMI; mean/median) of South African adolescents according to age (years; range).
Abbreviations: NSBM, non-stunted black male; SBM, stunted black male; NSBF, non-stunted black female; SBF, stunted black female; M, male; F, female;
TS2, Tanner stage 2; TS3, Tanner stage 3; TS4, Tanner stage 4; TS5, Tanner stage 5; UM, urban male; UF, urban female; RBM, rural black male; RBF, rural black female; UBM, urban black male; UBF, urban black female; UB, urban black; UW, urban white; PUM, peri-urban male; PUF, peri-urban female; RB, rural black; MF, male and female; UWF, urban white female; UMAF, urban mixed-ancestry female.
Figure 9:Results from studies describing the combined overweight and obesity prevalence in South African adolescents according to age (years) Abbreviations: UBM, urban black male; UBF, urban black female; UMAM, urban mixed-ancestry male; UMAF, urban mixed-ancestry female; UWF, urban white female; BM, black male; BF, black female; M, male; F, female; RBM, rural black male; RBF, rural black female.
Figure 10:Results from studies describing the combined overweight and obesity prevalence in South African adolescents according to age (years; range).
Abbreviations: MF, male and female; UM, urban male; UF, urban female; RMF, rural male and female; M, male; F, female; NS, non-stunted; S, stunted; RM, rural male; RF, rural female; PUM, peri-urban male; PUF, peri-urban female; UBF, urban black female; UWF, urban white female; UMAF, urban mixed-ancestry female.
years of age, mixed-ancestry boys showed higher overweight/
obesity prevalence rates than their black counterparts at 17 years (13 years: 9.5% [black], 7.4% [mixed ancestry]; 17 years:
6.3% [black], 11.0% [mixed ancestry]).57,58
In both early (11–13 years) and mid-adolescent (14–15 years) black boys and girls, the combined overweight and obesity prevalence was higher in those from urban ([early adolescent:
27.9% (M), 36.1% (F)]; [mid-adolescent: 12.3% (M), 28.5% (F)]) compared with rural settings ([early adolescent: 9.5% (M), 17.3% (F)]; [mid-adolescent: 5.5% (M), 22.3% (F)]).87
Adiposity (Figure 11andTable 3)
Across age categories the majority of studies showed higher waist circumference in girls compared with boys64,66,67,72,81,86
(Figure 11). White adolescents had higher waist circumference than their black counterparts at 12–16 years (65.5 cm [black], 70.4 cm [white])64 and waist circumference tended to be higher in adolescents from urban vs. rural settings.64,66,67,72,81,86
Body fat percentage (%fat) was similarly lower in boys vs. girls throughout adolescence ([11 years: 12.3% (M), 20.3% (F)]; [14 years: 13.7% (M), 20.5% (F)]; [15 years: 9.0% (M), 24.7%
(F)])47,59,60(Table 3).
When stratified according to non-stunted (NS) vs. stunted (S) adolescents, 10–15-year-old stunted boys and girls had lower
%fat ([M: 14.2% (NS) vs. 12.5% (S)]; [F: 22.8% (NS) vs. 19.3%
(S)]) and waist circumferences ([M: 60.3 cm (NS) vs. 57.5 cm (S)]; [F: 62.4 cm (NS) vs. 57.5 cm (S)]) than their non-stunted counterparts.27
Biochemical markers (data not shown)
The single study describing any biochemical marker of micronu- trient status in adolescent South Africans focused on Vitamin D status as assessed by serum 25-hydroxyvitamin D (25(OH)D).48 25(OH)D was higher in white compared with black adolescents (male: 129 ± 37.1 nmol/l [white], 100 ± 34.3 nmol/l [black];
female: 112 ± 34.8 nmol/l [white], 86 ± 31.1 nmol/l [black]).
Some 22% and 12% of black and white adolescents respectively had insufficient vitamin D levels (50–74 nmol/l), while 8% and 1% of black and white adolescents respectively were vitamin D deficient (< 50 nmol/l).48
Reported dietary nutrient intakes (Table 4)
Of the nine studies reporting dietary nutrient intakes in South African adolescents, seven used 24-hour recall23,25,27,30,31,75,76
and two used a quantitative food frequency questionnaire (QFFQ)35,86to describe intakes. Where 24-hour recalls were uti- lised, only two studies used a repeated recall method (one week and one weekend day),75,76 with the remaining five using recall for a single day. However, three of these articles used data from the THUSA BANA study (Transition and Health during Urbanisation of South Africans; BANA, children) which validated its recall method via a repeated recall and a 3-day weighed record in a sub-sample.25,27,30While MacKeownet al.
stated that QFFQs had been demonstrated as valid and reprodu- cible instruments in other South African populations and that the same QFFQ was consistently used across time interceptions, the specific questionnaire was not validated.35In the case of Pisa et al., a QFFQ developed for the South African population was utilised and included nationally representative food items con- sumed by at least 3% of the population.73It also incorporated validated instruments for portion size estimation.73 For studies that assessed reported micronutrient intakes, those of key micronutrients common across studies are presented in Table 4.
Median energy intakes were similar in rural adolescents at 9–13 and 14–18 years of age (7 172 kJ/d and 7 141 kJ/d respectively);
with a slightly higher total fat intake at 14–18 years (48 g/d [9–13 years]; 50 g/d [14–18 years]).75,76Intakes of most of the micronu- trients assessed (iron, magnesium, zinc and folate) were similar across age groups; however, vitamin C intake was higher in the 9–13 year group (23.8 mg/d [9–13 years]; 18.1 mg/d [14– 18 years]).75,76Rural boys demonstrated higher energy intakes than girls at 11–15 years (9 900 kJ/d and 6 670 kJ/d respectively);
however, girls had higher fat (32 g/d [M] vs. 37.8 g/d [F]), protein (39 g/d [M] vs. 42 g/d [F]) and cholesterol (25.2 g/d [M] vs. 43 g/d [F]) intakes.86
In the North West province, 10–15-year-old boys and girls had mean energy intakes of 8 014 kJ/d and 7 397 kJ/d respectively.30 Mean fat intake was 56 g/d for boys and 53 g/d for girls, thereby contributing to 26.5% and 27.1% of daily energy intake in boys and girls respectively.75 Energy, macro- and micronutrient intakes were similar in stunted compared with non-stunted 10–15-year-old black adolescents.25,27
Figure 11:Results from studies describing central adiposity (waist circumference; mean/median) of South African adolescents according to age (years; range).
Abbreviations: RM, rural male; RF, rural female; NSBM, non-stunted black male; SBM, stunted black male; NSBF, non-stunted black female; SBF, stunted black female; RBM, rural black male; RBF, rural black female; UB, urban black; UW, urban white; PUM, peri-urban male; PUF, peri-urban female; MNF, male normal body fat percentage (%fat); FNF, female normal %fat; MHF, male high %fat; FHF, female high %fat; UBM, urban black male; UBF, urban black female.
A review of adolescent nutrition in South Africa 107