GUIDELINES FOR IMPLEMENTATION
of the Revised Framework for Strategic Plans
and Annual Performance Plans
2
Issued by the Department of Planning, Monitoring and Evaluation for implementation by the national and provincial spheres of government
GUIDELINES FOR THE IMPLEMENTATION OF THE REVISED FRAMEWORK FOR STRATEGIC PLANS AND ANNUAL PERFORMANCE PLANS
3
CHAPTER 1: PLANNING TOOLS 6
1.1 Introduction 7
1.2 Planning tools for situational or diagnostic analysis 7 1.2.1 Scenario Planning 7
1.2.2 SWOT and PESTEL analysis 7
1.2.3 Fishbone analysis 8
1.2.4 Problem and Solution Tree analysis 8
1.3 Planning tools for developing Strategic Plans, Annual Performance Plans and Annual Operational Plans 9
1.3.1 Theory of Change 9
1.3.2 Logframe 9
1.3.3 Balanced Score Card 9
1.3.4 Activity-based costing 10
CHAPTER 2: DEFINITIONS 12
2.1 Introduction 13
2.2 General concepts 13
2.2.1 Institution 13
2.3 Planning documents 13
2.3.1 Sector Plan 13
2.3.2 Strategic Plan 13
2.3.3 Integrated Development Plan 13
2.3.4 Annual Performance Plan 13
2.3.5 Service Delivery and Budget Implementation Plan 13 2.3.6 Annual Operational Plan 13
2.4 Planning concepts 13
2.4.1 Performance information 13
2.4.2 Impact 14
2.4.3 Outcome 14
2.4.4 Output 14
2.4.5 Activity 14
2.4.6 Input 14
2.4.7 Assumption 14
2.4.8 Risk 14
2.5 Indicators 14
2.5.1 Indicator 14
2.5.2 Qualitative indicator 14
2.5.3 Quantitative indicator 14
CONTENTS
4
2.5.4 Proxy indicator 14
2.5.5 Standardised indicator 14
2.5.6 Consolidated indicator 14
2.5.7 Demand-driven indicator 14
2.5.8 Technical indicator description 14
2.6 Targets 15
2.6.1 SMART 15
2.6.2.1 Cumulative (year-end) 2.6.2.2 Cumulative (year-to-date) 2.6.2.3 Non-cumulative
2.6.2.4 Baseline
2.6.2 Cumulative and non-cumulative targets 15
2.7 Reporting documents 15
2.7.1 Assessment (mid-/end-term) 15
2.7.2 Quarterly Performance Report 15
2.7.3 Annual Report 15
2.8 Programmes 15
2.8.1 Budget Programme 15
2.8.2 Budget Sub-programme 15
2.8.3 Implementation Programme 15
2.8.4 Project 16
2.9 Budget concepts and documents 16
2.9.1 Medium Term Expenditure Framework (MTEF) 16 2.9.2 Estimates of National Expenditure (ENE) 16 2.9.3 Estimates of Provincial Revenue and Expenditure (EPRE) 16 2.9.4 Classification of public entities
FORMATS FOR STRATEGIC AND ANNUAL PERFORMANCE PLANS 18
Strategic Plan format 19
Annual Performance Plan format 26
Annual Operational Plan Format 34
EXAMPLES OF PLANS 37
EXAMPLE 1: TRANSPORT SECTOR 38
Department of Transport: Strategic Plan 38
Department of Transport: Annual Performance Plan 39
Department of Transport: Annual Operational Plan 42
Provincial Department of Transport: Strategic Plan 43
Provincial Department of Transport: Annual Performance Plan 45 Provincial Department of Transport: Annual Operational Plan 47
National Public Entity: Strategic Plan 48
National Public Entity: Annual Performance Plan 49 National Public Entity: Annual Operational Plan 50
GUIDELINES FOR THE IMPLEMENTATION OF THE REVISED FRAMEWORK FOR STRATEGIC PLANS AND ANNUAL PERFORMANCE PLANS
5
EXAMPLE 2: HIGHER EDUCATION AND TRAINING 51
Department of Higher Education and Training: Strategic Plan 51 Department of Higher Education and Training: Annual Performance Plan 53 Department of Higher Education and Training: Annual Operational Plan 56
List of tables
Table 1.1: SWOT analysis 7
Table 1.2: PESTEL analysis 8
Table 1.3: Balanced Scorecard perspectives 10
Abbreviations
AOP Annual Operational Plan APP Annual Performance Plan
ENE Estimates of National Expenditure
EPRE Estimates of Provincial Revenue and Expenditure IDP Integrated Development Plan
MEC Member of the Executive Council MTEF Medium Term Expenditure Framework
MTREF Medium Term Revenue and Expenditure Framework MTSF Medium Term Strategic Framework
NaTIS National Administration Traffic Information System OP Operational Plan
PESTEL Political, economic, social, technological, environmental and legal PFMA Public Finance Management Act
PPP Public-Private Partnership
SDBIP Service Delivery and Budget Implementation Plan SMART Specific, measurable, achievable, relevant, time-bound SP Strategic Plan
SWOT Strengths, weaknesses, opportunities and threats TID Technical indicator description
6
CHAPTER 1: PLANNING TOOLS
GUIDELINES FOR THE IMPLEMENTATION OF THE REVISED FRAMEWORK FOR STRATEGIC PLANS AND ANNUAL PERFORMANCE PLANS
7 1.1 Introduction
This section gives information about tools that institutions can use at the various stages of the planning process. They should select tools relevant to themselves that will enable their results-based planning. The Theory of Change is one such tool, providing a thorough strategic logic for achieving an identified change or impact.
Different planning tools can be used at the different stages of planning to provide a comprehensive view of the results chain and of other factors such as assumptions and risks.
Tools currently used in government planning include Scenario Planning, SWOT analysis, PESTEL analysis, Fishbone analysis, Problem/
Solution Tree analysis, Theory of Change, Logframe, Balanced Score Card, activity-based costing and programme-based budgeting.
1.2 Planning tools for situational or diagnostic analysis
1.2.1 Scenario Planning
Scenario planning is one of the tools government institutions use as part of their planning processes. It can be used for medium- to long-term planning or in preparation for a
new planning cycle and is often appropriate for developing a situational or diagnostic analysis.
Scenarios assist with taking a long view, where many factors may be uncertain. They provide for articulation of pathways that may exist in the future and for potential movements within each pathway. This can enable adaptation to changing aspects of the environment. Scenario planning involves making choices currently, with an understanding of how they might turn out in the future.
1.2.2 SWOT and PESTEL analysis
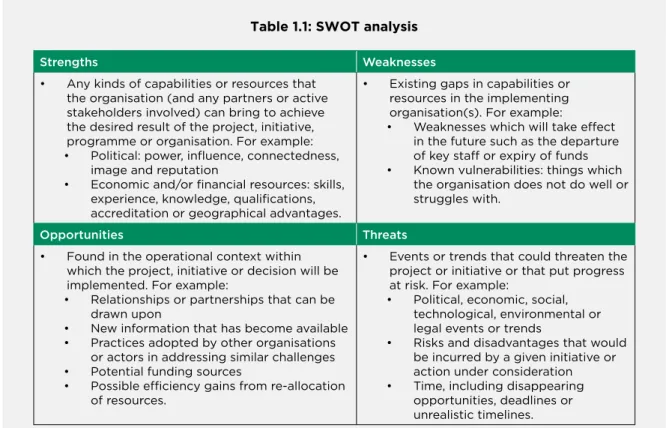
SWOT (strengths, weaknesses, opportunities and threats) and PESTEL (political, economic, social, technological, environmental and legal) analyses are widely used and well known planning tools and are used to identify key external and internal factors that must be taken into consideration during a situational analysis process. They highlight key issues relating to the context of a project, initiative, programme or organisation which, if not identified and addressed, could critically affect the chances of success. SWOT analysis information can be summarised as shown in the following table.
Table 1.1: SWOT analysis
Strengths Weaknesses
• Any kinds of capabilities or resources that the organisation (and any partners or active stakeholders involved) can bring to achieve the desired result of the project, initiative, programme or organisation. For example:
• Political: power, influence, connectedness, image and reputation
• Economic and/or financial resources: skills, experience, knowledge, qualifications, accreditation or geographical advantages.
• Existing gaps in capabilities or resources in the implementing organisation(s). For example:
• Weaknesses which will take effect in the future such as the departure of key staff or expiry of funds
• Known vulnerabilities: things which the organisation does not do well or struggles with.
Opportunities Threats
• Found in the operational context within which the project, initiative or decision will be implemented. For example:
• Relationships or partnerships that can be drawn upon
• New information that has become available
• Practices adopted by other organisations or actors in addressing similar challenges
• Potential funding sources
• Possible efficiency gains from re-allocation of resources.
• Events or trends that could threaten the project or initiative or that put progress at risk. For example:
• Political, economic, social, technological, environmental or legal events or trends
• Risks and disadvantages that would be incurred by a given initiative or action under consideration
• Time, including disappearing opportunities, deadlines or unrealistic timelines.
8
1.2.3 Fishbone analysis
The Fishbone tool is a cause-and-effect analysis method used to identify the likely cause of a problem. It seeks to identify factors which do not contribute to the core problem; eliminate problems beyond the institution’s control;
decide on the most important problems to solve; decide on information gaps which require research; and design a solution. A Fishbone diagram identifies many possible causes for an effect or problem and can be used to structure a brainstorming session.
1.2.4 Problem and Solution Tree analysis The Problem Tree tool, sometimes referred to as Problem Analysis, assists the search for solutions by mapping out the structure of the problem. It looks upstream at causes and determinants and downstream at consequences and effects. Once completed, the Problem Tree can be translated into a Solution Tree.
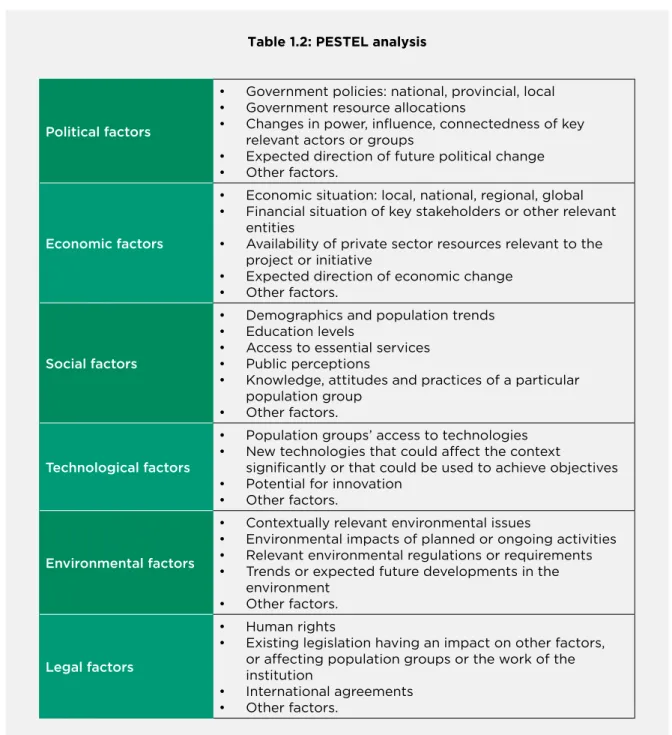
Table 1.2: PESTEL analysis
PESTEL analysis information can be summarised as shown in the following table.
Political factors
• Government policies: national, provincial, local
• Government resource allocations
• Changes in power, influence, connectedness of key relevant actors or groups
• Expected direction of future political change
• Other factors.
Economic factors
• Economic situation: local, national, regional, global
• Financial situation of key stakeholders or other relevant entities
• Availability of private sector resources relevant to the project or initiative
• Expected direction of economic change
• Other factors.
Social factors
• Demographics and population trends
• Education levels
• Access to essential services
• Public perceptions
• Knowledge, attitudes and practices of a particular population group
• Other factors.
Technological factors
• Population groups’ access to technologies
• New technologies that could affect the context
significantly or that could be used to achieve objectives
• Potential for innovation
• Other factors.
Environmental factors
• Contextually relevant environmental issues
• Environmental impacts of planned or ongoing activities
• Relevant environmental regulations or requirements
• Trends or expected future developments in the environment
• Other factors.
Legal factors
• Human rights
• Existing legislation having an impact on other factors, or affecting population groups or the work of the institution
• International agreements
• Other factors.
GUIDELINES FOR THE IMPLEMENTATION OF THE REVISED FRAMEWORK FOR STRATEGIC PLANS AND ANNUAL PERFORMANCE PLANS
9 A Problem Tree identifies the focal problem,
related consequences and root causes. The identified consequences can be divided into cause and effect categories. Problem Tree steps include:
a) Settle on the core problem: identify the core problem or challenge that needs to be overcome.
b) Identify the causes: once the core problem has been identified, the next step is to consider what its direct causes are. These become the roots of the tree.
c) Identify the effects: the next step is to identify the consequences/effects related to the causes. These become the branches of the tree.
d) Link causes and effects: review the sequence of causes and effects to make sure that they are clear and make logical sense.
The Solution Tree tool is used to generate solutions to problems identified in the Problem Tree analysis and can be developed by taking the following steps:
a) Revise negative statements: revise negative statements from the Problem Tree into positive ones where the ‘challenge’ has been resolved.
This is done for the core problem, causes and effects.
b) Rewrite into possible solutions: write positive causes as possible solutions to achieve the identified outcomes. The positive causes can provide separate or linked suggestions to solutions.
c) Identify positive solutions: solutions are brainstormed and available information reviewed to determine the most probable solutions. This is a necessary step because selected solutions may not all be feasible due to financial or other resource constraints.
1.3 Planning tools for developing Strategic Plans, Annual Performance Plans and Annual Operational Plans
1.3.1 Theory of Change
Theory of Change describes the process to reach commonly understood results. The
process requires stakeholders to be precise about the type of changes they want to achieve, and it should be clear why change is expected to happen in a particular way. Once the results chain has been developed, the impact and outcomes should be reflected in the Strategic Plan (SP), the outputs reflected in the Annual Performance Plan (APP) and the activities reflected in the Annual Operational Plan (AOP).
Theory of Change is one of the tools that can be used to determine a pathway for achieving desired results. Elements of the theory include the pathway of change; results and preconditions (impact, outcomes, outputs, activities and inputs); indicators; and assumptions.
1.3.2 Logframe
A Logframe, or Logical Framework, is a tool for improving the planning, implementation, management, monitoring and evaluation of a programme.
A Logframe provides a structure for describing the impact, outcomes, outputs, activities and inputs as a results chain and shows the logical linkages between them. Indicators, baselines and targets at each level of the results chain are developed to measure progress towards achieving the desired results. Assumptions and risks form the basis of the Logframe. Indicators and targets developed through the Logframe are reflected in SPs, APPs and AOPs.
1.3.3 Balanced Score Card
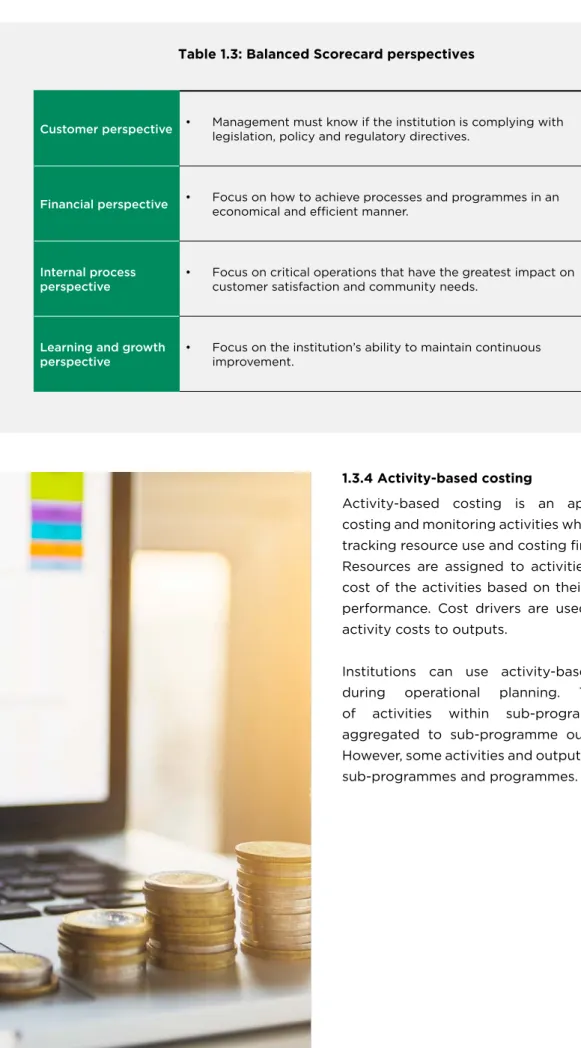
The Balanced Score Card is a strategic planning and management tool that is used to align an institution’s functions with its vision and strategy; improve internal and external communications; and monitor performance against predetermined results.
The Balanced Score Card approach suggests that the organisation can be viewed from four perspectives and can develop metrics, collect data and analyse itself relative to each of these.
As the table below shows, the perspectives are customer, financial, internal process, and learning and growth.
1 0
1.3.4 Activity-based costing
Activity-based costing is an approach to costing and monitoring activities which involves tracking resource use and costing final outputs.
Resources are assigned to activities, with the cost of the activities based on their estimated performance. Cost drivers are used to attach activity costs to outputs.
Institutions can use activity-based costing during operational planning. The costs of activities within sub-programmes are aggregated to sub-programme output costs.
However, some activities and outputs cut across sub-programmes and programmes.
Table 1.3: Balanced Scorecard perspectives
Customer perspective • Management must know if the institution is complying with legislation, policy and regulatory directives.
Financial perspective • Focus on how to achieve processes and programmes in an economical and efficient manner.
Internal process
perspective • Focus on critical operations that have the greatest impact on customer satisfaction and community needs.
Learning and growth
perspective • Focus on the institution’s ability to maintain continuous improvement.
GUIDELINES FOR THE IMPLEMENTATION OF THE REVISED FRAMEWORK FOR STRATEGIC PLANS AND ANNUAL PERFORMANCE PLANS
1 1
1 2
CHAPTER 2: DEFINITIONS
GUIDELINES FOR THE IMPLEMENTATION OF THE REVISED FRAMEWORK FOR STRATEGIC PLANS AND ANNUAL PERFORMANCE PLANS
1 3 2.1 Introduction
The purpose of providing definitions of concepts is to ensure standardisation, consistency and common understanding among all stakeholders. The definitions should minimise different interpretations by users of the Revised Framework, reduce confusion and ensure transparency and usability of the Revised Framework by all stakeholders.
Concepts related to planning, using the Revised Framework document and the Guidelines, are defined below.
2.2 General concepts 2.2.1 Institution
Institution means a department, a constitutional institution, a public entity listed in Schedules 3A and 3C of the Public Finance Management Act (PFMA) or a government component.
2.3 Planning documents 2.3.1 Sector Plan
These are plans for which sectors, in consultation with relevant stakeholders, agree on the impacts, outcomes and outputs that sectors must achieve.
2.3.2 Strategic Plan
A Strategic Plan (SP) describes institutional programmes and projects which contribute to the achievement of the overall priorities of government and the realisation of the mandate of the institution. It identifies impacts and outcomes against which the institution can be measured and evaluated by Parliament, provincial legislatures and the public. SPs span a five-year planning horizon subsequent to an election year.
2.3.3 Integrated Development Plan
An Integrated Development Plan (IDP) is a five-year plan which local government is required to compile to determine development needs and to fulfil the developmental mandate of the municipality. It is reviewed annually in response to changing socio-economic, infrastructural and environmental factors and the needs of the communities. The IDP guides and informs all
planning and development initiatives within a municipality and forms the basis of the Medium Term Revenue and Expenditure Framework (MTREF).
2.3.4 Annual Performance Plan
An Annual Performance Plan (APP) identifies the outputs, output indicators and targets that an institution aims to achieve in the upcoming financial year and is aligned with the outcomes given in the SP. Consistent with the Medium Term Expenditure Framework (MTEF) period, it includes forward projections (annual targets) for a further two years, with annual and quarterly performance targets for the financial year.
2.3.5 Service Delivery and Budget Implementation Plan
The Service Delivery and Budget Implementation Plan (SDBIP) is a detailed plan, approved by the Mayor of a municipality, for implementing the municipality’s planned service delivery and its annual budget. It indicates projections for each month in terms of revenue to be collected by source; operational and capital expenditure by vote; the service delivery targets and performance indicators for each quarter; and any other prescribed matters.
2.3.6 Annual Operational Plan
An Annual Operational Plan (AOP) describes the activities and budgets for each of the outputs and output indicators in the APP. AOPs also include operational outputs which are not reflected in the APP. AOPs can be developed for an institution and/or for branches or programmes within an institution.
2.4 Planning concepts
2.4.1 Performance information
Performance information includes planning, budgeting, implementation, monitoring, reporting and evaluation elements which are all key to effective management. Performance information indicates how well an institution performs in terms of its intended results.
This information is vital for transparency, accountability and oversight.
1 4
2.4.2 Impact
An impact is a change in conditions and is the result of achieving specific outcomes such as reducing poverty or creating jobs. Impacts answer the question “What change are we aiming to bring about?”.
2.4.3 Outcome
Outcomes are the medium-term results for specific beneficiaries which are the consequence of achieving specific outputs. Outcomes are
“What we wish to achieve”.
2.4.4 Output
Outputs are the products, goods or services produced for delivery. They may be defined as
“What we produce or deliver”. They are also the building blocks towards the desired outcomes.
2.4.5 Activity
An activity is a process or action that uses a range of inputs to produce the desired outputs and ultimately outcomes. They are “What we do”.
2.4.6 Input
An input is a resource that contributes to the production and delivery of outputs. Inputs are
“What we use to do our work”. They include finance, personnel, equipment and buildings.
2.4.7 Assumption
An assumption is a factor that is accepted as true and certain to happen without proof.
2.4.8 Risk
A risk is a potential unwanted outcome that will affect the achievement of an institution’s planned results and service delivery.
2.5 Indicators 2.5.1 Indicator
An indicator is a predetermined signal that a specific point in a process has been reached or result achieved. It should include a unit of measurement that specifies what is to be measured along a scale or dimension but does not indicate the direction of change. Indicators can be qualitative or quantitative measures.
2.5.2 Qualitative indicator
A qualitative indicator is a descriptive criterion or category of measurement. It reveals whether a certain situation is present or not: for instance, a new policy implemented or the level of citizens’ satisfaction with a service.
2.5.3 Quantitative indicator
A quantitative indicator is expressed in terms of amounts, numbers, ratios or percentages.
Measurement of these gives a numerical value that can be easily compared to targets to assess performance.
2.5.4 Proxy indicator
The purpose of a proxy indicator is to give information about achieved performance in a specific area. Proxy indicators are used when results cannot be measured directly.
2.5.5 Standardised indicator
Standardised indicators refer to a core set of indicators that have been developed and agreed to by all provincial institutions within a sector with their national institutions.
Standardised indicators are relevant to achieving sector-specific priorities and are approved by provincial Accounting Officers. They are incorporated into provincial institutions’ APPs and form the basis of the quarterly and annual performance reporting process.
2.5.6 Consolidated indicator
A consolidated indicator consists of data that is consolidated by national or provincial institutions from implementing institutions to give an overall view of a sector’s performance.
2.5.7 Demand-driven indicator
A demand-driven indicator is a measure of the efficiency of a service provided by an institution in relation to the demand from service beneficiaries.
2.5.8 Technical indicator description
A technical indicator description (TID) is a description of impact, outcome and output indicators which defines the data collection processes, gathering of portfolios of evidence
GUIDELINES FOR THE IMPLEMENTATION OF THE REVISED FRAMEWORK FOR STRATEGIC PLANS AND ANNUAL PERFORMANCE PLANS
1 5 and acceptable level of performance at the
beginning of the planning cycle.
2.6 Targets
A target is a score that an institution wishes to achieve. It must be SMART (see below).
2.6.1 SMART
SMART is an acronym used to define a set of criteria for selecting performance targets:
Specific; Measurable; Achievable; Relevant;
Time-bound.
2.6.2 Cumulative and non-cumulative targets 2.6.2.1 Cumulative (year-end)
The annual target is an aggregation of all the quarterly targets. Each quarter’s target is reflected in a particular quarter.
2.6.2.2 Cumulative (year-to-date)
The annual target must be disaggregated into quarterly targets, with previous quarters’ targets added to those of following quarters to total the annual target. Reporting must show aggregated performance from the start of the financial year to the quarter being reported.
2.6.2.3 Non-cumulative
The annual target is not disaggregated into quarterly targets. As is the case with quarterly targets, it can be given for each quarter, as a target for a particular quarter or as a stand-alone annual target.
2.6.2.4 Baseline
The baseline is the current level of performance that an institution aims to improve.
2.7 Reporting documents
2.7.1 Assessment (mid-/end-term)
Reviews are periodic or ad hoc assessments of performance carried out in relation to the SP and are typically conducted internally.
2.7.2 Quarterly Performance Report
Quarterly performance reports provide information about progress on implementing an institutions’ APP, with a particular focus
on monitoring delivery in terms of quarterly performance targets. They enable the Accounting Officer to indicate measures that will be taken to ensure that implementation of the APP remains on track.
2.7.3 Annual Report
An Annual Report is the end-of-year non-financial and financial performance report.
It includes the opinion of the Auditor-General of South Africa on the institution’s performance.
2.8 Programmes
2.8.1 Budget Programme
A budget programme is a main division within a department’s budget that funds a clearly defined set of objectives based on the services or functions within the department’s constitutional and legislative mandates. It is also a management unit established within a department responsible for delivery of a defined set of services and functions. The term
“programme” is confined to the functional divisions created within the context of the budget and designated as a “programme” in the budget estimates: that is, a main division in terms of Section 27(3) (b) of the PFMA.
2.8.2 Budget Sub-programme
A budget sub-programme is a constituent part of a budget programme and defines the services or activities which contribute to achievement of the objectives of the budget programme of which it forms part. The defined services or activities may include an institution’s key projects.
2.8.3 Implementation Programme
An implementation programme is an intervention directed at achieving specific policy aims. It may include a number of projects and/or cut across institutions or spheres of government. An implementation programme has a plan, clear delivery milestones and an indicative budget. It addresses coherent areas of work which are usually at a lower level than budget programmes or sub-programmes.
1 6
2.8.4 Project
A project is a single intervention directed to attaining institutional priorities, with a fixed time schedule and a dedicated budget. It can consist of a number of costed activities.
2.9 Budget concepts and documents
2.9.1 Medium Term Expenditure Framework (MTEF)
The MTEF is a budgeting framework that translates the policies and plans of national, provincial and local government into a three-year rolling spending plan. The purpose is to promote transparency, accountability and effective public financial management. It is published by National Treasury at the time of the national budget.
2.9.2 Estimates of National Expenditure (ENE) The ENE is a publication that provides comprehensive information about how national departments and entities have spent their past budgets and how they plan to spend their future ones, and about revenue collected by institutions. The ENE provides information about the past three financial years, the current financial year and the coming three financial years (the MTEF period).
2.9.3 Estimates of Provincial Revenue and Expenditure (EPRE)
The EPRE is a publication that provides comprehensive information about how provincial departments and entities have spent their past budgets and how they plan to spend their future ones, and about revenue collected by institutions. The EPRE provides information about the past three financial years, the current financial year and the coming three financial years (the MTEF period).
2.9.4 Classification of public entities
Schedule 1: Constitutional institution: an organisation established in terms of Chapter 9 of the Constitution of South Africa.
Schedule 3A: National Public Entity: an organisation established in terms of national legislation and fully or substantially funded from the National Revenue Fund or by way of a tax or
levy imposed in terms of national legislation. It is accountable to its oversight department and to Parliament.
Schedule 3C: Provincial Public Entity: an organisation established in terms of provincial legislation and fully or substantially funded from the Provincial Revenue Fund or by way of a tax or levy imposed in terms of provincial legislation. It is accountable to its oversight department and to its legislature.
Government Component: a national government institution listed in Part A of Schedule 3 to the Public Service Act, 1994.
GUIDELINES FOR THE IMPLEMENTATION OF THE REVISED FRAMEWORK FOR STRATEGIC PLANS AND ANNUAL PERFORMANCE PLANS
1 7
1 8
FORMATS FOR STRATEGIC AND
ANNUAL PERFORMANCE PLANS
GUIDELINES FOR THE IMPLEMENTATION OF THE REVISED FRAMEWORK FOR STRATEGIC PLANS AND ANNUAL PERFORMANCE PLANS
1 9
Name of Institution
Strategic Plan for 20XX – 20YY
Institution’s logo
Strategic Plan format
2 0
Executive Authority Statement
In this statement, the Executive Authority clearly sets out the policy priorities that have guided the development of the Strategic Plan for a particular planning period. The Executive Authority is responsible for ensuring that the policy priorities set out in the plan are aligned with the institution’s mandate and with government’s priorities.
The Executive Authority must also use this statement to endorse the Strategic Plan and to indicate its commitment to ensuring its implementation.
XXXX (signature)
Name and surname of the Executive Authority
Name of the institution
GUIDELINES FOR THE IMPLEMENTATION OF THE REVISED FRAMEWORK FOR STRATEGIC PLANS AND ANNUAL PERFORMANCE PLANS
2 1 Accounting Officer Statement
In this statement, the Accounting Officer gives an overview of the institution and its vision. The statement must provide information about the institution’s overall focus during the previous planning period and its key accomplishments during this period.
The statement must provide information about the institution’s strategic focus for the forthcoming planning period.
The Accounting Officer must also use this statement to make relevant acknowledgements and to indicate the institution’s commitment to implementing the Strategic Plan.
XXXX (signature)
Name and surname of the Accounting Officer
Name of the institution
2 2
Official Sign-off
It is hereby certified that this Strategic Plan:
• Was developed by the management of the [name of the institution] under the guidance of [name of the Executive Authority]
• Takes into account all relevant policies, legislation and other mandates for which the [name of the institution] is responsible.
• Accurately reflects the impact and outcomes which the [name of the institution] will endeavour to achieve over the period [years covered by the plan].
Signature:
Name and surname of each programme manager
Signature:
Name and surname: Chief Financial Officer
Signature:
Name and surname: Head official responsible for Planning
Signature:
Name and surname: Accounting Officer
Approved by:
Signature:
Name and surname: Executive Authority
GUIDELINES FOR THE IMPLEMENTATION OF THE REVISED FRAMEWORK FOR STRATEGIC PLANS AND ANNUAL PERFORMANCE PLANS
2 3 Part A: Our mandate
1. Constitutional mandate
2. Legislative and policy mandates
3. Institutional policies and strategies governing the five-year planning period 4. Relevant court rulings
Part B: Our strategic focus 1. Vision
2. Mission 3. Values
4. Situational analysis
5. External environment analysis 6. Internal environment analysis
Part C: Measuring our performance
1. Institutional performance information 2. Impact statements
3.1 Explanation of planned performance over the five-year planning period The following key issues must be covered in the narrative:
a) The outcomes’ contribution to achieving the aims of the Medium Term Strategic Framework (MTSF); the mandate of the institution including, where applicable, priorities in relation to women, youth and people with disabilities; and provincial priorities, where applicable.
b) A description of the enablers intended to assist with achieving the five-year targets.
c) An explanation of the outcomes’ contribution to achieving the intended impact.
3. Measuring our outcomes Impact statement
MTSF priority
Outcomes Outcome indicators Baseline Five-year target
2 4
4. Key risks and mitigations
5. Public entities
Part D: Technical indicator descriptions (TIDs)
Outcomes Key risks Risk mitigations
Name of public entity Mandate Outcomes
Indicator title • Title of the indicator verbatim as given in the Strategic Plan
Definition • Meaning of the indicator
• Explanation of technical terms used in the indicator Source of data • Where the information is collected from
Method of calculation or
assessment • How performance is calculated (quantitative)
• How performance is assessed (qualitative)
Assumptions • Factors accepted as true and certain to happen without proof Disaggregation of
beneficiaries (where applicable)
• Target for women
• Target for youth
• Target for people with disabilities Spatial transformation
(where applicable) • Contribution to spatial transformation priorities
• Description of spatial impact
Desired performance • Information about whether performance that is higher or lower than targeted performance is desirable
Indicator responsibility • Who is responsible for managing or reporting on the indicator
GUIDELINES FOR THE IMPLEMENTATION OF THE REVISED FRAMEWORK FOR STRATEGIC PLANS AND ANNUAL PERFORMANCE PLANS
2 5 Annexures to the Strategic Plan
Annexure A: District Development Model
Areas of intervention
(examples) Five-year planning period
Project
description Budget
allocation District
Municipality Location:
GPS coordinates
Project
leader Social partners
Water Sanitation Roads Stormwater
Electricity Environmental management
2 6
Name of Institution
Annual Performance Plan for 20XX/20YY
Institution’s Logo
Annual Performance Plan format
GUIDELINES FOR THE IMPLEMENTATION OF THE REVISED FRAMEWORK FOR STRATEGIC PLANS AND ANNUAL PERFORMANCE PLANS
2 7 Executive Authority Statement
In this statement, the Executive Authority sets out clearly the policy priorities that have guided the development of the Annual Performance Plan for the financial year. The Executive Authority is responsible for ensuring that the policy priorities set out in the plan are aligned with the Strategic Plan, the institution’s mandate and government’s priorities. The Executive Authority is also responsible for providing direction on the development and implementation of strategic priorities and policies.
The Executive Authority must use this statement to endorse the Annual Performance Plan and to indicate its commitment to ensuring its implementation.
XXXX (signature)
Name and surname of the Executive Authority
Name of the institution
2 8
Accounting Officer Statement
In this statement, the Accounting Officer gives an overview of the institution and its vision. The statement must provide information about the overall focus during the previous financial year and the key accomplishments during this period.
The statement must provide information about the institution’s strategic focus for the next financial year and for the forthcoming medium-term period.
The Accounting Officer must also use this statement to make relevant acknowledgements and to indicate the institution’s commitment to implementing the Annual Performance Plan.
XXXX (signature)
Name and surname of the Accounting Officer
Name of the institution
GUIDELINES FOR THE IMPLEMENTATION OF THE REVISED FRAMEWORK FOR STRATEGIC PLANS AND ANNUAL PERFORMANCE PLANS
2 9 Official Sign-Off
It is hereby certified that this Annual Performance Plan:
• Was developed by the management of the [name of the institution] under the guidance of [name of the Executive Authority]
• Takes into account all relevant policies, legislation and other mandates for which the [name of the institution] is responsible
• Accurately reflects the outcomes and outputs which the [name of the institution] will endeavour to achieve over the period [years covered by the plan].
Signature:
Name and surname of each programme manager
Signature:
Name and surname: Chief Financial Officer
Signature:
Name and surname: Head official responsible for Planning
Signature:
Name and surname: Accounting Officer
Approved by:
Signature:
Name and surname: Executive Authority
3 0
Part A: Our mandate
1. Updates to the relevant legislative and policy mandates 2. Updates to institutional policies and strategies
3. Updates to relevant court rulings
Part B: Our strategic focus
1. Updated situational analysis 2. External environment analysis 3. Internal environment analysis
Part C: Measuring our performance
1. Institutional programme performance information 1.1 Programme:
1.1.1 Purpose:
1.2 Sub-programme (if applicable):
1.2.1 Purpose:
2. Outcomes, outputs, performance indicators and targets
4. Explanation of planned performance over the medium-term period The following key issues must be covered in each programme’s narrative:
a) The contribution of its outputs to achieving the intended outcomes and impact in the Strategic Plan and the institution’s mandate including, where applicable, priorities in relation to women, youth and people with disabilities.
b) A description of planned performance in relation to the programme’s outputs.
3. Output indicators: annual and quarterly targets Outcome Outputs Output
indicators Annual targets Audited
performance Estimated
performance MTEF period 20XX/XX 20XX/XX 20XX/
XX 20XX/
XX 20XX/
XX 20XX/
XX 20XX/
XX
Output indicators Annual targets Q1 Q2 Q3 Q4
GUIDELINES FOR THE IMPLEMENTATION OF THE REVISED FRAMEWORK FOR STRATEGIC PLANS AND ANNUAL PERFORMANCE PLANS
3 1 5. Programme resource considerations
Include a budget allocation table for programmes and sub-programmes as per the ENE and/or the EPRE.
Narrative: explanation of the resources’ contribution to achieving the outputs.
6. Updated key risks and mitigation from the SP
7. Public entities
8. Infrastructure projects
9. Public-Private Partnerships (PPPs)
Outcomes Key risks Risk mitigations
Name of public entity Mandate Outcomes
No. Project
name Programme Description Outputs Start date Completion date Total
estimated cost
Current year expenditure
PPP name Purpose Outputs Current value of
agreement End-date of agreement
3 2
Part D: Technical indicator descriptions (TIDs)
Indicator title • Title of the indicator verbatim as given in the Programme Plan
Definition • Meaning of the indicator
• Explanation of technical terms used in the indicator Source of data • Where the information is collected from
Method of calculation
or assessment • How the performance is calculated (quantitative)
• How the performance is assessed (qualitative)
Means of verification • The portfolio of evidence required to verify the validity of the data
Assumptions • Factors accepted as true and certain to happen without proof
Disaggregation of beneficiaries (where applicable)
• Target for women
• Target for youth
• Target for people with disabilities Spatial transformation
(where applicable) • Contribution to spatial transformation priorities
• Description of spatial impact
Calculation type • Cumulative (year-end), cumulative (year-to-date) or non-cumulative
Reporting cycle • Quarterly, bi-annual or annual
Desired performance • Information about whether actual performance that is higher or lower than targeted performance is desirable
Indicator responsibility • Who is responsible for managing or reporting on the indicator
GUIDELINES FOR THE IMPLEMENTATION OF THE REVISED FRAMEWORK FOR STRATEGIC PLANS AND ANNUAL PERFORMANCE PLANS
3 3 Annexures to the Annual Performance Plan
Where applicable, the following annexures must be included in institutions’ APPs.
Annexure A: Amendments to the Strategic Plan
Provide details of revisions to the approved SP with reasons for the revisions and the financial year in which they were made. These must be consistent with the format of the SP and indicate the part of the SP where the amendments were made.
Annexure B: Conditional grants
Annexure C: Consolidated indicators
Annexure D: District Development Model
Name of grant Purpose Outputs Current annual budget (R thousands)
Period of grant
Institution Output indicator Annual target Data source
Areas of intervention
(examples) Medium Term (3 years - MTEF)
Project
description Budget
allocation District
Municipality Location: GPS
coordinates Project
leader Social partners Water
Sanitation
Roads Stormwater Electricity Environmental management
3 4
Name of Institution
Annual Operational Plan for 20XX/20YY
Institution’s Logo
Annual Operational Plan Format
GUIDELINES FOR THE IMPLEMENTATION OF THE REVISED FRAMEWORK FOR STRATEGIC PLANS AND ANNUAL PERFORMANCE PLANS
3 5 Official Sign-Off
It is hereby certified that this Annual Operational Plan:
• Was developed by the management of the [name of the institution] under the guidance of [name of the Accounting Officer]
• Takes into account all relevant policies, legislation and other mandates for which the [name of the institution] is responsible
• Accurately reflects performance information which the [name of the institution] will endeavour to achieve as committed to in the Annual Performance Plan for [financial year].
Signature:
Name and surname of each programme manager
Signature:
Name and surname: Chief Financial Officer
Signature:
Name and surname: Head official responsible for Planning
Approved by:
Signature:
Name and surname: Accounting Officer
3 6
1. Our Operations 1.1 Programme:
1.1.1 Purpose:
1.2 Sub-programme (if applicable):
1.2.1 Purpose:
2. Activities, timeframes and budgets
Output Output
indicator Annual
target Quarterly
target Activities Timeframe Budget per
activity Dependencies Responsibility
GUIDELINES FOR THE IMPLEMENTATION OF THE REVISED FRAMEWORK FOR STRATEGIC PLANS AND ANNUAL PERFORMANCE PLANS
3 7
EXAMPLES OF PLANS
The examples below reflect the application of selected concepts in the Revised Framework for
Strategic Plans and Annual Performance Plans
3 8
EXAMPLE 1: TRANSPORT SECTOR Department of Transport: Strategic Plan Part C: Measuring Our Performance
1. Institutional performance information 2. Impact statement
3. Measuring our outcomes
5. Public entities
Part D: Technical indicator descriptions (TIDs)
3.1 Explanation of planned performance over the five-year planning period 4. Key risks and mitigations
Impact statement A safe, secure, accessible, affordable and reliable transport system
MTSF priority Priority 5: Social Cohesion and Safe Communities
Outcome Outcome indicator Baseline Five-year target Road crashes reduced Number of road
crashes 945 000 500 000
Outcome Key risks Risk mitigations
Road crashes reduced Fraud and corruption in road
traffic law enforcement • Implement the Sector Anti-Fraud and Corruption Strategy in partnership with relevant law enforcement agencies
Name of public entity Mandate Outcomes Current annual budget Road Traffic
Management Corporation (RTMC)
Road Traffic Management
Corporation Act, 1999 (Act No. 20 of 1999)
Road crashes reduced R 5 000 000
Indicator title • Number of road crashes
Definition • A road crash refers to any crash involving at least one road vehicle occurring on a road open to public circulation and in which at least one person is injured or killed. Intentional acts, such as murder or suicide, and natural disasters are excluded.
Source of data • NaTIS
Method of calculation or
assessment • Simple count
Assumptions • Functional NaTIS Disaggregation of beneficiaries
(where applicable) • Target for women: N/A
• Target for youth: N/A
• Target for people with disabilities: N/A Spatial transformation (where
applicable) • Contribution to spatial transformation priorities: N/A
• Spatial impact area: N/A Desired performance • Fewer road crashes Indicator responsibility • Programme Manager
GUIDELINES FOR THE IMPLEMENTATION OF THE REVISED FRAMEWORK FOR STRATEGIC PLANS AND ANNUAL PERFORMANCE PLANS
3 9 Department of Transport: Annual Performance Plan
Part C: Measuring Our Performance
1. Institutional programme performance information 1.1 Programme: Road Transport
1.1.1 Purpose: The programme exists to develop and manage an integrated road infrastructure network, regulate road transport, ensure safer roads and oversee road agencies.
2. Outcomes, outputs, performance indicators and targets
3. Output indicators: annual and quarterly targets
4. Explanation of planned performance over the medium-term period 5. Programme resource considerations
Narrative: explanation of the resources’ contribution to achieving the outputs 6. Updated key risks and mitigation from the SP
7. Public entities
Outcome Outputs Output
indicators Annual targets
Audited performance Estimated
performance MTEF period
2016/17 2017/18 2018/19 2019/20 2020/21 2021/22 2022/23
Road crashes
reduced Amendment of the National Road Traffic Act (to include Driving School Regulations)
Approved Regulations for the National Road Traffic Act
- - - Draft National
Road Traffic Amendment Act
National Road Traffic Amendment Bill submitted to Cabinet
National Road Traffic Amendment Bill submitted to Parliament
Regulations for the National Road Traffic Amendment Act developed
Output
indicators Annual target Q1 Q2 Q3 Q4
Approved Regulations for the National Road Traffic Act
National Road Traffic Amendment Bill submitted to Cabinet
Consultation
with NEDLAC Improve the Bill with inputs from NEDLAC
National Road Traffic Amendment Bill submitted to Cabinet
-
Outcome Key risks Risk mitigation
Road crashes
reduced Fraud and corruption in road traffic law enforcement
• Implement the Sector Anti-Fraud and Corruption Strategy in partnership with relevant law enforcement agencies
Name of public entity Mandate Outcomes Current annual budget
Road Traffic Management
Corporation (RTMC) Road Traffic Management Corporation Act, 1999 (Act No.
20 of 1999)
Road crashes
reduced R 210 000 000
4 0
8. Public-Private Partnerships (PPPs)
Part D: Technical indicator descriptions (TIDs)
PPP title Purpose Outputs Current value of
agreement End date of agreement Moloto Rail
Development Corridor
Provide a
transport solution to the problems experienced by commuters along the Moloto Corridor
Reduced travel times; reduced peak period (from 4 to 2 hours); improved safety; reduction in road accidents, fatalities, injuries and damage to property;
reduction of traffic congestion in the Tshwane urban area.
Registered PPP;
currently in TA1 phase
2030
Indicator title • Approved Regulations for the National Road Traffic Act
Definition • The National Roads Act (Act 54 of 1996) will be amended and pro- mulgated in Parliament. The amended regulations will be approved by the Minister.
Source of data • Branch administration database Method of calculation
or assessment • Simple count
Means of verification • National Road Traffic Amendment Bill
• Proof of submission to Cabinet
Assumptions • The National Road Traffic Amendment Bill will be recommended by Cabinet sub-committees as scheduled.
Disaggregation of beneficiaries (where applicable)
• Target for women: N/A
• Target for youth: N/A
• Target for people with disabilities: N/A Spatial transformation
(where applicable) • N/A
Calculation type • Non-cumulative Reporting cycle • Quarterly
Desired performance • Approved Regulations for the National Road Traffic Act Indicator responsibility • Programme Manager
GUIDELINES FOR THE IMPLEMENTATION OF THE REVISED FRAMEWORK FOR STRATEGIC PLANS AND ANNUAL PERFORMANCE PLANS
4 1 Annexures to the Annual Performance Plan
Annexure B: Conditional grants
Annexure C: Consolidated indicators
Name of grant Purpose Outcome Current annual
budget Period of grant Public Transport
Operations Grant (PTOG)
To provide supplementary funding for public transport ser- vices provided by provincial depart- ments
Road crashes
reduced R25 000 000 2020-2025
Institution Output indicator Annual target Data source Provincial
Departments of Transport
Number of
weighbridge facilities operating 24/7
12 Provincial Quarterly
Performance Reports
4 2
Department of Transport: Annual Operational Plan 1. Our Operations
1.1 Programme: Road Transport
1.1.1 Purpose: The programme exists to develop and manage an integrated road infrastructure network, regulate road transport, ensure safer roads and oversee road agencies.
2. Activities, timeframes and budgets
Output Output
indicator Annual target Quarterly
target Activities Timeframe Budget per
activity Dependencies Responsibility Amendment
of the National Road Traffic Act (to include Driving School Regulations)
Approved Regulations for the National Road Traffic Act
National Road Traffic Amendment Bill submitted to Cabinet
Q1: Consultation with NEDLAC
Submit the draft Amendment Bill to the State Law Advisor
01 April 2019-
30 April 2019 Operational
budget DoT Legal Division State Law Advisor
Road Transport Branch
Consider State Law Advisor inputs
01 April 2019-
30 April 2019 Operational
budget - Road Transport
Branch Submit
the draft Amendment Bill to NEDLAC Secretariat
01 May 2019-
15 June 2019 Operational
budget NEDLAC Road Transport
Branch
GUIDELINES FOR THE IMPLEMENTATION OF THE REVISED FRAMEWORK FOR STRATEGIC PLANS AND ANNUAL PERFORMANCE PLANS
4 3 Provincial Department of Transport: Strategic Plan
Part C: Measuring Our Performance
1. Institutional performance information 2. Impact statement
3. Measuring our outcomes
3.1 Explanation of planned performance over the five-year planning period 4. Key risks and mitigations
5. Public entities
Impact statement A safe, secure, accessible, affordable and reliable transport system
MTSF priority Priority 5: Social Cohesion and Safe Communities
Outcome Outcome indicator Baseline Five-year target Road crashes
reduced Number of road crashes 200 000 100 000
Outcomes Key risks Risk mitigations
Road crashes reduced Human resource capacity to
police the roads • Collaboration between law enforcement stakeholders
• Employ additional human resources Increasing number of vehicles • Collaboration between law
enforcement stakeholders
• Employ additional human resources
Name of public entity Mandate Outcomes Current annual budget Provincial Transport
Investment Agency Provincial Act XXYY Road crashes reduced R 23 000 000
4 4
Part D: Technical indicator descriptions (TIDs)
Indicator title Number of road crashes
Definition • A road crash refers to any crash involving at least one road vehicle, occurring on a road open to public circulation and in which at least one person is injured or killed. Intentional acts, such as murder or suicide, and natural disasters are excluded.
Source of data • NaTIS
Method of calculation or
assessment • Simple count
Assumptions • Functional NaTIS Disaggregation of
wbeneficiaries (where applicable)
• Target for women: N/A
• Target for youth: N/A
• Target for people with disabilities: N/A Spatial transformation
(where applicable) • Contribution to spatial transformation priorities: N/A
• Spatial impact area: N/A Reporting cycle • Annual
Desired performance • Fewer road crashes Indicator responsibility • Programme Manager
GUIDELINES FOR THE IMPLEMENTATION OF THE REVISED FRAMEWORK FOR STRATEGIC PLANS AND ANNUAL PERFORMANCE PLANS
4 5 Provincial Department of Transport: Annual Performance Plan
Part C: Measuring Our Performance
1. Institutional programme performance information 1.1 Programme: Road Transport
1.1.1 Purpose: The programme exists to develop and manage an integrated road infrastructure network, regulate road transport, ensure safer roads and oversee road agencies.
2. Outcomes, outputs, performance indicators and targets
3. Output indicators: annual and quarterly targets
4. Explanation of planned performance over the medium-term period 5. Programme resource considerations
Narrative: explanation of the resources’ contribution to achieving the outputs.
6. Updated key risks and mitigations from the SP
Outcome Outputs Output indicators Annual targets
Audited performance Estimated
performance MTEF period
2016/17 2017/18 2018/19 2019/20 2020/21 2021/22 2022/23 Road
crashes reduced
24/7 weighbridge
operation Number of weighbridge facilities operating 24/7 New
indicator New indicator New
indicator New indicator 4 5 6
Facilities (DLTCs and VTSs) complying with set regulations and standards
Number of facilities compliant with set regulations and standards
New indicator New indicator New
indicator New
indicator 60 60 60
Output indicators Annual
target Q1 Q2 Q3 Q4
Number of weighbridge facilities operating 24/7 4 1 1 1 1 Number of weighbridge facilities compliant with set
regulations and standards 60 20 20 10 10
Outcome Key risks Risk mitigations
Road crashes reduced Fraud and corruption in road
traffic law enforcement • Implement the Sector Anti- Fraud and Corruption Strategy in partnership with relevant law enforcement agencies
4 6
7. Public entities
Part D: Technical indicator descriptions (TIDs)
Name of public entity Mandate Outcomes Current annual budget Provincial Transport
Investment Agency Provincial Act XXYY Road crashes reduced 200 000 000
Indicator title • Number of weighbridge facilities operating 24/7 Definition • Accredited weighbridge facilities operating 24/7 shifts.
A weighbridge is a facility for weighing vehicles, set into the ground to be driven on to.
Source of data • Reports from overloading control systems
• Daily operations captured at the overloading control systems and translated into reports
Method of calculation or
assessment • Simple count
Means of verification • System-generated reports
Assumptions • Data stored in the overloading control system is reliable, valid and timely.
Disaggregation of beneficiaries
(where applicable) • Target for women: N/A
• Target for youth: N/A
• Target for people with disabilities: N/A Spatial transformation (where
applicable) • Contribution to spatial transformation priorities: N/A
• Spatial impact area: N/A Calculation type • Cumulative (year-end) Reporting cycle • Quarterly
Desired performance • Optimal operation of weighbridge facilities 24/7 Indicator responsibility • Programme Manager
GUIDELINES FOR THE IMPLEMENTATION OF THE REVISED FRAMEWORK FOR STRATEGIC PLANS AND ANNUAL PERFORMANCE PLANS
4 7 Provincial Department of Transport: Annual Operational Plan
1. Our Operations
1.1 Programme: Road Transport
1.1.1 Purpose: The programme exists to develop and manage an integrated road infrastructure network, regulate road transport, ensure safer roads and oversee road agencies.
2. Activities, timeframes and budgets
Output Output
indicator Annual
target Quarterly
target Activities Timeframe Budget per
activity Dependencies Responsibility 24/7
weighbridge operation
Number of weighbridge facilities operating 24/7
4 1 Develop
business case for 24/7 operations
April- May R 200 000 Supply Chain Management to facilitate procurement of a service provider to develop a business case
Director: Law Enforce- ment
Pilot 24/7
operations May- June - - District Manager: Law
Enforcement
4 8
National Public Entity: Strategic Plan Part C: Measuring Our Performance
1. Institutional performance information 2. Impact statement
3. Measuring our outcomes
3.1 Explanation of planned performance over the five-year planning period 4. Key risks and mitigations
Part D: Technical indicator descriptions (TIDs)
Impact statement Safe and secure roads in South Africa
MTSF priority Priority 5: Social Cohesion and Safe Communities
Outcome Outcome indicators Baseline Five-year target Road crashes reduced Number of road crash-
es 2000 1000
Outcome Key risks Risk mitigations Road
crashes reduced
Budget cuts • Prioritise budget cut interventions
• Develop a funding model to ensure sustainable funding for road safety initiatives
High employee
attrition rate • Develop and implement a strategy to retain employees Fraud and
corruption • Provide rigorous, adequate, periodic training for road safety, transport and law enforcement officials
• Review and provide adequate remuneration for road safety, transport and law enforcement officials
• Institute a zero-tolerance approach to fraud and corruption across government departments and all road safety, transport and related agencies.
Indicator title • Number of road crashes
Definition • A road crash refers to any crash involving at least one road vehicle occurring on a road open to public circulation and in which at least one person is injured or killed. Intentional acts, such as murder or suicide, and natural disasters are excluded.
Source of data • NaTIS
Method of calculation or
assessment • Simple count
Assumptions • Functional NaTIS Disaggregation of
beneficiaries (where applicable)
• Target for women: N/A
• Target for youth: N/A
• Target for people with disabilities: N/A Spatial transformation
(where applicable) • Contribution to spatial transformation priorities: N/A
• Spatial impact area: N/A Reporting cycle • Annual
Desired performance • Fewer road crashes Indicator responsibility • Programme Manager
GUIDELINES FOR THE IMPLEMENTATION OF THE REVISED FRAMEWORK FOR STRATEGIC PLANS AND ANNUAL PERFORMANCE PLANS
4 9 National Public Entity: Annual Performance Plan
Part C: Measuring Our Performance
1. Institutional programme performance information 1.1 Programme: Road Transport
1.1.1 Purpose: The programme exists to develop and manage an integrated road infrastructure network, regulate road transport, ensure safer roads and oversee road agencies.
2. Outcomes, outputs, performance indicators and targets
3. Output indicators: annual and quarterly targets
4. Explanation of planned performance over the medium-term period 5. Programme resource considerations
6. Updated key risks and mitigation from the SP
Outcome Outputs Output indicators Annual targets
Audited performance Estimated
performance MTEF period
2016/17 2017/18 2018/19 2019/20 2020/21 2021/22 2022/23 Road crashes reduced Roadworthy
vehicles Percentage of roadworthy vehicles based on vehicle inspections
- - - - 80% 90% 100%
Output indicators Annual
target Q1 Q2 Q3 Q4
Percentage of roadworthy vehicles based on
vehicle inspections 80% 80% 80% 80% 80%
Outcome Key risks Risk mitigation Road crashes
reduced Budget cuts • Prioritise budget cut interventions
• Develop a funding model to ensure sustainable funding for road safety initiatives
High employee
attrition rate • Develop and implement a retention strategy Fraud and
corruption • Provide rigorous, adequate, periodic training for road safety, transport and law enforcement officials
• Review and provide adequate remuneration for road safety, transport and law enforcement officials
• Institute a zero-tolerance approach to fraud and corruption across government departments and all road safety, transport and related agencies.
5 0
Part D: Technical indicator descriptions (TIDs)
Indicator title • Percentage of roadworthy vehicles based on vehicle inspections Definition • Calculation of the number of roadworthy vehicles as a
percentage of the number of vehicles inspected. Vehicles are inspected to ensure that they comply with road-worthiness standards prescribed in the National Road Traffic Act.
Source of data • Calibration machine reports Method of calculation
or assessment • (Number of roadworthy vehicles divided by number of vehicles inspected) multiplied by 100
Means of verification • Calibration sheets recorded per vehicle
Assumptions • Calibration machines are functional and accurate Disaggregation of
beneficiaries (where applicable)
• Target for women: N/A
• Target for youth: N/A
• Target for people with disabilities: N/A Spatial transformation
(where applicable) • Contribution to spatial transformation priorities: N/A
• Spatial impact area: N/A Calculation type • Non-cumulative
Reporting cycle • Quarterly
Desired performance • Increased percentage of roadworthy vehicles Indicator responsibility • Programme Manager