Introduction ~
Local and Regional Geology , , ,
Local Geology , 6
- GeneraL ,. 7
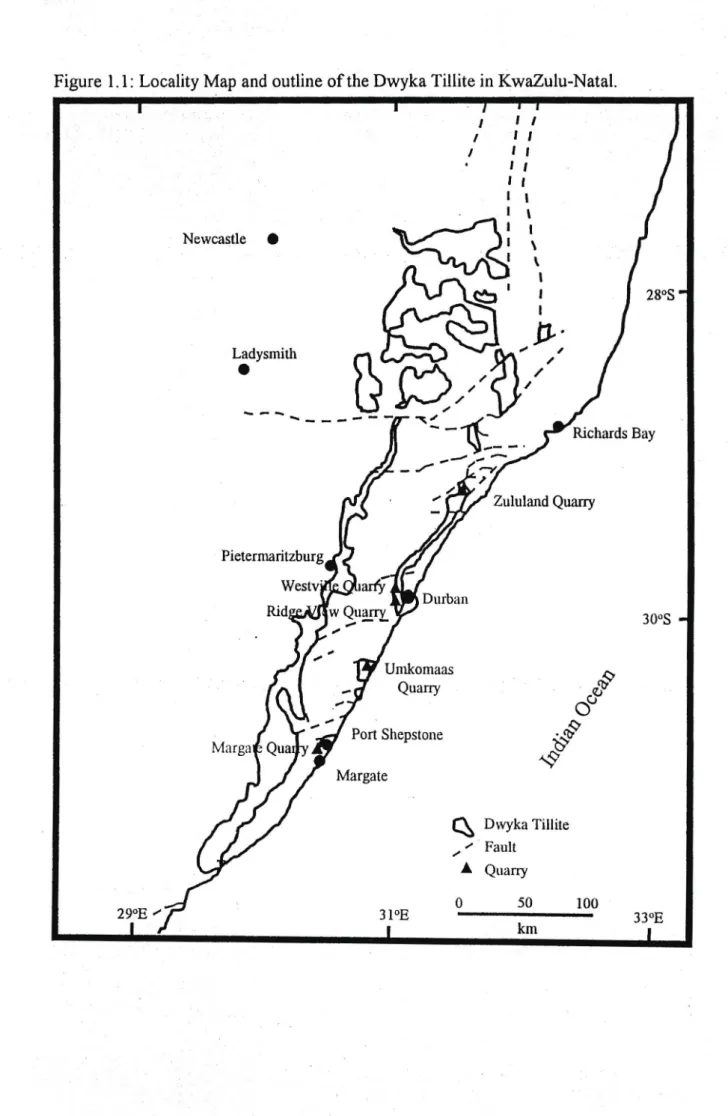
No major differences in the local geology of the Dwyka Tillite were noted across the five quarries. The nature and characteristics of the discontinuities and joint sets in each of the quarries are described in detail in Chapter 5. The geological bedrock consists of basement granite and greenstone from the Kaapvaal craton (3000 million years ago) (Tankard et al, 1982).
Erosion of these rocks resulted in the deposition of sediments in shallow basins forming the sandstones and shales of the Pongola Supergroup. The Palaeozoic sedimentary sequence of the overlying Natal Group, Dwyka Formation and Ecca Group is volumetrically the most important. Marine sediments of the Cretaceous Zululand Group and Quaternary coastal and fluvial deposits complete the geological sequence.
The Dwyka deposit in this area developed in a highly dissected surface resulting in variable thicknesses estimated from 80 m to 165 m (Brink, 1983, Von Brunn et al, 1989). In the northern parts of the region the faults tend to dip to the south and the half grabens and associated grabens are tilted to the north or northwest.
Description of discontinuities ~
A discontinuity is a plane of weakness within a rock mass across which the rock is structurally discontinuous. Their presence strongly influences the mechanical and hydrological behavior of the rock mass in terms of its strength, deformability, porosity, transmissivity and water retention capacity. The mechanical behavior is strongly influenced by the number of joint sets, while the shear strength and deformability of the rock mass is influenced by the joint pattern, its geometry and how well it is developed.
Discontinuity Survey , , 12
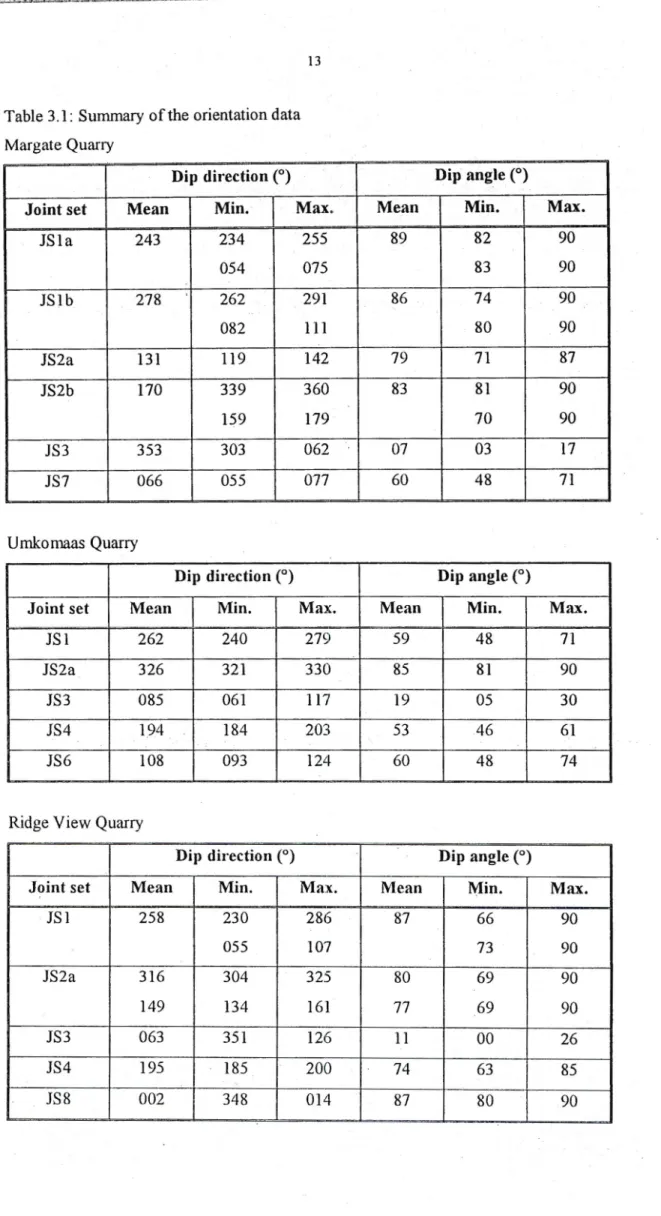
- Orientation Data
- Joint spacing and persistence
- Joint surface weathering and infill
- Joint roughness
- Other structural features
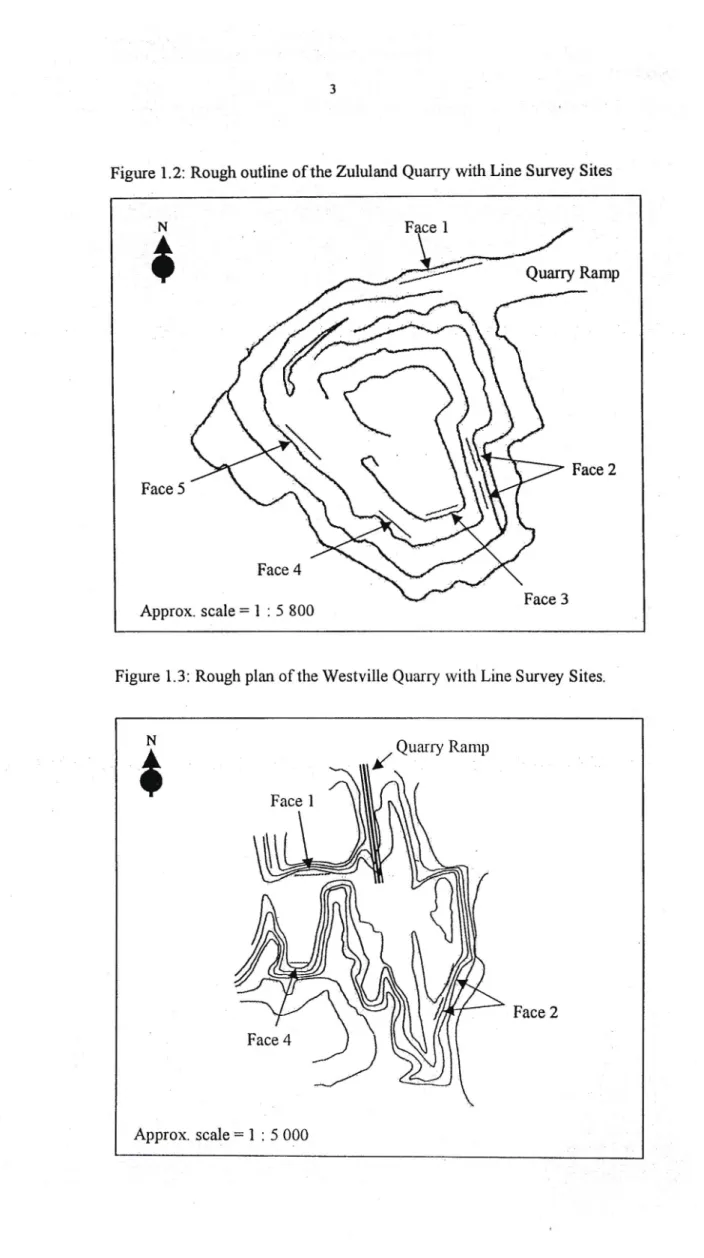
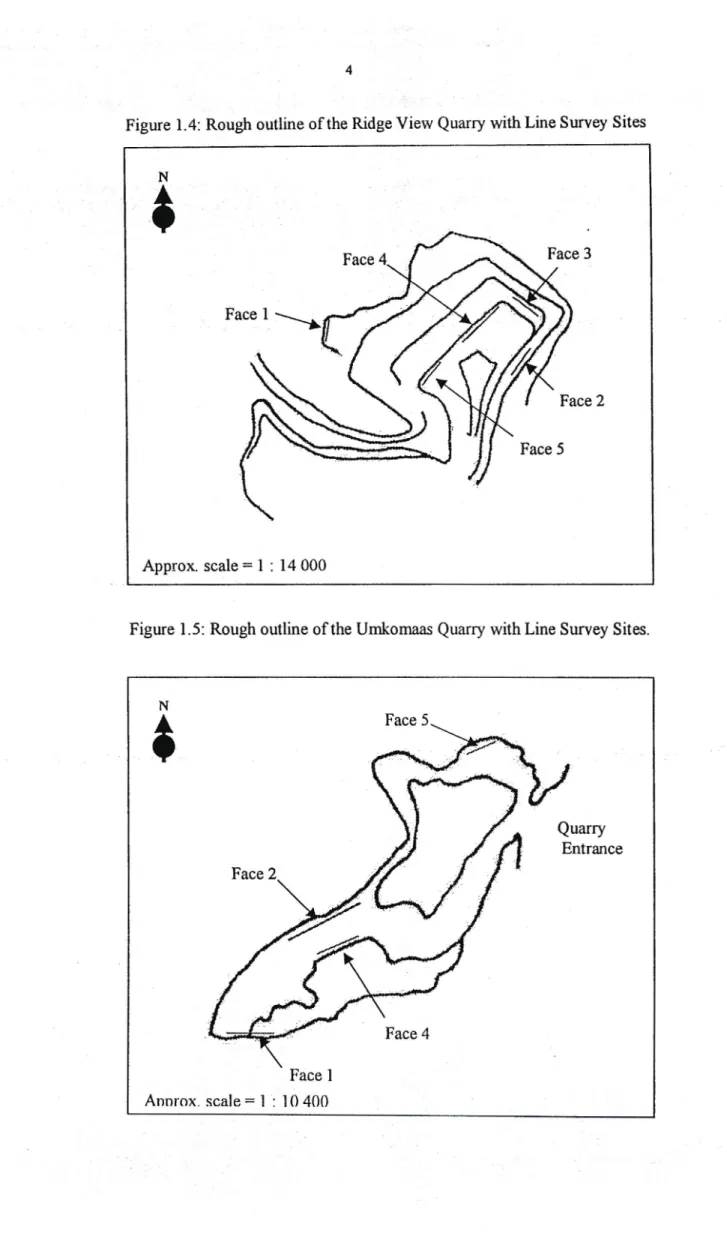
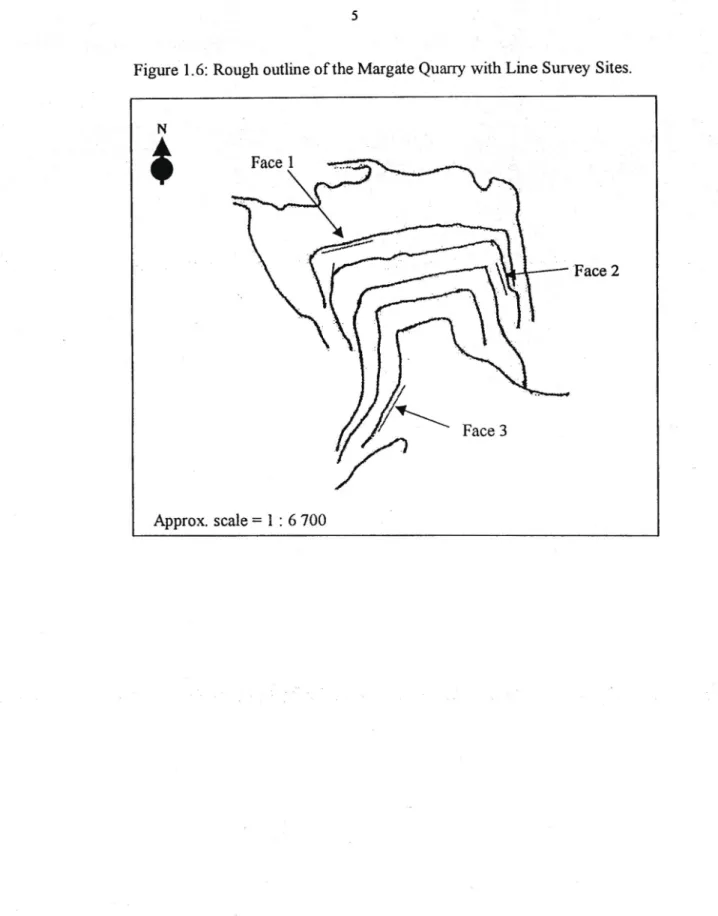
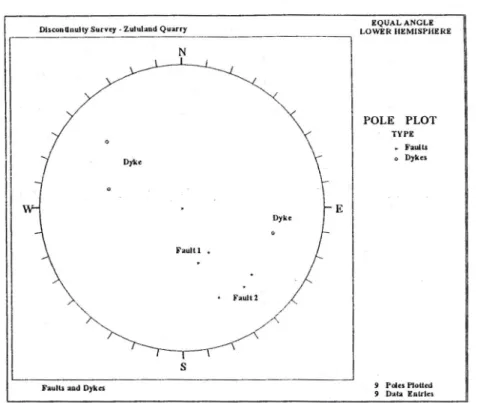
Common Complete 4: Common set 4 develops best in zululand quarry if it is subdivision in JS4A and JS4B. Joint Set 6: Joint Set 6 was recorded only in the Umkomas quarry with a concentration of pillars in the zululand. Common set 7: Common set 7 is poorly defined and is observed only in margate quarry.
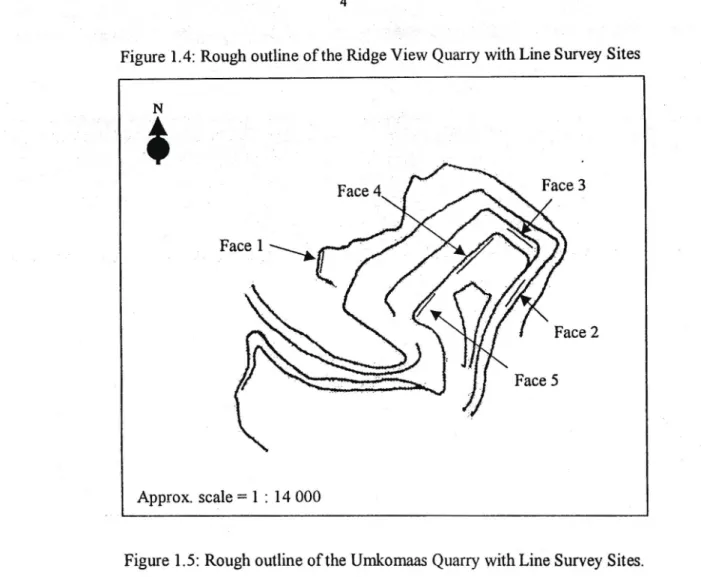
Joint set8: This poorly defined joint set was only recorded at the Ridge View Quarry. This gives a good indication of the differences in the joint systems between the different grooves. Blowing up the rock mass will have resulted in shifting the boulders, which has led to a greater variation in the orientation data of the connections.
It is obvious that the joint spacing of each joint set varies dramatically, not only between different quarries, but also within each quarry. The confidence in the rock slopes in the studied quarries can be mostly classified as either fresh (recently mined) or slightly to moderately weathered (older quarries).
Shear testing of discontinuities "
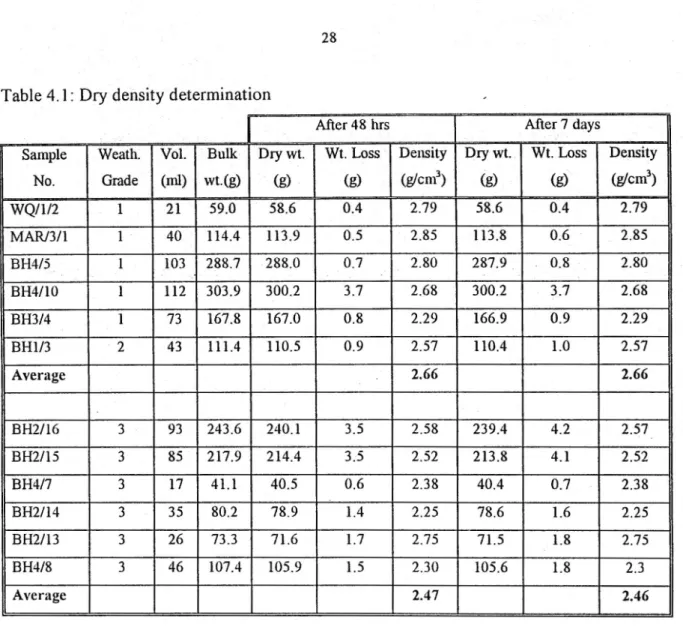
Determination of dry density
These values are slightly lower than those determined by Paige-Green (1975), who obtained 2.74 g/cm3 and 2.63 g/cm3 for resistance level I and 11 and level III, respectively.
Shear box testing
- Testing procedure
- Results and Discussion
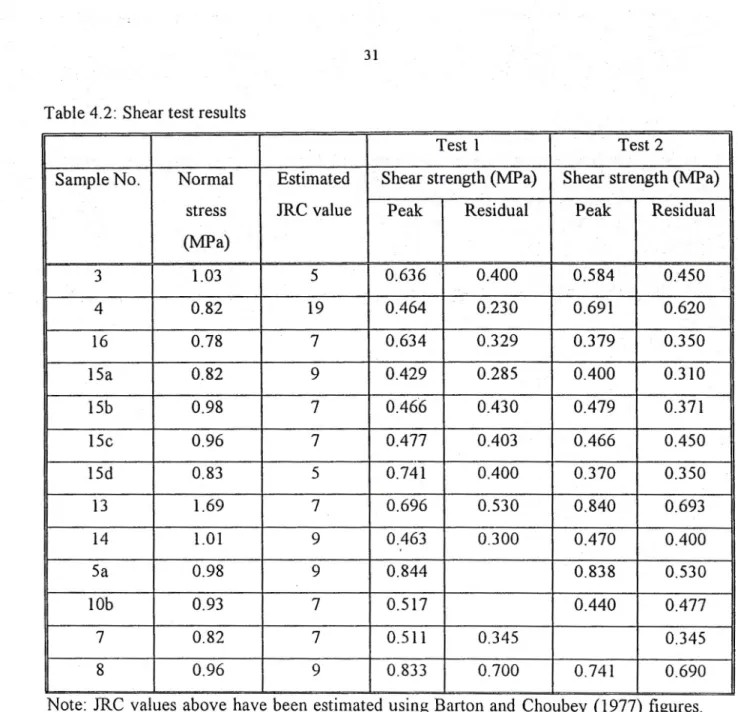
The normal stress was then calculated by dividing the shear load by the joint area. Any slack in the system was removed by tightening the wing nut attached to the top mold and back of the shear box apparatus. This may be due to the different normal loads applied and possibly due to weathering of the joint surfaces.
In other cases (e.g., samples 5a and 1Ob), the shear strength continued to decrease with continued horizontal displacement until the end of the test. This may be due to the weathered nature of the samples, which results in the partial disintegration of the joint surface with continued shearing. Samples 14, 14r, 7r, and 15dr showed a continued decrease in vertical displacement throughout the tests, possibly due to the weathered nature of the samples.
There appears to be no correlation between the roughness of the joint profiles and the amount of expansion during cutting. For the purpose of this project, the shear test results will not be used for slope stability analysis of the quarry.
Empirical determination of shear strength
Joint Roughness Coefficient
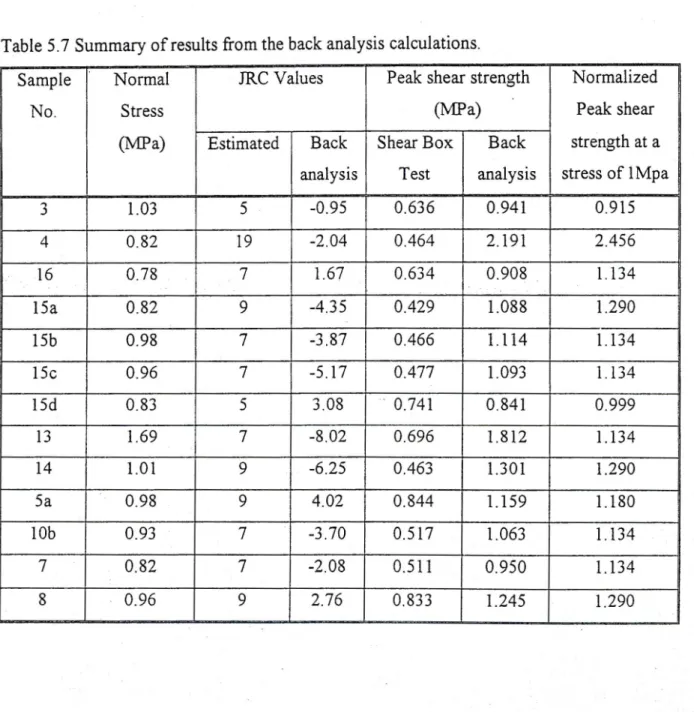
Barton and Choubey (1977) used back-calculated JRC values from multiple joint specimens to compile 10 different incremental roughness profiles. By comparing the roughness profiles of the studied joints with the standard profiles above, it is possible to estimate the JRC values for those joint surfaces. To partially overcome this problem, a carpenter's comb was used to obtain, where possible, three profiles for each joint.
Ideally, each profile should be plotted and then digitized to determine the JRC value using a program called JRCTSEC (personally. Due to the large number of joints surveyed during this study, this was not practical and the average JRC value (according to Barton and Choubey) . roughness profiles) was estimated from three profiles. Appendix B lists the JRC modal value for each set of joints for each face from different quarries.
JRC values were also estimated from the thirteen samples used for the shear box test (Appendix D).
Joint Wall Compressive Strength
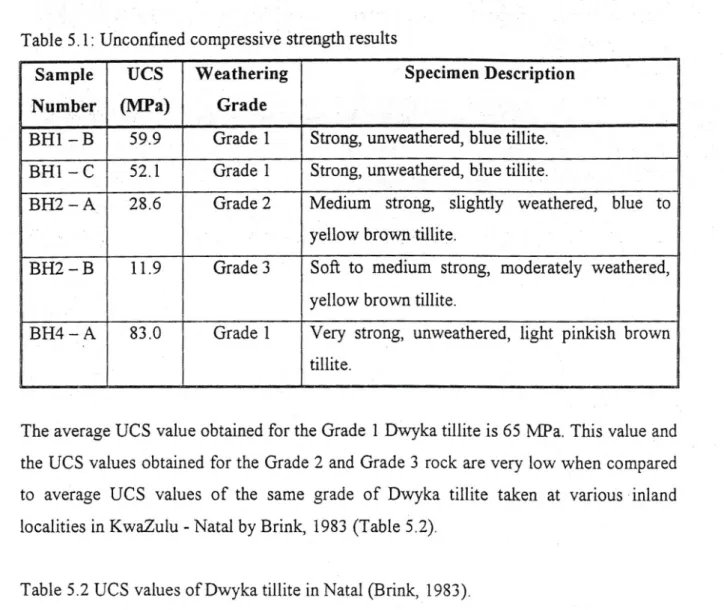
- Unconfined Compression Strength Test
- Schmidt Hammer Rebound Test
The low DeS values obtained from the Inanda Express Way core are to be expected as core I has been in storage since 1986 and therefore has undergone a fair amount of weathering. During the study, mostly very hard to hard rock (50 - 250 rvtPa; Barton et.al., 1978), unaltered to mild weathering (grade 2) and an average DeS value of 107 rvtPa, as defined by Brink. Therefore, the year 1983 (Table 5.2) is considered to be the most representative of tillite in the studied quarries. The L-type Schmidt hammer (Plate 5.1) is adapted for recording the recoil of a spring-loaded piston after its impact with a mating surface.
Although the International Society of Rock Mechanics (ISRM) recommends a total of 20 tests on each joint surface (Barton et.al., 1978), this was often not possible due to the small area of the joint surface exposed. Due to the limited number of readings taken during this study, all values were included to obtain a mean value. The Schmidt hammer rebound figure reaches a maximum when the instrument is held vertically downwards and a minimum when the hammer is held vertically upwards.
Correction factors were applied after the average Schmidt hammer value was obtained for each joint. All values for a given set of joints were averaged to obtain the mean value for that particular set of joints (Appendix B).
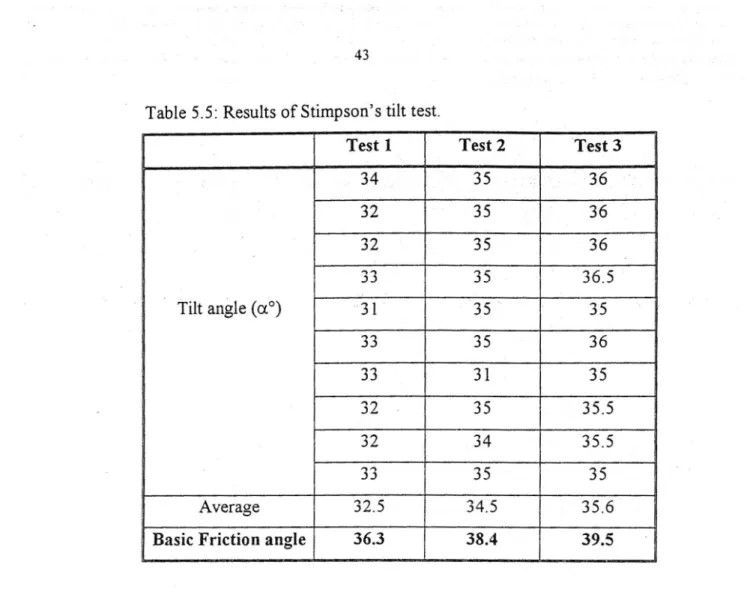
Basic Friction Angle
- Stimpson's Tilt Test
- Residual Tilt Test ,
After cleaning the surfaces and air-drying the samples, pairs of sawn surfaces are joined and tilted using a similar device to that used in the Stimpson tilt test. Rock samples from the Westville and Margate quarries and core from the Inanda Express Way research program were used. To determine the empirical shear strength of tillite, we decided to use the average values of the basic friction angle obtained by the Barton and Choubey method.
Back analysis Calculation
Barton et al (1974) of the Norwegian Geotechnical Institute have developed a Tunneling Quality Index, Q, for determining rock mass characteristics and tunnel support. In Equation 6.3, the first quotient (RQDI In) represents the structure of the rock mass and is a crude measure of block or particle size. These adjustments, which include weathering of the rock mass, joint orientation and blasting effects, recognize the life of the excavation and the time-dependent nature of the rock mass.
Because of the adjustments to the RlVIR for weathering, joint orientation, and blasting, the MRMR is considered a more accurate representation of the true quality of the rock mass. This is rubble material and generally consists of small individual pieces of rock that break away from the rock mass and collect at the base of the slope. In addition to the above techniques, an alternative but increasingly popular method of determining rock mass quality was used to estimate the stability of the slopes in question.
In addition, the rock mass assessment systems describe the rock quality of the tillite faces as only partially stable to stable. Palmstmm A (1985), Application of the number of volumetric joints as a measure for connecting rock mass, Proceedings of the International Symposium on Fundamentals of Rock Joints, Bjorkliden, pp 103 - 110.