Neither a cluster analysis nor a maximum likelihood classification was able to describe subtle variations in water–plant mixing. Fire scars reduced the accuracy of the spectral mixture analysis, but these scars could be identified by thermal imaging bands. No flooding was recorded in areas west and southwest of Mfabeni Swamp or in the southern parts of the study area.
Areas for each of the 10 water classes are shown in hectares 109 Figure 6.12: Area of class 1 (no water) in relation to the size of the study area 110 Figure 6.13: Correlation coefficients between the area of Bhangazi Lake and cumulative.
List of Tables
INTRODUCTION
- RATIONALE FOR THE STUDY
- AIM AND OBJECTIVES
- OVERVIEW OF THE THESIS
In the study, satellite-based remote sensing was used to map surface waters on the east coast. A final difficulty in conducting land-based mapping is that much of the surface water on the east coast is episodic or transient in nature. Develop a set of spectral signatures to detect the presence of surface water on the east coast.
Plan the distribution of surface water on the East Coast. Develop a protocol for mapping surface water distribution.
BACKGROUND TO THE STUDY AREA
- INTRODUCTION
- LOCATION OF THE STUDY AREA
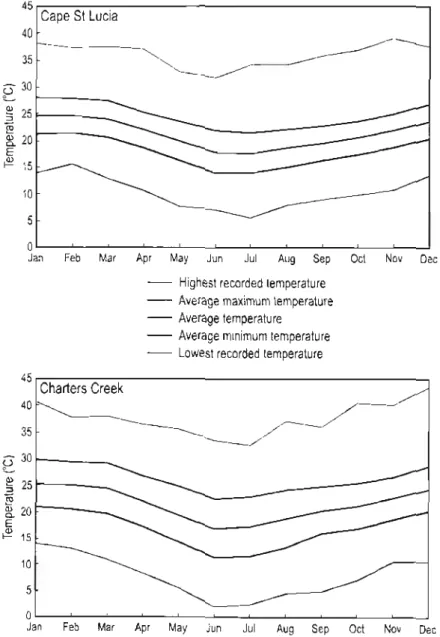
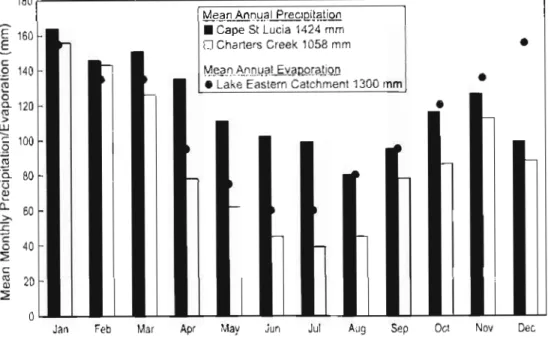
- CLIMATE
- BIOPHYSICAL CHARACTERISTICS
- THE EASTERN SHORES: HUMAN IMPACTS
- CONCLUSION
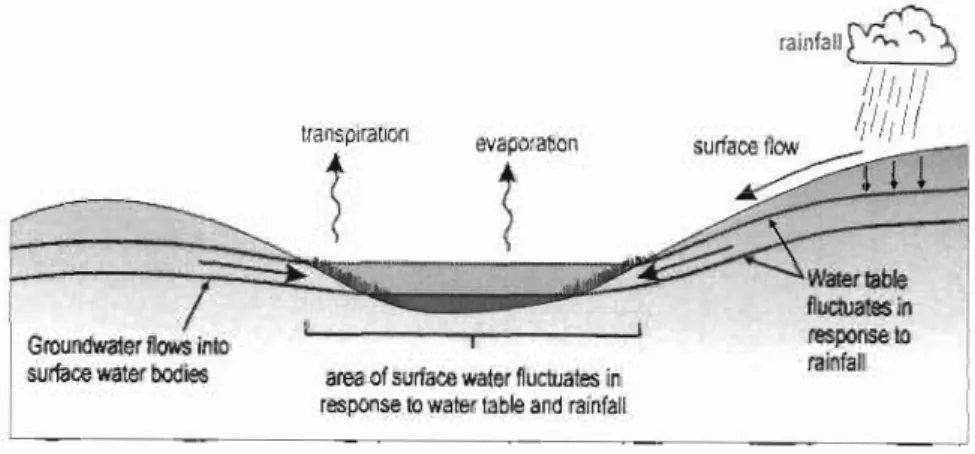
The hydrology of the eastern shores is largely driven by rainfall, and very little groundwater input occurs from Lake St Lucia (Kelbe, 2005, pers. comm.). A final notable feature of the eastern shores is the presence of large amounts of rutile, ilmenite and zircon in the coastal dunes. While World Heritage Site status recognizes the area's ecological importance, it must be remembered that the Eastern Shores are not a pristine wilderness unaffected by human influences.
The removal of these plantations is expected to have a major impact on the hydrology and vegetation of the eastern coasts, resulting in changes to the mosaic of grasslands, wetlands, lakes and forests that characterize this region.
THE THEORY OF IMAGE PROCESSING AND ANALYSIS
- INTRODUCTION
- AN OVERVIEW OF IMAGE PROCESSING AND ANALYSIS
- ATMOSPHERIC CORRECTION METHODS
- Absolute atmospheric corrections
- Relative atmospheric corrections
- IMAGE ENHANCEMENT AND TRANSFORMATION
- IMAGE CLASSIFICATION METHODS
- Supervised classification
- Unsupervised classification
- Hybrid classifiers
- ASSESSING THE ACCURACY OF CLASSIFIED IMAGES
- CONCLUSION
Both Lillesand & Kiefer (2000) and Eastman (2001) consider accuracy assessment to be part of the image classification process, whereas other authors (e.g. unsupervised classification methods try to find natural groupings or clusters in the spectral characteristics of the pixels. A soft classifier. will produce one output image for each of the land cover classes represented by .
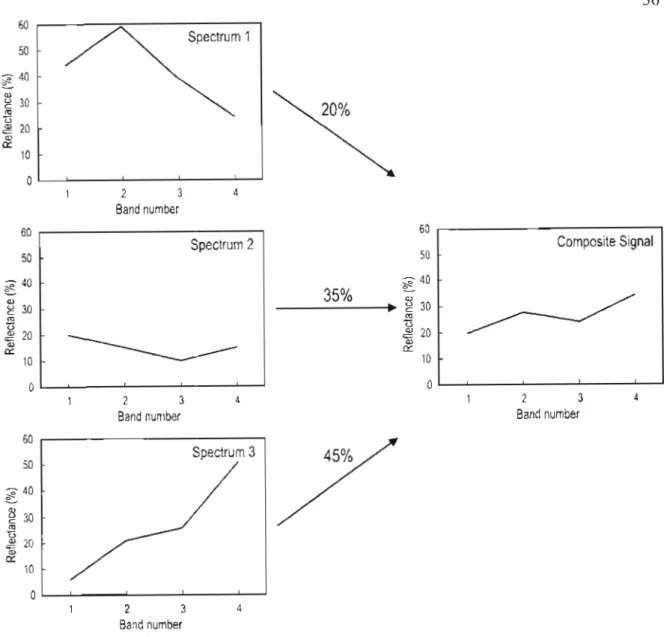
Alternatively, they could represent the proportions of the land cover classes present in the pixel.
REMOTE SENSING AND ITS APPLICATION
- INTRODUCTION
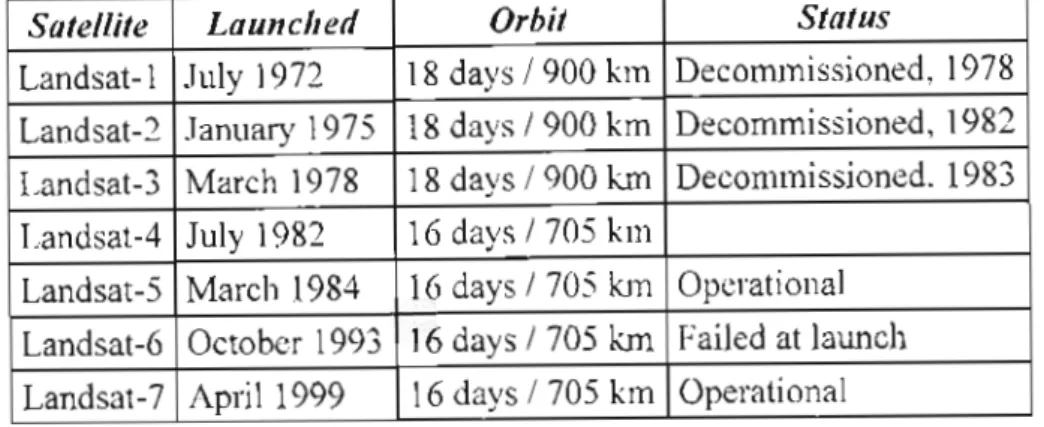
- EARLY SATELLITE-BASED REMOTE SENSING
- CONTEMPORARY SATELLITES AND REMOTE SENSING SYSTEMS
- REMOTE SENSING USING LANDSAT
- Reflectance characteristics of surface features
- Mapping surface water
- Mapping wetlands
- CONCLUSION
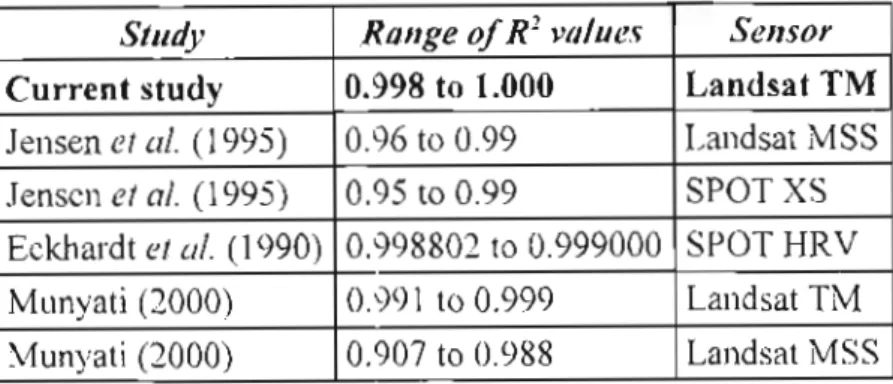
It is capable of acquiring seven data bands in the visible, mid-infrared and thermal parts of the electromagnetic spectrum (Lillesand & Kiefer, 2000), while the spatial resolution has been improved to 30 meters (from about 80 m for the MSS) . In addition, the latest generation of Thematic Mapper, the Enhanced Thematic Mapper (ETM+) on board Landsat-7, produces data of a higher radiometric quality than previous satellites in the Landsat program (Markham et al, 1997). The design and selection of Landsat TM bands has been greatly influenced by two factors, namely (a) the presence of atmospheric windows and (b) the reflectance characteristics of the Earth's surface features.
The location of these windows is determined by the absorption properties of the various atmospheric constituents. More recently, Braga et al. 2003) showed that the spectral reflectance patterns of water are not only influenced by the water depth and the characteristics of the bottom type, but also by dissolved and suspended materials in the water. In another wetland mapping exercise, Wang et al. 1998) used Landsat-5 TM and ERS-1 radar data to map and classify wetlands in the Great Lakes region of the USA.
Examination of this variation showed that it was caused by differences in (a) the amount of green biomass present in the sludge, (b) the degree of wetness of the sludge, and (c) the characteristics of the bottom layer of the sludge. mire. . Part of the reason for this is that the spectral characteristics of swamp forests are very similar to those of other forests. The analysis was performed using water and wetland end-members obtained from aerial photographs of the lagoon.
The first of these papers describes how mixture analysis of Landsat data was used to investigate suspended sediment concentrations in the waters of the Amazon wetlands. For one of the rivers, the selection of an additional vegetation end member made it possible to investigate the relative proportions of vegetation in the different water types.
METHODOLOGY
- INTRODUCTION
- IMAGE ACQUISITION
- IMAGE PREPARATION
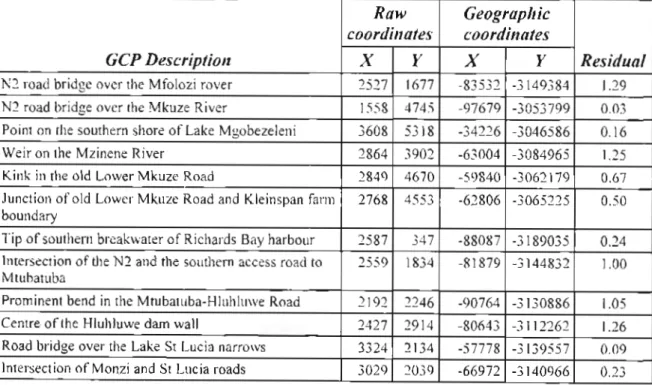
- Image rectification
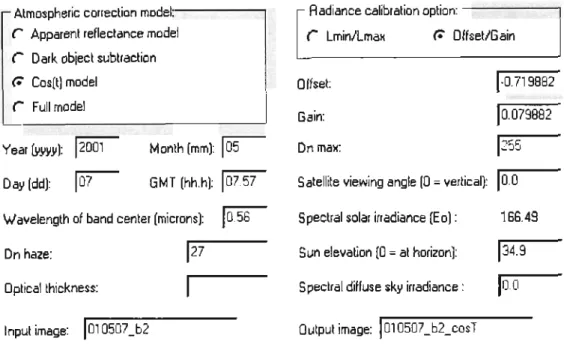
- Radiometric correction and image normalisation
- IMAGE TRANSFORMATION
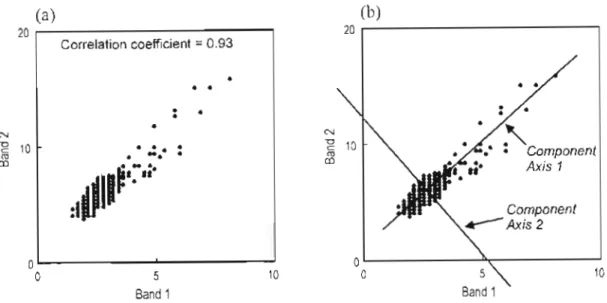
- Principal components analysis (PCA)
- Preparation of exclusion masks
- Application of the exclusion mask
- IMAGE CLASSIFICATION
- Cluster analysis
- Maximum likelihood classification
- Spectral mixture analysis
- ACCURACY ASSESSMENT
- CONCLUSION
After all reflective bands of the reference image were radiometrically corrected, they were multiplied. The next stage of the image normalization process was the radiometric normalization of the target images with respect to the reference image. Only one of the dark targets was used for the final normalization of each band.
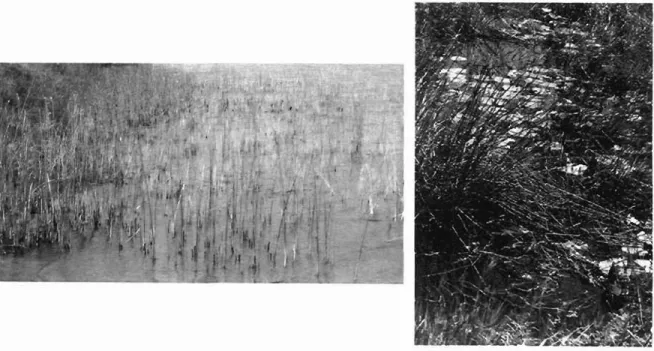
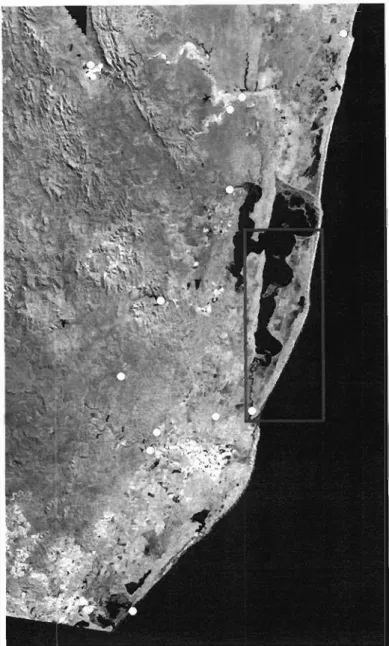
Together, these three components explained more than 99% of the variance for each of the study dates. Second, it was used to compensate for possible misregistration of the images during the correction process. Training sites identified during field visits to the study area are located on composite color images of the East Coast.
Endmembers for the principal component data sets were selected from the scattergrams of the first three components. Mixed pixels containing trees, shrubs or small forest patches still remained in the unmasked part of the study area. These pure forest pixels were then used to derive the corresponding pixel reflectance values for each of the spectral bands from the seven survey dates.
This led to the investigation of alternative methods to determine the accuracy of the image classifications. These comparisons of rainfall against surface water were used to determine the accuracy of the image classification.
RESULTS
- INTRODUCTION
- IMAGE PREPARATION
- Image rectification
- Radiometric correction and image normalisation
- IMAGE TRANSFORMATION
- Principal Components Analysis
- Exclusion Masks
- IMAGE CLASSIFICATION
- Cluster analysis
- Maximum likelihood classification
- Spectral mixture analysis
- Appraisal of image classification techniques
- ACCURACY ASSESSMENT
- Assessment using cumulative rainfall
- The effects of fire on classification accuracy
- SEASONAL AND SPATIAL DISTRIBUTION OF SURFACE WATER
- CONCLUSION
The first of these was the study area mask, which resulted in the exclusion of all areas outside the Eastern Shore study area. An exception to this appeared in the cluster classification of the September 2002 component data set. This landscape complexity was also reflected in the results of the cluster and mixture analyzes discussed elsewhere in this chapter.
Spectrally similar end members would have led to confusion in the unmixing process, thus compromising the accuracy of the results. The areas represented by each of the water classes are shown in Figure 6.11, which shows large differences in the distribution of surface water obtained from the two data sets. The results of the spectral mixture analysis indicate the presence of surface water in two fire signatures visible in the April and September 2002 images.
Band 8 therefore covers the same spectral region as three of the four bands used in the mixture analysis of the spectral data. The picture presented by the results of the driest period in 2002 is confounded by the effects of fire scars. The differences in the September and October curves can be explained by the freshness of the fire scar.
Most of the surface water in the study area was found in Lake Bhangazi, Mfabeni Swamp and the wilderness area in the north. Permanently dry areas were found west and south-west of Mfabeni and also in the south.
DISCUSSION
- INTRODUCTION
- IMAGE PREPARATION AND TRANSFORMATION
- CLASSIFICATION METHODS
- Hard classifiers
- Spectral mixture analysis
- ASSESSING THE ACCURACY OF RESULTS
- SURFACE WATER ON THE EASTERN SHORES
- A PROTOCOL FOR MAPPING SURFACE WATER
- Description
- PROTOCOL APPLICATION: MAPPING WATER IN MAPUTALAND
- CONCLUSION
A national land cover classification for South Africa (CSIR/ARC, 1998) identified unimproved grasslands, wetlands and scrub and bushland as the main cover types in the exposed area of the east coast. They hypothesized that these contained different types of land cover that they were trying to map. Both hard classifiers provided good estimates of the amount of open water in the study area.
Shade was increased by the presence of trees (Adams et al, 1995) but was considered less of a problem in grassland and wetland environments of the east coast. A final point on water map accuracy relates to the effect of fire scars on classification. This similarity was observed in the results of this study, where large fire scars in April and September 2002 biased the water map results.
It is therefore not surprising that most water classes from this study coincided with the unimproved grassland class, with a smaller peak being in the wetland class. By comparing the results of this study with both cumulative rainfall and land cover maps from CSIR/ARC (1998) and Smith (2001), the accuracy of the spectral mixture analysis technique could be assessed. One of the main objectives of this study was to develop a protocol for mapping the distribution of surface water in the study area using remotely sensed data.
An analysis of the protocol output shows that the three main water bodies in the area - the Indian Ocean, Lake St Lucia and Lake Sibaya - have been successfully mapped (Figure 7.2a). This has demonstrated the robustness, applicability and transferability of the techniques incorporated in the protocol.
CONCLUSION AND RECOMMENDATIONS
- ACHIEVEMENT OF THE PROJECT AIM AND OBJECTIVES
- IMPORTANT RESULTS ARISING OUT OF THIS STUDY
- RECOMMENDATIONS FOR FUTURE STUDIES
- Protocol validation
- Relating water distribution and concentration to wetlands
- Modelling
- CONCLUDING REMARKS
This classification produced a set of endmember spectra (see Figure 6.7 on page 103) that were used to map the presence of surface water in the study area as well as the varying concentrations of the water-vegetation mixture. When interpreting the results of the water mapping protocol, a number of caveats should be remembered. The presence of fresh burn scars has been shown to lead to inaccurate spectral unmixing, leading to an overestimation of the amount of surface water.
Some of these related to the development of endmembers used to determine water-vegetation mixing, while others related to the use of the Landsat thematic mapper. A water mapping protocol was developed using the spectral and spatial resolution of the Landsat Thematic Mapper. In addition to testing the influence of the satellite platform and endmember selection on the water mapping protocol, the protocol's inputs and outputs can also be tested.
The accuracy of the water mapping capability of the protocol has yet to be tested for other areas of South Africa. The aim of this research was to map the surface water of the eastern shores. Wetlands can be defined in terms of the hydroperiod, which describes the flooding pattern in the wetland.
If it were possible to establish a relationship between groundwater levels and surface water distribution (as was done between rainfall and surface water in this study), then the protocol could be used to determine the effects of sea level rise on the surface water of the Eastern Shores. It is also hoped that the water distribution maps produced by this study will go a long way towards providing an understanding of the complex environmental interactions that occur on the Eastern seaboard, thereby contributing to the effective management of this unique environment.
Normalisation equations
Transformation Data for the Reference Image
Correlation Matrices for the Spectral and Component Datasets
Unsupervised Cluster Classifications
Supervised Maximum Likelihood Classifications
Calculation of Mixture Analysis Residuals