JHEP09(2023)004
Published for SISSA by Springer Received: February 24, 2023 Accepted:May 30, 2023 Published: September 1, 2023
Search for a light charged Higgs boson in t → H
±b decays, with H
±→ cb, in the lepton+jets final state in proton-proton collisions at √
s = 13 TeV with the ATLAS detector
The ATLAS collaboration
E-mail: [email protected]
Abstract: A search for a charged Higgs boson, H±, produced in top-quark decays, t→ H±b, is presented. The search targets H± decays into a bottom and a charm quark, H±→cb. The analysis focuses on a selection enriched in top-quark pair production, where one top quark decays into a leptonically decaying W boson and a bottom quark, and the other top quark decays into a charged Higgs boson and a bottom quark. This topology leads to a lepton-plus-jets final state, characterised by an isolated electron or muon and at least four jets. The search exploits the high multiplicity of jets containing b-hadrons, and deploys a neural network classifier that uses the kinematic differences between the signal and the background. The search uses a dataset of proton-proton collisions collected at a centre-of-mass energy √
s = 13 TeV between 2015 and 2018 with the ATLAS detector at CERN’s Large Hadron Collider, amounting to an integrated luminosity of 139 fb−1. Observed (expected) 95% confidence-level upper limits between 0.15% (0.09%) and 0.42%
(0.25%) are derived for the product of branching fractions B(t → H±b)×B(H± → cb) for charged Higgs boson masses between 60 and 160 GeV, assuming the SM production of the top-quark pairs.
Keywords: Hadron-Hadron Scattering
ArXiv ePrint: 2302.11739
JHEP09(2023)004
Contents
1 Introduction 1
2 ATLAS detector 3
3 Objects definition and event selection 4
4 Monte Carlo samples 5
4.1 t¯tbackground simulation 6
4.2 Signal simulation 7
4.3 Other samples 7
5 Analysis strategy 8
5.1 Event categorisation 8
5.2 t¯tmodelling 9
5.3 Neural network discriminant 11
6 Systematic uncertainties 14
6.1 Luminosity and pile-up 14
6.2 Object reconstruction 14
6.3 t¯tbackground modelling 15
6.4 Signal modelling 15
6.5 Modelling of other backgrounds 16
7 Results 17
8 Conclusion 24
The ATLAS collaboration 33
1 Introduction
The Higgs boson’s discovery by the ATLAS and CMS Collaborations at the Large Hadron Collider (LHC) [1,2] and subsequent campaigns to precisely measure its properties [3,4]
confirmed that the Standard Model (SM) of particle physics is an effective description of nature up to the TeV energy scale.
Within the SM framework, the Brout-Englert-Higgs mechanism [5–10] is responsible for generating the masses of the gauge bosons via electroweak symmetry breaking (EWSB).
The Higgs boson emerges from the EWSB as the only physical spin-0 CP-even particle of the SM, while the remaining components of the complex Higgs field doublet are absorbed into the longitudinal components of the gauge bosons.
JHEP09(2023)004
In scenarios beyond the Standard Model, the Higgs sector is typically extended to incorporate new degrees of freedom. A popular and minimal extension of the SM paradigm is provided by two-Higgs-doublet models (2HDM) [11], where the Higgs sector consists of two complex doublets, a mixture of the two doublets fulfils the same role as the SM Higgs field and generates a Higgs boson (h) similar to that in the SM, and the other mixture gives rise to a neutral CP-even Higgs boson (H), a neutral CP-odd Higgs boson (A), and a charged Higgs boson (H±). Unlike the SM, a general 2HDM allows flavour changing neutral current (FCNC) interactions at tree level, which need to be suppressed. This is normally achieved by requiring that all fermions with the same electric charge couple to one Higgs doublet only [12, 13], a condition referred to as “Natural Flavour Conservation” (NFC).
Depending on the assignment of up/down-type quark and lepton couplings to each Higgs doublet, 2HDMs are categorised into four different types: type-I, type-II, type-III (lepton- specific), and type-IV (flipped, also known as type-Y). A concrete realisation of a type-II 2HDM with NFC includes the Minimal Supersymmetric Standard Model (MSSM) [14,15].
Similar Higgs sectors also arise in axion models [16].
Direct searches for new scalar particles, constraints from flavour observables, and pre- cision measurements of the discovered Higgs boson suggest that the natural mass scale for additional Higgs bosons from 2HDMs with NFC lies above several hundred GeV, depend- ing on the assumed model parameters (see e.g. refs. [17–20]). On the other hand, such constraints can be evaded or mitigated in other non-minimal extensions of the SM Higgs sector. A particularly rich phenomenology is expected in models with three Higgs doublets (3HDM) [21], which feature three CP-even and two CP-odd neutral Higgs bosons, as well as two charged Higgs bosons. In 3HDMs the lightest charged Higgs boson can be lighter than the top quark and can decay mainly into either a τ-lepton and a neutrino, a charm quark and a bottom quark, or a strange quark and a charm quark [22].
A search forH±→cbdecays1in top-quark decays was performed by the CMS Collabo- ration [23] using 19.7 fb−1of proton-proton (pp) collision data collected at√
s= 8 TeV; it re- ported upper limits at 95% confidence level (CL) on the branching fractionB(t→H±b) of (0.8–0.5)%, assumingB(H±→cb) = 1.0, for a charged Higgs boson mass (mH±) between 90 and 150 GeV. Related searches forH±→csin top-quark decays were performed by the ATLAS [24] and CMS [25] Collaborations, based respectively on 4.7 fb−1 and 19.7 fb−1 of ppcollision data collected at the centre-of-mass energies√
s= 7 TeV and√
s= 8 TeV; these searches reported upper limits at 95% CL on the branching fraction B(t→H±b) varying between 1% and 5%, assumingB(H±→cs) = 1.0, formH± between 90 and 160 GeV.
This paper presents a search for H± → cb in top-quark decays which is based on a dataset of pp collisions collected at a centre-of-mass energy √
s = 13 TeV between 2015 and 2018 with the ATLAS detector, amounting to an integrated luminosity of 139 fb−1. The analysis focuses on a data sample enriched in top-quark pair production (t¯t), where one top quark decays into a leptonically decaying W boson and a bottom quark, and the other top quark decays into a H± boson and a bottom quark, as illustrated in figure 1.
Compared to searches forH±→csand H±→τ ν int¯tevents, searches forH± →cb take
1Charge conjugation is implied throughout the paper; the notationcbis used in place ofc¯b/¯cb.
JHEP09(2023)004
Figure 1. Illustrative leading-order Feynman diagrams for the signal considered. Charge- conjugated Feynman diagrams are also assumed.
advantage of a significantly smaller yield of the irreducible SM background originating from t¯tproduction with aW boson decaying into the Cabibbo-Kobayashi-Maskawa suppressed mode W → cb. The search exploits the high multiplicity of jets containing b-hadrons (b- jets), as expected from signal events, and deploys a neural network classifier that uses the kinematic differences between the signal and the background. Thanks to a sizeably larger dataset and improved analysis techniques, this search improves the expected sensitivity to H±→cbin top-quark decays by a factor of five compared to the previous publication [23]
and explores an extendedmH± range, between 60 and 160 GeV.
2 ATLAS detector
The ATLAS experiment [26] at the LHC is a multipurpose particle detector with a forward- backward symmetric cylindrical geometry and a near 4πcoverage in solid angle.2 It consists of an inner tracking detector surrounded by a thin superconducting solenoid providing a 2 T axial magnetic field, electromagnetic and hadron calorimeters, and a muon spectrom- eter. The inner tracking detector covers the pseudorapidity range |η|<2.5. It consists of silicon pixel, silicon microstrip, and transition radiation tracking detectors. Lead/liquid- argon (LAr) sampling calorimeters provide electromagnetic (EM) energy measurements with high granularity. A steel/scintillator-tile hadron calorimeter covers the central pseu- dorapidity range (|η|<1.7). The endcap and forward regions are instrumented with LAr calorimeters for both the EM and hadronic energy measurements up to |η| = 4.9. The muon spectrometer surrounds the calorimeters and is based on three large superconduct- ing air-core toroidal magnets with eight coils each. The field integral of the toroids ranges between 2.0 and 6.0 T m across most of the detector. The muon spectrometer includes a system of precision tracking chambers and fast detectors for triggering. A two-level trigger
2ATLAS uses a right-handed coordinate system with its origin at the nominal interaction point (IP) in the centre of the detector and thez-axis along the beam pipe. Thex-axis points from the IP to the centre of the LHC ring, and they-axis points upwards. Cylindrical coordinates (r, φ) are used in the transverse plane,φbeing the azimuthal angle around thez-axis. The pseudorapidity is defined in terms of the polar angleθ asη=−ln tan(θ/2). Angular distance is measured in units of ∆R≡p
(∆η)2+ (∆φ)2.
JHEP09(2023)004
system is used to select events. The first-level trigger is implemented in hardware and uses a subset of the detector information to accept events at a rate below 100 kHz. This is followed by a software-based trigger that reduces the accepted event rate to 1 kHz on average depending on the data-taking conditions. An extensive software suite [27] is used for real and simulated data reconstruction and analysis, for operation and in the trigger and data acquisition systems of the experiment.
3 Objects definition and event selection Data from pp collisions at √
s = 13 TeV were recorded by the ATLAS detector between 2015 and 2018. Only data for which all detector subsystems were operational are used [28];
this dataset corresponds to an integrated luminosity of 139 fb−1 [29,30].
Events were recorded with a single-electron or single-muon trigger, with minimum thresholds for the transverse momentum (pT) varying from 20 to 26 GeV depending on the lepton flavour and the data-taking period. The triggers with the lowest pT thresholds included isolation requirements based on the inner tracking detector or electromagnetic calorimeter measurements [31–34].
In each event, the primary vertex is defined as the reconstructed vertex having the highest scalar sum of the squared pT of associated tracks withpT≥0.5 GeV.
Electrons are reconstructed from energy clusters in the electromagnetic calorimeter that are geometrically matched to a track in the inner tracking detector. Electrons are required to satisfy |η|<2.47 and a “Tight” identification requirement using a likelihood- based method [35]; electrons are rejected if their calorimeter clusters lie within the tran- sition region between the barrel and endcaps of the electromagnetic calorimeter, 1.37 <
|η|<1.52. Muons are reconstructed from muon spectrometer tracks matched to tracks in the inner tracking detector in the pseudorapidity range |η| < 2.5. Muon identification is based on “Medium” requirements [36]. Selected electrons and muons are required to have pT ≥27 GeV.
Isolation criteria are applied to the selected electrons and muons. For electrons, the scalar sum of the transverse energy in calorimeter energy clusters within a cone of size
∆R= 0.2 around the electron is required to be less than 6% of the electron pT, excluding clusters originating from the electron itself. For muons, the scalar sum of the pT of tracks within a fixed-size cone around the muon (excluding its associated track) must be less than 6% of the muon pT. The track isolation cone size is ∆R= 0.3 for muonpT<50 GeV and
∆R= 0.2 for muonpT>50 GeV.
Jets are reconstructed from topological energy clusters in the calorimeter [37] using the particle-flow method [38], based on the anti-kt clustering algorithm [39,40] with a radius parameter of 0.4. The jet energy is calibrated at particle level [41], and jets are required to have |η|<2.5 and a minimum pT of 25 GeV. For jets with |η|<2.4 andpT<60 GeV, those originating from additionalppcollisions in the same or neighbouring bunch crossings (pile-up) are suppressed by the use of the “jet-vertex-tagger” [42].
Jets containing b-hadrons are identified with the DL1rb-tagging algorithm [43]. A jet isb-tagged if the DL1r score is above a certain threshold, referred to as an operating point
JHEP09(2023)004
(OP). Four OPs are defined with average expected efficiencies for b-jets of 60%, 70%, 77%
and 85%, as determined in simulated t¯t events. The DL1r b-tagging score is divided into five exclusive bins according to the OPs. The distribution obtained by ordering these five bins from higher to lowerb-jet efficiency is referred to as the “pseudo-continuous”b-tagging score.
The missing transverse momentum, with magnitude ETmiss, is defined as the negative vector sum of the transverse momenta of all selected and calibrated physics objects. Low- momentum tracks from the primary vertex that cannot be associated with any of the reconstructed physics objects described before are also included in theEmissT calculation [44].
A sequential overlap removal procedure is applied to ensure that the same calorimeter energy deposit or the same track is not associated with two or more different reconstructed objects, following the prescription described in ref. [45].
The events are required to have exactly one selected electron or muon that matches the lepton that fired the trigger, and at least four jets. At least two of the jets are required to pass the 60% OP b-tagging requirement and an additional jet is required to pass the 70% b-tagging OP. In order to suppress background from multijet production, additional requirements are made on ETmiss as well as on the transverse mass of the lepton and ETmiss system (mWT ):3 ETmiss >20 GeV and ETmiss+mWT >60 GeV. The above requirements are referred to as the “preselection”.
4 Monte Carlo samples
Monte Carlo (MC) simulation samples are used to model all backgrounds as well as theH± signal, and evaluate related modelling uncertainties. The main background for this search originates from tt¯production in association with jets, followed by smaller contributions from single-top-quark, V+jets, t¯tV, t¯tH, diboson and other rare processes involving the production of a top quark. Background due to non-prompt leptons is expected to be negligible, based on studies of data using multiple lepton isolation criteria [46] and analysis of low-ETmiss events.
The matrix-element calculations for all generated samples use theNNPDF3.0nlo[47]
set of parton distribution functions (PDFs), unless stated otherwise. In all samples inter- faced toPythia8 [48] orHerwig7 [49,50], the decays of bottom and charm hadrons were simulated using the EvtGen1.2.0 program [51]. Pythia8.230 [52] modelled the parton shower, hadronisation, and underlying event, with parameters set according to the A14 tune [53] and using the NNPDF2.3lo [47] PDF set; Herwig7.04 used the H7UE tune and theMMHT2014lo[54] PDF set; andHerwig7.13 used theHerwig7.1 default set of tuned parameters and the same PDF set. The effect of pile-up was modelled by overlaying each simulated hard-scatter event with inelastic pp events generated with Pythia8.186 using the NNPDF2.3lo [55] PDF set and the A3 tune [56].
3mWT =p
2p`TEmissT (1−cos ∆φ), wherep`Tis the transverse momentum (energy) of the muon (electron) and ∆φis the azimuthal angle separation between the lepton and the direction of the missing transverse momentum.
JHEP09(2023)004
The generated events were processed through either a simulation [57] of the ATLAS detector geometry and response using Geant4 [58] or a faster simulation, where the full Geant4simulation of the calorimeter response is replaced by a detailed parameterisation of the shower shapes [59]. Simulated events were processed through the same reconstruc- tion software as the data, and corrections were applied so that the object identification efficiencies, energy scales and energy resolutions matched those determined from data con- trol samples.
4.1 t¯t background simulation
The production of t¯t → W bW b events (denoted simply t¯t in the following) was modelled using thePowheg Boxv2 [60–63] generator at next-to-leading order (NLO) with thehdamp parameter4 set to 1.5 times the top-quark mass,mtop [64]. The matrix-element calculation includes diagrams with ab-quark in the initial state using the five-flavour scheme [65]. The events were interfaced to Pythia8.230 [52] to model the parton shower, hadronisation, and underlying event.
The impact of using a different parton shower and hadronisation model was eval- uated by comparing the nominal t¯t sample with another sample produced with the Powheg Boxv2 generator interfaced to Herwig7.04 instead of Pythia8.230.
To assess the uncertainty associated with the NLO generator, the Powheg Boxv2 sample was compared with a sample of events generated with [email protected] interfaced toPythia8.230.
Analogously to similar searches performed previously in ATLAS [46,66], the simulated t¯tevents are categorised according to the flavour content of additional jets not originating from the decay of thett¯system. Events that have at least oneb-jet, excluding heavy-flavour jets from top-quark or W-boson decays, are labelled as t¯t+≥1b; those with no additional b-jets but at least one charm-jet (c-jet) are labelled ast¯t+≥1c; finally, events not containing any additional heavy-flavour jets are labelled as tt+light.¯
An additional sample to evaluate systematic uncertainties in the modelling of the t¯t+≥1b process was produced with the Powheg Box Res [67] generator and OpenLoops [68–70], using a pre-release of the implementation of this process in Powheg Box Res provided by its authors [71]. It was interfaced to Pythia8.240. The four-flavour scheme was used with the b-quark mass set to 4.95 GeV. The factorisation scale was set to 0.5×Σi=t,¯t,b,¯b,jmT,i, where mT,i = (m2i +p2T,i)1/2 and j denotes extra light quarks or gluons, the renormalisation scale was set to Qi=t,¯t,b,¯bm1/4T,i, and the hdamp parameter was set to 0.5×Σi=t,t,b,¯ ¯bmT,i.
All generatedt¯tsamples assume a diagonal Cabibbo-Kobayashi-Maskawa matrix, thus neglecting t¯t events with rare W → cb decays. Since such decays mimic the expected topology of the H±→cb signal, dedicated t¯tsamples were produced, setting Vcb = 0.041.
A nominal sample was generated by using Powheg Boxv2 at NLO with the hdamp pa- rameter set to 1.5×mtop, and using MadSpin [72,73] to generate W → cb decays. The
4Thehdamp parameter is a resummation damping factor and one of the parameters that controls the matching of Powheg matrix elements to the parton shower and thus effectively regulates the high-pT
radiation against which thet¯tsystem recoils.
JHEP09(2023)004
events were interfaced to Pythia8.230 to model the parton shower, hadronisation, and underlying event. Additional samples to assess the uncertainty in the parton shower and hadronisation model and the NLO generator were produced with Powheg Boxv2 inter- faced toHerwig7.13 [email protected] interfaced to Pythia8.230.
Thet¯tsample was normalised to the cross-section prediction at next-to-next-to-leading order (NNLO) in QCD including the resummation of next-to-next-to-leading logarithmic (NNLL) soft-gluon terms calculated usingTop++2.0 [74–80]. Forppcollisions at a centre- of-mass energy of√
s= 13 TeV, this cross-section corresponds toσ(tt) = 832¯ ±51 pb using a top-quark mass of mtop = 172.5 GeV.
4.2 Signal simulation
Samples of t¯t→H±bW∓b events were generated using the Powheg Boxv2 generator at NLO with thehdamp parameter set to 1.5×mtop, and usingMadSpinandPythia8.230 to perform the top quark andH±→cbdecays and to model the parton shower, hadronisation, and underlying event. The W boson was forced to decay leptonically to all three lepton flavours. A total of 11 signal MC samples were generated with mH± ranging from 60 to 160 GeV with 10 GeV spacing; the H± boson’s total width is assumed to be 1 GeV, more than ten times smaller than the expected mass resolution. The signal samples were normalised to the same cross-section as used for the t¯tbackground sample, and assuming an arbitrary product of branching fractionsBref =B(t→H±b) ×B(H±→cb) = 1%.
4.3 Other samples
The associated production of top quarks with W bosons (tW) and single-top-quark pro- duction in thet-channel ands-channel were modelled by thePowheg Boxv2 generator at NLO in QCD using the five-flavour scheme. The tW process was modelled using the dia- gram removal scheme [81,82] to handle interference and overlap with t¯tproduction. A re- lated uncertainty was estimated by comparison with an alternative sample generated using the diagram subtraction scheme [81,82]. The events were interfaced toPythia8.230. The uncertainty due to the parton shower and hadronisation model was evaluated by comparing the nominal samples of events with samples where events generated withPowheg Boxv2 were interfaced toHerwig7.04 instead of Pythia8.230. To assess the uncertainty associ- ated with the NLO generator, the nominal samples were compared with samples generated [email protected] at NLO in QCD using the five-flavour scheme and theNNPDF2.3nlo PDF set. These events were interfaced to Pythia8.230.
For thetW channel single-top-quark process, the inclusive cross-section was normalised to the theory prediction calculated at NLO in QCD with NNLL soft-gluon corrections [83, 84]. The inclusive cross-section for t-channel and s-channel single-top-quark production was calculated at NLO in QCD withHathor2.1 [85,86].
The V+jets (V =W, Z) and the diboson (W W,W Z, ZZ) production was simulated with the Sherpa2.2.1 or 2.2.2 generator [87] depending on the process. The simulation of V+jets used the NLO matrix elements for up to two partons, and leading-order (LO) matrix elements for up to four partons, calculated with the Comix [88] and OpenLoops libraries. The diboson samples, including fully leptonic final states and semileptonic final
JHEP09(2023)004
states, where one boson decays leptonically and the other hadronically, were generated using matrix elements at NLO accuracy in QCD for up to one additional parton and at LO accuracy for up to three additional parton emissions; off-shell effects and Higgs boson contributions are accounted for, where appropriate. The calculations were matched with the Sherpa parton shower [89] using the MEPS@NLO prescription [90–93], The NNPDF3.0nnloset of PDFs was used for the matrix-element calculation, along with the dedicated set of tuned parton-shower parameters developed by the Sherpa authors. The V+jets samples were normalised to a NNLO prediction [94].
The production of t¯tH events was modelled using the Powheg Boxv2 generator at NLO. The events were interfaced to Pythia8.230. The impact of using a dif- ferent parton shower and hadronisation model was evaluated by showering the nomi- nal hard-scatter events with Herwig7.04. To assess the uncertainty associated with the NLO generator, the nominal samples were compared with samples generated with [email protected] at NLO in QCD using the five-flavour scheme and the NNPDF2.3nlo PDF set; these events were interfaced to Pythia8.230. The t¯tH cross-section was calculated at NLO QCD and NLO electroweak accuracies using Mad- Graph5_aMC@NLO as reported in ref. [95].
The production of t¯tV and tHq events was modelled at NLO using the Mad- [email protected] generator interfaced to Pythia8.210.
The production oftZqevents was modelled using [email protected] generator at LO. The events were interfaced to Pythia8.210. ThetZq total cross-section was calculated at NLO using [email protected] with the NNPDF3.0nlo PDF set.
5 Analysis strategy
This section presents an overview of the analysis strategy developed for the H± → cb search; it closely follows that of similar searches performed previously by ATLAS [66,96].
5.1 Event categorisation
This search targets the production of a charged Higgs boson via top-quark-pair decay, t¯t → H±bW∓b, followed by the decays H± → cb and W∓ → `ν, where ` denotes an electron or muon.5 The resulting signal event topology is characterised by four jets in the final state, three of them originating from b-quarks and one from a c-quark, which can be effectively exploited to suppress the background. Additional jets can also be present because of initial- or final-state radiation.
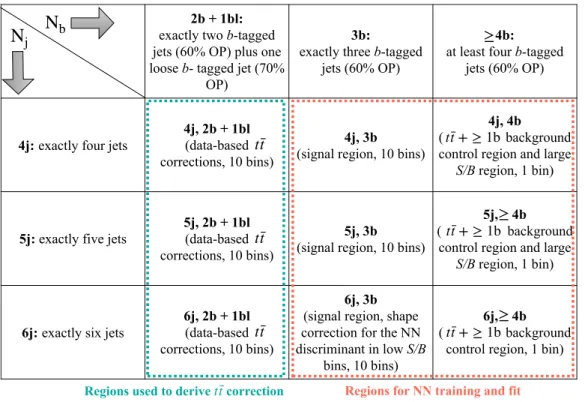
In order to maximise the sensitivity of the search, the preselected events are cate- gorised into different analysis regions depending on the number of jets (4, 5 and 6) and on the number of b-tagged jets (3 and ≥4); they are summarised in figure 2. Events with two b-tagged jets are retained only if they have an additional b-tagged jet selected with
5The small additional signal acceptance from leptonicτ-lepton decays arising from theW-boson decay is also taken into account.
JHEP09(2023)004
a looser requirement: they satisfy the 70% OP but fail the nominal (i.e. 60%) OP (de- noted 2b+1bl). Therefore, a total of nine analysis regions are considered: (4j, 2b+1bl), (5j, 2b+1bl), (6j, 2b+1bl), (4j, 3b), (5j, 3b), (6j, 3b), (4j, 4b), (5j, ≥4b) and (6j, ≥4b), where (nj, mb + kbl) indicates n selected jets, among which m and k are b-tagged with the nominal and loose b-tagging requirements, respectively; event categories with at least three b-tagged jets passing the 60% OP are used in the statistical analysis and thus are referred to as “fit regions”.
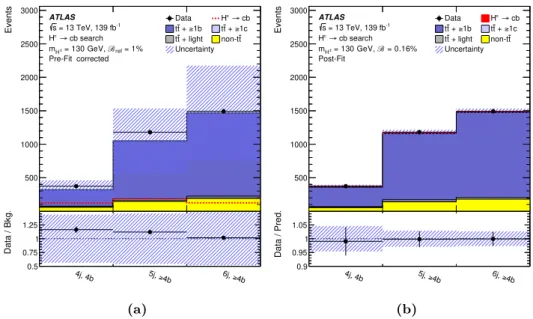
As explained in section 5.2, the 2b+1bl regions are used to derive data-based cor- rections to improve the modelling of the t¯t background. The definition of these analysis regions ensures a background composition as close as possible to what is expected in fit regions with three b-tagged jets. The main signal regions are (4j, 3b) and (5j, 3b); for B= 0.1%, the signal purity in these regions can reach a maximum value over the explored mH± range of 2.8% for the former and 1.9% for the latter. The (6j, 3b) region has lower signal purity, below 1.3% forB= 0.1%, and it is used mainly to constrain the background modelling uncertainties via a profile-likelihood fit (see section 7). Finally, the (5j, ≥4b) and (6j, ≥4b) regions offer a clean control sample to calibrate the t¯t+≥1b background, while data belonging to the (4j, 4b) region are used to recover acceptance for signal events with a c-quark misidentified as a b-jet.
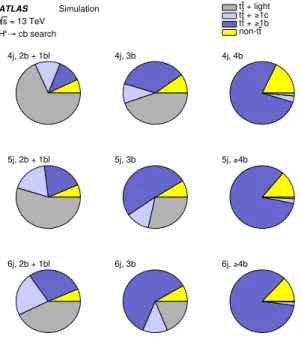
Figure 3 shows the fractions of the different background components in the analysis regions. In all regions, t¯t production is the main source of SM background; it accounts for more than 80% of the expected background. The t¯t background composition depends on the jet and b-jet multiplicities. Analysis regions that include a 2b+1bl requirement have a background composition consisting of up to 62% tt+light and up to 28%¯ t¯t+≥1b, with an increasing fraction of t¯t+≥1b at higher jet multiplicity. The fit regions with a 3b requirement have higher fraction oftt+≥1b background, up to 61%. Most of the¯ t¯t+light background events in these regions have ab-taggedc-jet from the hadronicW-boson decay, in addition to the two b-jets from the top-quark decays. The background in regions with the≥4b requirement is mostlytt+≥1b. The¯ t¯t+≥1c and other backgrounds are small in all analysis regions; thet¯t+≥1c background mostly populates the 2b+1bl regions, accounting for up to 22% of the expected SM background contribution. Non-t¯tproduction contributes up to 13% in any analysis region.
5.2 t¯t modelling
The main background for this search originates fromt¯tproduction in association with jets.
It was observed that thet¯tsimulation does not provide a fully satisfactory description of the jet multiplicity and transverse energy distributions in data; this motivates the introduction of a data-based approach to correct the t¯t simulation, similar to that developed in recent ATLAS searches [46,97].
The data and the SM prediction are compared in the 2b+1bl regions separately for events with four, five or six jets. In these three analysis regions, independent corrections for the t¯t simulation are derived as a function of HTall, which is defined as the scalar sum of the transverse momenta of all selected objects in the event and ETmiss.
JHEP09(2023)004
2b + 1bl:
exactly two b-tagged jets (60% OP) plus one loose b- tagged jet (70%
OP)
3b:
exactly three b-tagged jets (60% OP)
4b:
at least four b-tagged jets (60% OP)
4j:exactly four jets
4j, 2b + 1bl (data-based corrections, 10 bins)
4j, 3b (signal region, 10 bins)
4j, 4b ( background control region and large
S/B region, 1 bin)
5j: exactly five jets
5j, 2b + 1bl (data-based corrections, 10 bins)
5j, 3b (signal region, 10 bins)
5j, 4b ( background
control region and large S/B region, 1 bin)
6j: exactly six jets
6j, 2b + 1bl (data-based corrections, 10 bins)
6j, 3b (signal region, shape correction for the NN discriminant in low S/B
bins, 10 bins)
6j, 4b ( background
control region, 1 bin)
N
jN
bRegions for NN training and fit Regions used to derive correctiont¯t
≥
≥
≥ t¯t+≥1b t¯t
t¯t
t¯t
tt¯+≥1b
tt¯+≥1b
Figure 2. Summary of the analysis regions along with information about their usage, as described in the text. Theb-tagging selection is based on the DL1r algorithm’s 60% efficiency OP.
ATLAS Simulation = 13 TeV
s cb search
→ H
+ light t t
≥1c + t t
≥1b + t t
t non-t
4j, 2b + 1bl 4j, 3b 4j, 4b
5j, 2b + 1bl 5j, 3b 5j, ≥4b
6j, 2b + 1bl 6j, 3b 6j, ≥4b
Figure 3. Fractional contributions of the various processes to the total background prediction in each analysis region. The small contributions fromt¯tV,t¯tH, single-top-quark,W/Z+jets, diboson, tHq and tZq backgrounds are combined into a single background source referred to as “non-tt”.¯ The predictions for the various background contributions are obtained through the simulation as described in section4.
JHEP09(2023)004
The correction factor in a given HTall bin (HTall,i) and jet multiplicity region (ji) is defined as
C(HTall,i, ji) = Ndata(HTall,i, ji)−Nnon-t¯t(HTall,i, ji) Nt¯t(HTall,i, ji)
where Ndata(HTall,i, ji), Nnon-tt¯(HTall,i, ji) and Ntt¯(HTall,i, ji) represent respectively the yields observed in data, and the predicted non-t¯tandt¯tyields in theHTall bin and jet mul- tiplicity under consideration. The non-t¯tyields include the small contributions from t¯tV, t¯tH, single-top-quark,W/Z+jets, diboson,tHqandtZqbackgrounds. The fraction of sub- tracted non-tt¯background is about 7.1% in the (4j, 2b+1bl) region, 6.4% in the (5j, 2b+1bl) region, and 6.4% in the (6j, 2b+1bl) region. In all jet multiplicities, the derived corrections are close to unity for HTall above 800 GeV, and increase monotonically towards lower HTall values, reaching 1.2 for HTall = 200 GeV. The corrections are parameterised as a function of HTall in each jet multiplicity bin using rational functions of varying degree. A possible signal contamination in the 2b+1bl regions would mostly result in a normalisation offset for thet¯tprediction, smaller than 1.5%, due to the similarity of the t¯tbackground and signal HTall distribution shapes. Such an effect is fully absorbed by the systematic uncertainties of the t¯tprediction and has a numerically negligible impact on the signal extraction.
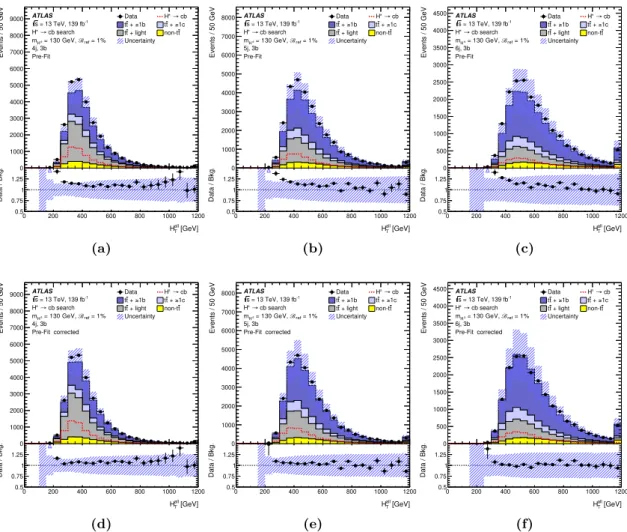
It was verified that after the inclusion of the data-basedt¯tcorrections there is a consis- tently better agreement between data and the SM prediction in all analysis regions and for a wide range of observables. Figure 4 compares the HTall distribution of data events with that of the background prediction before and after applying the data-based correction to thet¯tbackground simulation in analysis regions with threeb-tagged jets that contain events not used to derive thet¯tcorrections. An improved agreement between the background pre- diction and data is observed, despite the fact that the correction was derived in a region with substantially lower tt+≥1c and¯ tt+≥1b fractions (see figure¯ 3). This demonstrates the appropriateness of applying these corrections to all t¯t components (t¯t+light, t¯t+≥1c, and t¯t+≥1b) in the simulation. To account for residual differences in their modelling, the associated systematic uncertainties are treated as uncorrelated between the three t¯t components (see section 6.3).
5.3 Neural network discriminant
A feed-forward neural network is used to separate the H± signal from the large SM back- ground. The neural network input layer receives kinematic information about reconstructed objects, invariant masses of jet-pair permutations, and pseudo-continuousb-tagging scores, for a total of 29 input variables, summarised in table1. The selected jets are initially sorted according to their pseudo-continuous b-tagging scores. For jets with degenerate b-tagging scores a pT ordering is applied. After the jet ordering, the fourth jet in signal events is expected to originate from the charm-quark produced in the H± decays. The neural network uses the pT, η and φ of the first six sorted jets along with the b-tagging score for the fourth, fifth and sixth jets.6 These kinematic distributions and their correlations
6The input variables corresponding to the fifth (sixth) jet are set to zero in the case of events with only four (five) jets.
JHEP09(2023)004
0 200 400 600 800 1000 1200
[GeV]
all
HT 0.5
0.75 1 1.25
Data / Bkg. 0
1000 2000 3000 4000 5000 6000 7000 8000 9000
Events / 50 GeV
ATLAS = 13 TeV, 139 fb-1
s cb search
→ H
mH± = 130 GeV, ℬref = 1%
4j, 3b Pre-Fit
Data H→ cb
≥1b + t
t tt + ≥1c + light t
t non-tt
Uncertainty
(a)
0 200 400 600 800 1000 1200
[GeV]
all
HT 0.5
0.75 1 1.25
Data / Bkg. 0
1000 2000 3000 4000 5000 6000 7000 8000
Events / 50 GeV
ATLAS = 13 TeV, 139 fb-1
s cb search
→ H
mH± = 130 GeV, ℬref = 1%
5j, 3b Pre-Fit
Data H→ cb
≥1b + t
t tt + ≥1c + light t
t non-tt
Uncertainty
(b)
0 200 400 600 800 1000 1200
[GeV]
all
HT 0.5
0.75 1 1.25
Data / Bkg. 0
500 1000 1500 2000 2500 3000 3500 4000 4500
Events / 50 GeV
ATLAS = 13 TeV, 139 fb-1
s cb search
→ H
mH± = 130 GeV, ℬref = 1%
6j, 3b Pre-Fit
Data H→ cb
≥1b + t
t tt + ≥1c + light t
t non-tt
Uncertainty
(c)
0 200 400 600 800 1000 1200
[GeV]
all
HT 0.5
0.75 1 1.25
Data / Bkg. 0
1000 2000 3000 4000 5000 6000 7000 8000 9000
Events / 50 GeV
ATLAS = 13 TeV, 139 fb-1
s cb search
→ H
mH± = 130 GeV, ℬref = 1%
4j, 3b Pre-Fit corrected
Data H→ cb
≥1b + t
t tt + ≥1c + light t
t non-tt
Uncertainty
(d)
0 200 400 600 800 1000 1200
[GeV]
all
HT 0.5
0.75 1 1.25
Data / Bkg. 0
1000 2000 3000 4000 5000 6000 7000 8000
Events / 50 GeV
ATLAS = 13 TeV, 139 fb-1
s cb search
→ H
mH± = 130 GeV, ℬref = 1%
5j, 3b Pre-Fit corrected
Data H→ cb
≥1b + t
t tt + ≥1c + light t
t non-tt
Uncertainty
(e)
0 200 400 600 800 1000 1200
[GeV]
all
HT 0.5
0.75 1 1.25
Data / Bkg. 0
500 1000 1500 2000 2500 3000 3500 4000 4500
Events / 50 GeV
ATLAS = 13 TeV, 139 fb-1
s cb search
→ H
mH± = 130 GeV, ℬref = 1%
6j, 3b Pre-Fit corrected
Data H→ cb
≥1b + t
t tt + ≥1c + light t
t non-tt
Uncertainty
(f)
Figure 4. Comparison between the data and prediction for theHTall distribution (a-c) before and (d-f) after the inclusion of the data-basedtt¯correction (“corrected”), in regions with threeb-tagged jets prior to the likelihood fit to data (“Pre-Fit”), see section7. The small contributions fromttV¯ , ttH, single-top-quark,¯ W/Z+jets, diboson, tHq and tZq backgrounds are combined into a single background source referred to as “non-t¯t”. The expectedH±signal formH±= 130 GeV is displayed as a dashed red line normalised toBref= 1%. The bottom panels display the ratios of data to the SM background prediction (“Bkg.”) before the likelihood fit. The hashed area represents the total uncertainty of the background. The last bin in all figures contains the overflow.
allow the signal to be distinguished from SM background by considering the resonances produced in the event, while theb-tagging scores are effective in distinguishing the threet¯t background components (t¯t+light, tt+≥1b and¯ t¯t+≥1c) from the signal. The pT, η, and φof the lepton, as well as ETmiss and itsφangle, are also included to fully characterise the event kinematics. Finally, three dijet invariant masses correlated with mH± are obtained by calculating the invariant mass of each of the three leading jets and the fourth jet; the inclusion of these invariant mass distributions improves the neural network’s separation of signal from background by about 20%.
JHEP09(2023)004
Input variables Number of variables
pT,η, andφof the first six leading jets 18
b-tagging score of the fourth, fifth, and sixth jets 3
LeptonpT,η, andφ 3
Missing transverse energy and itsφangle 2
Invariant mass between each of the three leading jets and the fourth jet 3
Total 29
Table 1. List of input variables used in the neural network training. Jets are sorted according to their pseudo-continuousb-tagging scores, followed by theirpT, in case of having the same score.
0 0.1 0.2 0.3 0.4 0.5 0.6 0.7 0.8 0.9 1
NN Score 0
0.1 0.2 0.3 0.4 0.5
Fraction of events / 0.1
Simulation ATLAS
search b c +→ H
=13 TeV s 4j, 3b
70 GeV H
=70 GeV) H
Total background (at m 130 GeV H
=130 GeV) H
Total background (at m
(a)
0 0.1 0.2 0.3 0.4 0.5 0.6 0.7 0.8 0.9 1
NN Score 0
0.05 0.1 0.15 0.2 0.25 0.3 0.35
Fraction of events / 0.1
Simulation ATLAS
search b c +→ H
=13 TeV s 5j, 3b
70 GeV H
=70 GeV) H
Total background (at m 130 GeV H
=130 GeV) H
Total background (at m
(b)
0 0.1 0.2 0.3 0.4 0.5 0.6 0.7 0.8 0.9 1
NN Score 0
0.05 0.1 0.15 0.2 0.25 0.3 0.35 0.4
Fraction of events / 0.1
Simulation ATLAS
search b c +→ H
=13 TeV s 6j, 3b
70 GeV H
=70 GeV) H
Total background (at m 130 GeV H
=130 GeV) H
Total background (at m
(c)
Figure 5. Comparison of the distributions of the NN score of the H± signal with mH± = 70 GeV (red dashed) and mH± = 130 GeV (red solid), and the total SM background evaluated at the same masses (black dashed and black solid, respectively) in the analysis regions (a) (4j, 3b), (b) (5j, 3b), and (c) (6j, 3b). Each NN score distribution is normalised to unit area.
The neural network input layer is followed by fully connected hidden layers using rectified-linear-unit activation functions; a sigmoid function is then used in the output layer.
Batch normalisation [98] is applied before each hidden layer. The training uses the Adam optimiser [99] in combination with four-fold cross-training [100], which provides orthogonal data samples for the optimisation of the neural network hyperparameters. The best hyper- parameter configuration includes 2 layers and 190 neurons. The impact of overtraining is mitigated with the “dropout” [101] method in combination with the “MaxNorm” constraint.
The neural network is trained by using events with exactly four, five or six jets, and at least three b-tagged jets, corresponding to the analysis regions with highest signal purity.
The training also includes the value of themH±parameter, which for signal events is defined to be the true mass of the signal sample. In the case of background events, a random value of the H± mass, taken from the fraction of signal masses in the input dataset, is assigned to each event [102]. In addition to increasing the size of the training sample, the use of a mass-parameterised neural network allows the different signals to be differentiated.
Figure 5 compares the distributions of the neural network output score (“NN score”) of theH± signal, formH± = 70 GeV andmH± = 130 GeV, and the total SM background in the three most sensitive regions, (4j, 3b), (5j, 3b) and (6j, 3b).
JHEP09(2023)004
6 Systematic uncertainties
Several sources of systematic uncertainty can affect the normalisation of the signal and backgrounds, as well as the shape of their corresponding NN scores distributions. Each source of systematic uncertainty is considered to be uncorrelated with the other sources.
Correlations for a given systematic uncertainty are maintained across processes and event categories, unless explicitly otherwise stated. The following sections describe the considered systematic uncertainties.
6.1 Luminosity and pile-up
The uncertainty in the measurement of the integrated luminosity of the used dataset is 1.7% [29]; it affects the overall normalisation of all processes estimated from the simulation.
The uncertainty is derived using the LUCID-2 detector for the baseline luminosity mea- surements [30], from a calibration of the luminosity scale using x-ybeam-separation scans.
An uncertainty is assigned to the modelling of pile-up in simulation to account for differences between the predicted and measured inelastic cross-sections in a given fiducial volume [103].
The uncertainties in the luminosity measurement and pile-up modelling are treated as being correlated across the analysis regions and all physics processes.
6.2 Object reconstruction
Uncertainties associated with electrons and muons arise from the trigger, reconstruction, identification and isolation efficiencies, as well as the momentum scale and resolution [31, 32, 35, 36]. They are measured using data enriched in Z → `+`− and J/ψ → `+`− events (` = e, µ). Uncertainties in jet measurements arise from the jet energy scale and resolution, and the efficiency to pass the jet-vertex-tagger requirements [42, 104]. The largest contribution comes from the jet energy scale, the uncertainty of which is split into 29 uncorrelated components, and depends on jet pT and η, jet flavour, pile-up treatment, and simulation of the hadronic shower shape. The jet energy scale is calibrated with a series of simulation-based corrections and measurements in data samples enriched in photon or Z boson production in association with jets or in multijet production.
Uncertainties associated with energy scales and resolutions of leptons and jets are prop- agated to the ETmiss reconstruction. Additional uncertainties affecting the reconstruction of low-energy particles present in the event, not associated with any leptons or jets, are measured in Z →`+`− data by studying the recoil of the Z boson [44].
Efficiencies to tag jets in the simulation are corrected to match the efficiencies measured in data by applyingpT-dependent factors. Theb-jet efficiencies andc-jet mis-tagging rates are measured in a data sample enriched intt¯events [105,106], while the light-jet mis-tagging rates are measured in a multijet data sample enriched in light-jets [107]. Uncertainties affecting b-, c-, and light-jet efficiencies or mis-tagging rates are decomposed into 45, 15 and 20 uncorrelated components, respectivly.
All uncertainties affecting object reconstruction are treated as being correlated across the analysis regions and all physics processes, including signal.
JHEP09(2023)004
6.3 t¯t background modelling
The systematic uncertainties assigned to thet¯tbackground are designed to cover potential mismodelling of this background as a function of jet and b-jet multiplicities. Since the diagrams that contribute to t¯t+≥1b, t¯t+≥1c, and t¯t+light processes are different, their associated uncertainties are treated as being uncorrelated from each other, unless otherwise stated.
Uncertainties associated with the choice of matrix-element generator and parton shower and hadronisation models are obtained by comparing the nominaltt¯sample with alternative samples described in section 4. These uncertainties are evaluated in a consistent way by first putting the alternative t¯tsamples through the same data-based correction procedure utilised to correct the nominal t¯tsample (section 5.2). The t¯t modelling uncertainties are then evaluated by comparing the alternativet¯tsamples with the nominal samples, both sets having had the data-based correction applied. These uncertainties are also decorrelated between different jet multiplicity regions.
The uncertainty due to initial- and final-state radiation (ISR/FSR) was estimated by varying the parameters of the A14 parton shower tune [108] as described in ref. [97].
Uncertainties accounting for missing higher-order QCD corrections in the matrix-element calculation are estimated by varying the renormalisation and factorisation scales in Powheg Boxv2 independently by factors of 2 and 0.5 relative to the nominal scales choice.
Uncertainties due to higher-order QCD corrections and ISR/FSR modelling are treated as being correlated between different jet multiplicity regions.
A normalisation uncertainty of 50% is assumed separately for t¯t+≥1b and t¯t+≥1c.
Fortt+≥1c, the uncertainty choice is conservative given the ability to determine this back-¯ ground from data and the very limited sensitivity of the final results to this choice. In the case oft¯t+≥1b, this choice is motivated by the observed level of disagreement between data and prediction for this background [109].
Systematic uncertainties in the data-based t¯tcorrections arise from the statistical un- certainty in the parameterisation of the correction factors and subtraction of the non-t¯t backgrounds. These uncertainties are uncorrelated between each jet multiplicity but cor- related across t¯t+≥1b, tt+≥1c and¯ tt+light background components.¯
The background originating fromt¯tevents with aW boson decaying into a charm quark and bottom quark was modelled with dedicated samples of simulated events. Uncertainties from the NLO generator choice, as well as from the parton shower and hadronisation mod- els, for this subset oft¯tevents are estimated by comparing the nominal prediction with al- ternative events generated as discussed in section4. An additional cross-section uncertainty for this process is assigned by combining in quadrature a 6% uncertainty in the inclusive t¯tproduction cross-section [80] with a 3% uncertainty in the Vcb measurements [110].
6.4 Signal modelling
Several normalisation and shape uncertainties are taken into account for the H± signal.
Since the signal samples were produced with the same generator and settings as the t¯t background, no alternative signal samples have been generated. Instead, the uncertainties
JHEP09(2023)004
for thett+light background associated with the choice of matrix-element generator, parton¯ shower and hadronisation models, as well as due to ISR/FSR, are also assigned to the signal.
In addition, the uncertainty in the tt¯inclusive cross section is taken into account. These uncertainties are taken to be correlated with the tt+light background and uncorrelated¯ across jet multiplicity regions. Signal modelling uncertainties have a negligible impact on the final result.
6.5 Modelling of other backgrounds
Uncertainties affecting the modelling of the single-top-quark background include a +5%/−4% uncertainty in the total cross-section, estimated as a weighted average of the theoretical uncertainties in t-, W t- and s-channel production [83,111,112]. Uncertainties associated with the choice of NLO generator and parton shower and hadronisation model are evaluated by using alternative samples introduced in section 4. The uncertainty in the ISR and FSR modelling was estimated with the same procedure deployed to evaluate the corresponding source for the tt¯background.
Uncertainties affecting the normalisation of the W+jets and Z+jets backgrounds are estimated for the sum of both contributions (denoted V+jets). Agreement between data and the total background prediction is found to be within approximately 40% [113], which is taken to be the total normalisation uncertainty correlated across all V+jets subprocesses.
An additional 25% uncertainty is added in quadrature to the inclusive 40% uncertainty for each additional jet beyond the fourth [114]; this procedure results in 47% and 52%
uncertainties in regions with five or six jets, respectively.
Uncertainties in the diboson background normalisation include 5% from the NLO the- ory cross-sections [115]. Similarly to the V+jets background, an additional 25% normali- sation uncertainty is added in quadrature for each additional jet, assuming that at leading order the diboson background contributes two jets from the decay of one of the vector bosons. Therefore, the total normalisation uncertainty is 36%, 44%, and 50% for events with four jets, five jets or six jets, respectively. These uncertainties are comparable to the level of disagreement found between the measured differential cross-section for W Z production as a function of jet multiplicity and that predicted by the simulation [116].
For both diboson and V+jets backgrounds, additional shape uncertainties are neglected compared to the large assigned normalisation uncertainties, which in turn have a negligible impact on the final result.
Modelling uncertainties for t¯tH production were evaluated by comparing the nominal sample with alternative samples introduced in section 4. The cross-section uncertainty for t¯tH production was estimated to be +9%/−12% [95].
The uncertainty in the ttV¯ andtZqcross-sections is estimated to be 60% based on the observed level of disagreement between data and predictions [117, 118]. The uncertainty in the tHq cross-sections is conservatively assumed to be 50%. These backgrounds have negligible impact on the results.
JHEP09(2023)004
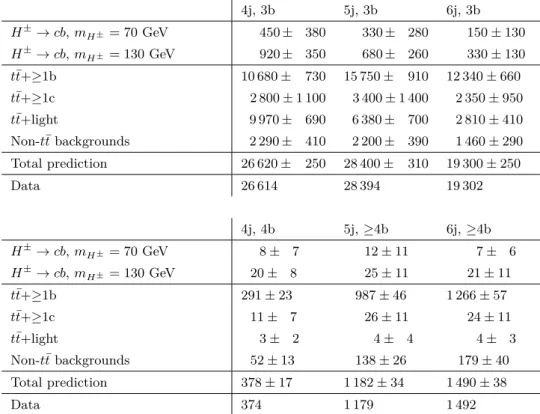
7 Results
To test for the presence of a signal, a joint analysis of the NN score distributions in regions with three b-jets and the total yields in regions with four or moreb-jets is performed. The NN score is binned in ten bins in all analysis regions with three b-jets. The statistical analysis uses a binned likelihood function L(µ,θ<