JHEP10(2023)001
Published for SISSA by Springer
Received:May 26, 2023 Accepted: September 2, 2023 Published: October 2, 2023
Search for leptoquarks decaying into the bτ final state in pp collisions at √
s = 13 TeV with the ATLAS detector
The ATLAS collaboration
E-mail: [email protected]
Abstract: A search for leptoquarks decaying into the bτ final state is performed using Run 2 proton-proton collision data from the Large Hadron Collider, corresponding to an integrated luminosity of 139 fb−1 at √
s = 13 TeV recorded by the ATLAS detector. The benchmark models considered in this search are vector leptoquarks with electric charge of 2/3e and scalar leptoquarks with an electric charge of 4/3e. No significant excess above the Standard Model prediction is observed, and 95% confidence level upper limits are set on the cross-section times branching fraction of leptoquarks decaying into bτ. For the vector leptoquark production two models are considered: the Yang-Mills and Minimal coupling models. In the Yang-Mills (Minimal coupling) scenario, vector leptoquarks with a mass below 1.58 (1.35) TeV are excluded for a gauge coupling of 1.0 and below 2.05 (1.99) TeV for a gauge coupling of 2.5. In the case of scalar leptoquarks, masses below 1.28 (1.53) TeV are excluded for a Yukawa coupling of 1.0 (2.5). Finally, an interpretation of the results with minimal model dependence is performed for each of the signal region categories, and limits on the visible cross-section for beyond the Standard Model processes are provided.
Keywords: Beyond Standard Model, Hadron-Hadron Scattering
ArXiv ePrint: 2305.15962
JHEP10(2023)001
Contents
1 Introduction 1
2 The ATLAS detector 4
3 Data and Monte Carlo samples 5
4 Object reconstruction and identification 7
5 Event selection 9
6 Background estimation 11
6.1 τlepτhad channel 11
6.2 τhadτhad channel 15
7 Systematic uncertainties 18
8 Results 20
9 Conclusion 25
The ATLAS collaboration 35
1 Introduction
The existing similarities between the structure of the quark and lepton sectors in the Standard Model (SM) suggest the possibility of a new underlying symmetry in particle physics. Leptoquarks (LQs) that couple to both quarks and leptons, with non-zero baryon and lepton numbers, and fractional electric charges are predicted by several beyond the SM theories that attempt to unify the fundamental interactions, such as technicolour [1–3], composite models [4], and grand unification [5–7].
Recent results reported by BaBar [8,9], Belle [10] and LHCb [11] show hints of devia- tions from lepton-flavour universality inB-meson decays into final states withD(∗)mesons, which could be caused by the existence of LQs. The 4.2 standard deviation disagreement with respect to the SM prediction observed in the anomalous muon magnetic moment measurement [12], though significantly reduced when updated lattice quantum chromody- namics (QCD) calculations [13] are considered, could be caused by LQ contributions to the muon magnetic moment [14].
In light of the lepton-flavour universality anomalies observed in the B-meson decays into D(∗)τ ν final states, the couplings of LQs to third-generation quarks and leptons are expected to be large [15]. At the LHC, third-generation LQs can be produced singly via quark-gluon fusion and quark-gluon scattering or in pairs via the gluon-gluon fusion process, as shown in the Feynman diagrams in figure1. The search presented in this paper is optimised for the single production of third-generation LQ via the bg → LQτ → bτ τ channel, while LQ pair and non-resonant production processes are also considered since they can also contribute to the bτ τ final state. The single LQ production contribution
JHEP10(2023)001
(a) (b)
(c) (d)
Figure 1. Illustrative Feynman diagrams of (a), (b) single LQ production, (c) non-resonant LQ production, and (d) LQ pair production.
becomes larger than that from LQ pair production at high LQ mass and coupling values.
The results are obtained from proton-proton collision data at a centre-of-mass energy of
√s = 13 TeV collected by the ATLAS detector [16, 17] at the LHC [18] during Run 2
between 2015 and 2018, corresponding to a total integrated luminosity of 139 fb−1. The vector LQ model chosen for this search is the U1 model [19], a SU(2)L singlet with fermion numberF = 3B+L= 0, whereB and Lare the baryon and lepton numbers respectively, and an electric charge of 2/3e. The interaction part ofU1model Lagrangian is:
LU
1 ⊃ −igs(1−κ)U1µ† TaU1νGaµν+ gU
√2[U1µ(βLijq¯LiγµℓjL+βRijd¯iRγµejR) + h.c.],
where Ta = λa/2 with λa (a = 1,· · ·,8) are the Gell-Mann matrices, gs is the QCD coupling, qL (ℓL) denotes the left-handed quark (lepton) doublets anddR (eR) denotes the right-handed down-type quark (charged-lepton) singlets. The i and j indices represent the flavour generation. A summation over the colour indices is performed and omitted for clarity. The term −igs(1−κ)U1µ† TaU1νGaµν describes the interaction between U1 leptoquarks and SM gluon gauge fields Gaµν. In this analysis, two vector LQ scenarios are considered: the Yang-Mills (U1YM) coupling scenario, κ = 0, and the Minimal (U1MIN) coupling scenario, κ = 1. The βLij and βRij parameters describe the coupling between U1 leptoquarks and left-handed or right-handed charged leptons and quarks, respectively. In the framework of the U1YM and U1MIN scenarios, the probability to decay into theb-quark and τ-lepton final state is predicted to be the same as to decay into the top-quark and neutrino final state. Hence, the branching fractionBof the LQ decays into ab-quark and a
JHEP10(2023)001
τ-lepton is set to 0.5. In this search, all ofβRij are set to zero,βL33is set to one and otherβLij are set to zero, such that each LQ decays into a b-quark and aτ-lepton or into a top-quark and a neutrino. Due to these choices, the gauge coupling (λ) between U1 leptoquarks and third-generation charged leptons and quarks can be written as λ=gUβL33/√
2.
The scalar LQ model Sf1 is also considered, withF = 3B+L=−2 and electric charge of 4/3e[20,21]. There are three parameters in this model: the branching fraction B into charged leptons, the LQ to τ b Yukawa coupling parameter λ, and the mass term of the LQ. Following ref. [21], the Lagrangian terms for Sf1 LQs related to this analysis are:
L
Se1 ⊃+λijd¯CiR Sf1ejR+ h.c.,
where C in the superscript stands for the charge conjugation operation. The terms eR and dR are the right-handed charged leptons and down-type quarks and λij represents the Yukawa couplings between Sf1, charged leptons, and quarks, where the ij refers to the generations of the quark and charged lepton. In the framework of the Sf1 model, the only non-zero Yukawa coupling considered in this paper is the coupling to a b-quark and a τ-lepton. Since only the coupling to the third-generation charged lepton and quark is considered, λ33 =λis assumed to be different from zero, while the rest of the λij are set to zero.
Most of the previous searches for LQs performed by the ATLAS [22–28] and CMS [29–
32] collaborations have been conducted on different final states compared to this search.
For third generation LQs, the CMS collaboration has recently published results of searches for LQs decaying into tν and bτ [33]. The ATLAS collaboration performed a search for pair produced scalar LQs in bτ bτ final states with 36 fb−1 of proton-proton collision data at√
s= 13 TeV that excluded scalar LQs with masses below 1 TeV, assuming a LQ to bτ branching fraction equal to one [34].
The analysis described in this paper is the first search by the ATLAS collaboration for singly produced LQs decaying into bτ. The search is performed over a LQ mass (mLQ) in the range of 0.4 TeV to 2.5 TeV. The λ range is chosen to be between 0.5 and 2.5 to cover possible regions where LQs could explain the anomalies observed in the B-meson decay and is extended to largeλwhere the single LQ production channel provides a signif- icant contribution compared to the pair-production process. In the case of the vector LQ production, the contribution from LQs decaying into tν is neglected.
The analysis starts from the selection of a pair of oppositely chargedτ-leptons produced in association with a jet identified as containing ab-hadron (b-jet). The main backgrounds to the search are the t¯t and tW production processes. Two signatures are considered, containing either aτlepτhad orτhadτhad pair, whereτhad (τlep) refers to aτ-lepton decaying into hadrons and a neutrino (two neutrinos and an electron or a muon). In each of these two analysis channels, events are classified, based on the transverse momentum (pT) of the b-jet, in two categories of low and high b-jet pT. The search for LQs is only performed in the high b-jet pT category, where the effect from the interference of non-resonant LQ production with SM processes is expected to be small [35]. The non-resonant contribution can be significantly modified by the interference contribution, which depends on the signal model parameters [35,36]. The effect of the interference with SM diagrams, such as those
JHEP10(2023)001
fromZ/γ∗(→τ τ)+b-jet, is neglected. Due to the lack of detailed studies of the interference effect, an additional search is performed considering both high and low b-jetpT categories and not relying on a specific LQ model choice for its signal description (henceforth called
‘model-independent’), and covering a wider range of beyond-SM signatures. For this search, the results are expressed in terms of the visible cross-section of the beyond-SM signal.
The next sections discuss the ATLAS detector in section2, data and simulated samples in section 3, followed by the object reconstruction and definitions in section 4. Section 5 discusses the overall analysis strategy and event selection, then section 6 goes into more details of the background estimation methods. The systematic uncertainties are discussed in section 7followed by the results in section 8, with the conclusion in section 9.
2 The ATLAS detector
The ATLAS detector [16] at the LHC covers nearly the entire solid angle around the colli- sion point.1 It consists of an inner tracking detector surrounded by a thin superconducting solenoid, electromagnetic and hadron calorimeters, and a muon spectrometer incorporating three large superconducting air-core toroidal magnets.
The inner-detector system (ID) is immersed in a 2 T axial magnetic field and provides charged-particle tracking in the range of |η| < 2.5. The high-granularity silicon pixel detector covers the vertex region and typically provides four measurements per track, the first hit normally being in the insertable B-layer installed before Run 2 [17, 37]. It is followed by the silicon microstrip tracker, which usually provides eight measurements per track. These silicon detectors are complemented by the transition radiation tracker (TRT), which enables radially extended track reconstruction up to |η| = 2.0. The TRT also provides electron identification information based on the fraction of hits (typically 30 in total) above a higher energy-deposit threshold corresponding to transition radiation.
The calorimeter system covers the pseudorapidity range of |η|<4.9. Within the region
|η| = 3.2, electromagnetic calorimetry is provided by barrel and endcap high-granularity lead/liquid-argon (LAr) calorimeters, with an additional thin LAr presampler covering
|η| < 1.8 to correct for energy loss in material upstream of the calorimeters. Hadron calorimetry is provided by the steel/scintillator-tile calorimeter, segmented into three barrel structures within |η| = 1.7, and two copper/LAr hadron endcap calorimeters. The solid angle coverage is completed by forward copper/LAr and tungsten/LAr calorimeter modules optimised for electromagnetic and hadronic energy measurements respectively.
The muon spectrometer (MS) comprises separate trigger and high-precision tracking chambers measuring the deflection of muons in a magnetic field generated by the supercon- ducting air-core toroidal magnets. The field integral of the toroids ranges between 2.0 and 6.0 T m across most of the detector. A set of precision chambers covers the region|η|<2.7
1ATLAS uses a right-handed coordinate system with its origin at the nominal interaction point (IP) in the centre of the detector and thez-axis along the beam pipe. Thex-axis points from the IP to the centre of the LHC ring, and they-axis points upwards. Cylindrical coordinates (r, ϕ) are used in the transverse plane,ϕbeing the azimuthal angle around thez-axis. The pseudorapidity is defined in terms of the polar angleθ asη=−ln tan(θ/2). Angular distance is measured in units of ∆R≡p
(∆η)2+ (∆ϕ)2.
JHEP10(2023)001
with three layers of monitored drift tubes, complemented by cathode-strip chambers in the forward region, where the background is highest. The muon trigger system covers the range of |η| < 2.4 with resistive-plate chambers in the barrel, and thin-gap chambers in the endcap regions.
Interesting events are selected by the first-level trigger system implemented in custom hardware, followed by selections made by algorithms implemented in software in the high- level trigger [38]. The first-level trigger accepts events from the 40 MHz bunch crossings at a rate below 100 kHz, which the high-level trigger reduces in order to record events to disk at about 1 kHz.
An extensive software suite [39] is used in data simulation, in the reconstruction and analysis of real and simulated data, in detector operations, and in the trigger and data acquisition systems of the experiment.
3 Data and Monte Carlo samples
The data were collected using unprescaled single-lepton and single τhad triggers. A more detailed description of the triggers used in the analysis for each data-taking period is given in section5. Quality criteria are applied to events to ensure that the data were not affected by any hardware- or software-related issues [40].
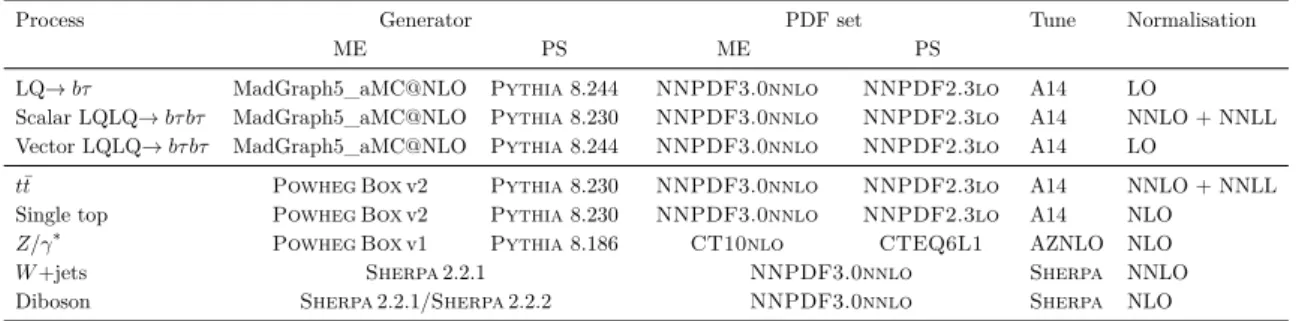
Monte Carlo (MC) simulated events of single LQs decaying into bτ were produced for masses ranging from 0.4 TeV to 2.5 TeV. The signal samples were produced at leading order (LO) in QCD in the five-flavour scheme using the [email protected] [41]
generator with the NNPDF3.0nnlo [42] parton distribution function (PDF) followed by parton shower (PS) and hadronisation with Pythia8.244 [43] using the A14 set of tuned parameters (tune) [44] and the NNPDF2.3lo PDF set. Single scalar and vector LQ signal samples were produced with coupling parameters λ from 0.5 to 2.5. The intrinsic width of the LQs increases quadratically with λand linearly as a function of mLQ. In the considered range of parameters, the LQ width is 16% or less of the LQ mass. The simulated signal events do not include interference effects with the SM processes. For the vector LQ signal two samples were produced for each λ, one with Yang-Mills coupling (κ = 0) and the other with minimal coupling (κ= 1). The implementation of the signal model is based on that described in refs. [20,21,45].
Simulated events with pair produced scalar LQs were generated at next-to-leading or- der (NLO) in QCD with [email protected], using the LQ model described in ref. [46], which adds PS to the fixed-order NLO QCD calculations [47, 48] interfaced to Pythia8.230 for the PS and hadronisation. Parton luminosities are provided by the five-flavour scheme NNPDF3.0nlo PDF set with a value of the strong coupling con- stant αs = 0.118, and the underlying event was modelled with the A14 tune. The LQ pair-production cross-sections were obtained from the calculation of direct top-squark pair production assuming that all other supersymmetric particles are heavier, since the pro- duction modes of this process are the same as the LQ pair production. The cross-sections were computed at approximate next-to-next-to-leading order (NNLO) in QCD with re- summation of next-to-next-to-leading logarithmic (NNLL) soft gluon terms [49–52]. The
JHEP10(2023)001
cross-sections do not include leptont-channel contributions, which are neglected in ref. [46]
and may lead to corrections at the percent level [53].
Simulated events with pair-produced vector LQs were generated with Mad- [email protected] at LO in QCD, using the LQ model of ref. [19] and the NNPDF3.0nlo PDF set with αs = 0.118. Decays of the LQs were performed with MadSpin, while PS and hadronisation were simulated using Pythia8.244 with the A14 tune. Since no higher-order cross-sections are available for this model, the LO Mad- Graph5_aMC@NLO cross-sections were used.
Several simulation samples are used to model the expected background processes.
These include t¯t, single top-quark, Z and W bosons produced in association with jets (Z+jets andW+jets), and diboson events.
The production oft¯tsimulated events was performed with thePowheg Boxv2 [54–57]
generator at NLO with the NNPDF3.0nlo PDF set [58] and thehdamp parameter2 set to 1.5mtop [59], with mtop = 172.5 GeV. The events were interfaced to Pythia8.230 [43]
to model the PS, hadronisation, and underlying event, with parameters set according to the A14 tune and using the NNPDF2.3lo set of PDFs. Thet¯tsample was normalised to the cross-section prediction at NNLO in QCD including the resummation of NNLL calculated using Top++2.0 [60–66].
Single top-quark s-channel (t-channel) production was simulated using the Powheg Boxv2 generator at NLO in QCD in the five-flavour (four-flavour) scheme with the NNPDF3.0nlo set of PDFs. The events were interfaced withPythia8.230 using the A14 tune and the NNPDF2.3lo PDF set. The samples were normalised to the theory prediction calculated at NLO in QCD with Hathor 2.1 [67, 68]. Similarly, the associ- ated production of top quarks withW bosons (tW) was modelled by thePowheg Boxv2 generator at NLO in QCD using the five-flavour scheme and the NNPDF3.0nlo set of PDFs. The diagram removal scheme [69] was used to remove interference and overlap with t¯t production. The related uncertainty is estimated by comparison with an alter- native sample generated using the diagram subtraction scheme [59, 69]. The events were interfaced to Pythia8.230 using the A14 tune and the NNPDF2.3lo set of PDFs.
For the production of Z/γ∗ sample, the Powheg Boxv1 [55–57, 70] generator was used for the simulation at NLO accuracy of the hard-scattering processes of Z boson production and decay into the electron, muon, and τ-lepton channels. It was interfaced to Pythia8.186 [71] for the modelling of the PS, hadronisation, and underlying event, with parameters set according to the AZNLO tune [72]. The CT10nlo PDF set [73] was used for the hard-scattering processes, whereas the CTEQ6L1 PDF set [74] was used for the PS. The effect of QED final-state radiation was simulated with Photos++3.52 [75,76].
The production ofW+jets events was generated withSherpa2.2.1 [77]. In this set-up, NLO-accurate matrix elements for up to two partons and LO-accurate matrix elements for up to four partons were calculated with the Comix [78] and OpenLoops[79–81] libraries.
The defaultSherpaPS [82] based on Catani-Seymour dipole factorisation and the cluster
2Thehdamp parameter is a resummation damping factor and one of the parameters that controls the matching ofPowhegmatrix elements to the PS and thus effectively regulates the high-pTradiation against which thett¯system recoils.
JHEP10(2023)001
Process Generator PDF set Tune Normalisation
ME PS ME PS
LQ→bτ MadGraph5_aMC@NLO Pythia8.244 NNPDF3.0nnlo NNPDF2.3lo A14 LO
Scalar LQLQ→bτ bτ MadGraph5_aMC@NLO Pythia8.230 NNPDF3.0nnlo NNPDF2.3lo A14 NNLO + NNLL Vector LQLQ→bτ bτ MadGraph5_aMC@NLO Pythia8.244 NNPDF3.0nnlo NNPDF2.3lo A14 LO
t¯t Powheg Boxv2 Pythia8.230 NNPDF3.0nnlo NNPDF2.3lo A14 NNLO + NNLL
Single top Powheg Boxv2 Pythia8.230 NNPDF3.0nnlo NNPDF2.3lo A14 NLO
Z/γ∗ Powheg Boxv1 Pythia8.186 CT10nlo CTEQ6L1 AZNLO NLO
W+jets Sherpa2.2.1 NNPDF3.0nnlo Sherpa NNLO
Diboson Sherpa2.2.1/Sherpa2.2.2 NNPDF3.0nnlo Sherpa NLO
Table 1. Overview of the MC generators used for the main signal and background samples. The last column specifies the order in QCD for the cross-section calculation used for the normalisation of the simulated samples.
hadronisation model [83] were used. They employed the dedicated set of tuned parameters developed by the Sherpa authors and the NNPDF3.0nnlo PDF set [58]. The NLO matrix elements for a given jet multiplicity were matched to the PS using a colour-exact variant of the MC@NLO algorithm [84]. Different jet multiplicities were then merged into an inclusive sample using an improved CKKW matching procedure [85,86] that is extended to NLO accuracy using theMEPS@NLO prescription [87].
Diboson production was simulated with theSherpa2.2.1 or 2.2.2 generator depending on the process. Fully leptonic final states and semileptonic final states, where one boson decays leptonically and the other hadronically, were generated using matrix elements at NLO accuracy in QCD for up to one additional parton emission and at LO accuracy for up to three additional parton emissions. Samples for the loop-induced processesgg →V V were generated using LO-accurate matrix elements for up to one additional parton emission for both the fully leptonic and semileptonic final states. The matrix element calculations were matched and merged with the Sherpa PS based on Catani-Seymour dipole factorisation using the MEPS@NLO prescription. The virtual QCD corrections were provided by the OpenLoops library. The NNPDF3.0nnlo set of PDFs were used, along with the dedicated set of tuned PS parameters developed by the Sherpa authors. The samples were normalised to a NLO prediction.
A summary of all the features used for the simulation of the signal and background processes is shown in table 1. In all samples except those produced with Sherpa2.2.1 or Sherpa2.2.2, decays of heavy-flavour hadrons were modelled with EvtGen1.2.0 or EvtGen1.6.0 program [88], depending on the process. All samples of simulated events were processed through the ATLAS detector simulation [89] based onGeant4 [90]. The effects of multiple interactions in the same and nearby bunch crossings (pile-up) were modelled by overlaying minimum-bias events simulated using the soft QCD processes of Pythia8.186 [71] with the A3 tune [91] and the NNPDF2.3lo PDF set.
4 Object reconstruction and identification
Tracks measured in the ID are used to reconstruct the interaction vertices [92]. The primary vertex of the hard interaction is chosen as the proton-proton vertex candidate with the highest sum of the squared transverse momenta of the associated tracks.
JHEP10(2023)001
Electrons are reconstructed from topological clusters of energy deposits in the elec- tromagnetic calorimeter that are matched to a track reconstructed in the ID [93]. In the τlepτhad (τhadτhad) final state, the selected (rejected) electrons are required to satisfy the
‘medium’ (‘loose’) identification criteria and have pT >20 GeV (15 GeV). Moreover, elec- trons are required to be within |ηcluster|= 2.47 with the exclusion of the region between the barrel and endcap calorimeters (1.37 < |ηcluster| < 1.52). An additional ‘loose’ iso- lation criterion [93] is also required, which has an efficiency of 90 % for candidates with pT >15 GeV, increasing to more than 98 % for candidates withpT>30 GeV.
Muons are reconstructed from signals in the MS matched with tracks inside the ID. In theτlepτhadfinal state, the selected muons are required to satisfy the ‘medium’ identification criteria with an average efficiency of 97 %, and have pT > 25 GeV and |η| < 2.5. In the τhadτhad chanel, muons having pT > 7 GeV are rejected if they satisfy the ‘loose’
identification criteria. A ‘tight’ isolation criterion [94] based on track information and having an average efficiency of 89 % is also applied.
Jets are reconstructed with a particle-flow algorithm, which combines energy deposits in the calorimeter with ID tracks [95], using the anti-kt algorithm [96, 97] with a radius parameterR = 0.4. Only jets with |η|<2.5 and pT >25 GeV are considered. The ‘tight’
working point of the jet vertex tagger (JVT) [98] algorithm is selected to remove jets with pT < 60 GeV and |η| < 2.4 that are identified as not being associated with the primary vertex of the hard interaction. Jets containing b-hadrons are identified using the DL1r b-tagging algorithm [99,100]. A 70 % efficiency working point is used, with the efficiencies being measured in simulatedtt¯events. The corresponding rejection factors (defined as the reciprocal of the efficiency values) forb-tagged jets initiated by c-quarks and light partons are 9.4 and 390 respectively.
The τhad decays are composed of a neutrino and a set of visible decay products, most frequently one or three charged pions and up to two neutral pions. The visible decay prod- ucts of theτhad decay are denoted byτhad-vis. The reconstruction of theτhad-visis seeded by jets reconstructed by the anti-kt algorithm [96], using calibrated topological clusters [101]
as inputs, with a radius parameter of R= 0.4 [102]. Reconstructed tracks are matched to τhad-vis candidates and a multivariate discriminant is used to assess whether these tracks are likely to have been produced by the chargedτhad decay products, rejecting tracks origi- nating from other interactions, nearby jets, photon conversions or misreconstructed tracks.
Theτhad-vis objects are required to have one or three associated charged-particle tracks se- lected by this discriminant. Their charge (q) is defined as the sum of the measured electric charges of these associated tracks and is required to be |q| = 1. The τhad-vis objects are also required to satisfypT>20 GeV and|η|<2.5, excluding the region 1.37<|η|<1.52.
To separate the τhad-vis candidates produced by hadronicτ-lepton decays from those due to jets initiated by quarks or gluons, a recurrent neural network (RNN) identification algo- rithm [103] (τhad-ID) is constructed using information from reconstructed charged-particle tracks and calorimeter-energy clusters associated with τhad-vis candidates. This analysis uses two τhad-ID working points: ‘medium’, which has a 75% (60%) acceptance efficiency and a background rejection of 35 (240) and ‘loose’, which has a 85% (75%) acceptance efficiency and a background rejection of 21 (90) forτhad with one (three) charged-particle
JHEP10(2023)001
Object to keep Object to remove Criteria
Electron Electron If they share the same track, the electron with the highest transverse momentum is kept.
Electron τhad-vis If ∆R <0.2, the electron is kept.
Muon τhad-vis If ∆R <0.2, the muon is kept.
Muon Electron If they share a track, the electron is removed if the muon is associated with a signature in the MS, otherwise the muon is removed.
Electron Jet Any jet within ∆R= 0.2 of an electron is removed.
Muon Jet Any jet within ∆R = 0.2 of a muon is removed if it has fewer than three associated tracks.
Jet Electron Any electron within ∆R= 0.4 of a jet is removed.
Jet Muon Any muon within ∆R= 0.4 of a jet is removed.
τhad-vis Jet Any jet within ∆R= 0.2 of a τhad-vis is removed.
Table 2. Criteria applied to overlapping reconstructed objects. The criteria are listed in the order they are applied.
tracks. A ‘very loose’ working point, having a 95% acceptance efficiency, is also used for background estimation. A separate boosted decision tree discriminant (‘eBDT’) is also used to reject backgrounds arising from electrons misidentified as τhad-vis. This discrimi- nant is built using information from the calorimeter and the ID, most notably transition radiation information from the TRT system and variables sensitive to the ratio of the energy deposited in the calorimeter to the visible momentum measured from the recon- structed tracks.
The reconstructed objects used in this analysis are not built from disjoint sets of tracks or calorimetric clusters. It is therefore possible that two different objects share most of their constituents. An overlap removal procedure is applied to resolve this ambiguity. This procedure is summarised in table 2.
The missing transverse momentum vector, E⃗Tmiss, is reconstructed as the negative vec- tor sum of the transverse momenta of leptons, τhad-vis and jets, and a “soft-term” [104].
The soft-term is calculated as the vectorial sum of thep⃗T of tracks matched to the primary vertex but not associated with a reconstructed lepton, τhad-vis or jet. The magnitude of E⃗Tmiss is referred to as the missing transverse energy, ETmiss.
5 Event selection
Events are required to contain at least one primary vertex with at least two associated tracks.
For the τlepτhad channel events were selected by single-lepton triggers. In 2015 single- electron triggers were simultaneously active withpTthresholds of 24, 60 and 120 GeV [105].
For data from 2016 onward the pT thresholds are 26, 60 and 140 GeV. Similarly to the single-electron triggers, the single-muon triggers had pT thresholds of 20 and 50 GeV for
JHEP10(2023)001
2015, and 26 and 50 GeV from 2016 [106]. The trigger thresholds were raised to keep the trigger rates sufficiently low as the luminosity was increased. The lowest pT threshold electron and muon triggers also have an isolation requirement. The lepton isolation and identification requirements loosen as the trigger pT thresholds increase. Events must con- tain at least one τhad candidate and exactly one electron or one muon. The electron or muon must be isolated and satisfy the medium lepton identification. Events with more than one lepton satisfying the medium identification are rejected, considering electrons (muons) with a pT greater than 15 (7) GeV. This helps to reject Z/γ∗ → ee/µµ events and Z/γ∗→τlepτlep. Furthermore, the electron and muon candidates are required to have pT >30 GeV, and be matched to the trigger object that caused the event to be selected.
The τhad candidate is required to havepT >50 GeV, satisfy the mediumτhad-ID selection and have|η|<2.3. The pseudorapidity selection requirement rejects events withτhad can- didates in a region with a higher background contamination and large uncertainties in the determination of the rate of electrons misidentified as τhad.
In theτhadτhadchannel, events were selected by a singleτhadtrigger [107]. For 2015 and 2016, three single τhad triggers were available with pT thresholds of 80, 125 and 160 GeV.
In 2017 and 2018, due to higher instantaneous luminosity, only the pT >160 GeV trigger threshold was used. The τhad identification requirements become less stringent as the trigger pT thresholds rise. Events must contain at least two τhad candidates where the leadingτhad candidate inpT must be matched to the trigger within an angular distance of
∆R= 0.2 and havepT that is at least 5 GeV above the trigger threshold. The subleading- pT τhad candidate is required to havepT>65 GeV. Identification requirements are applied to both τhad candidates; the leading-pT τhad must satisfy the medium selection and the subleading-pT τhad the loose selection. Events that contain any electron or muon that satisfies the loose identification requirements are rejected, which ensures orthogonality to theτlepτhad channel.
Events passing the previous requirements are then selected with criteria that are similar between the two channels. The two τhad or the electron/muon (denoted by ℓ) and τhad must have opposite electric charges and at least oneb-tagged jet is required. The invariant mass of the visible decay products of the twoτ-leptons, mvis(ℓ, τhad) or mvis(τhad, τhad), is required to be above 100 GeV, which is effective at reducing the Z/γ∗ → τ τ background.
An additional requirement ∆ϕ(ℓ, ETmiss) <1.5 is applied in the τlepτhad channel to reduce single top andtt¯events.
The variable ST is defined as the scalar pT sum of the twoτhad-vis (or ℓ and τhad-vis) and the leading-pT b-jet. A minimum requirement of ST >300 GeV is applied, as there is almost no improvement in the expected results of the analysis, discussed in section 8, by adding events with lowerST values.
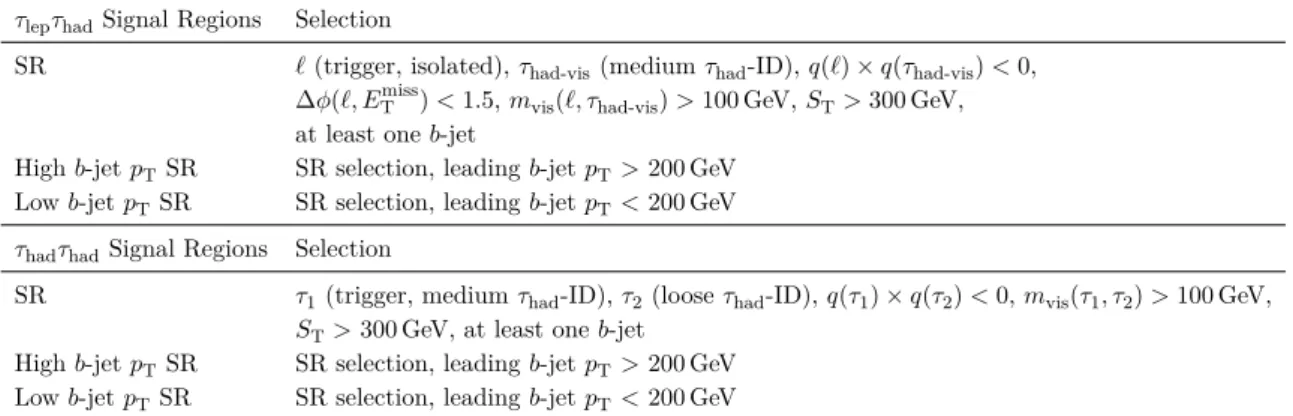
The selection criteria described above define the signal region (SR) of the analysis.
The signal acceptance times efficiency of the event selection varies between 3% and 10%, depending on the LQ mass and coupling. The efficiency is defined as the ratio of events passing the selection in each channel with respect to the signal events of the bτlepτhad and bτhadτhad final states, respectively. Events in the SR of each channel are assigned to two categories of low (<200 GeV) and high (>200 GeV) transverse momentum of the
JHEP10(2023)001
τlepτhadSignal Regions Selection
SR ℓ(trigger, isolated),τhad-vis(mediumτhad-ID),q(ℓ)×q(τhad-vis)<0,
∆ϕ(ℓ, ETmiss)<1.5,mvis(ℓ, τhad-vis)>100 GeV,ST>300 GeV, at least oneb-jet
Highb-jetpTSR SR selection, leadingb-jetpT>200 GeV Lowb-jetpTSR SR selection, leadingb-jetpT<200 GeV τhadτhadSignal Regions Selection
SR τ1(trigger, mediumτhad-ID),τ2(looseτhad-ID),q(τ1)×q(τ2)<0,mvis(τ1, τ2)>100 GeV, ST>300 GeV, at least oneb-jet
Highb-jetpTSR SR selection, leadingb-jetpT>200 GeV Lowb-jetpTSR SR selection, leadingb-jetpT<200 GeV
Table 3. Definition of signal regions (SR) used in the τlepτhad andτhadτhad channel. The symbol ℓ represents the selected electron or muon candidate and τhad-vis represents the leading τhad-vis candidate. The symbolτ1 (τ2) represents the leading (sub-leading)τhad-viscandidate.
leading-pTb-jet. The two categories are called high and lowb-jetpTSRs, respectively. The high b-jetpT SR is found to perform better for low-mass singly produced LQs, where the resonant contribution is dominant. Conversely, the lowb-jetpTSR has a better acceptance for high mass signals, where the non-resonant contribution is dominant for signals with mLQ≥0.9 TeV. This split into two categories improves the expected results of the analysis, discussed in section 8, by up to 30%.
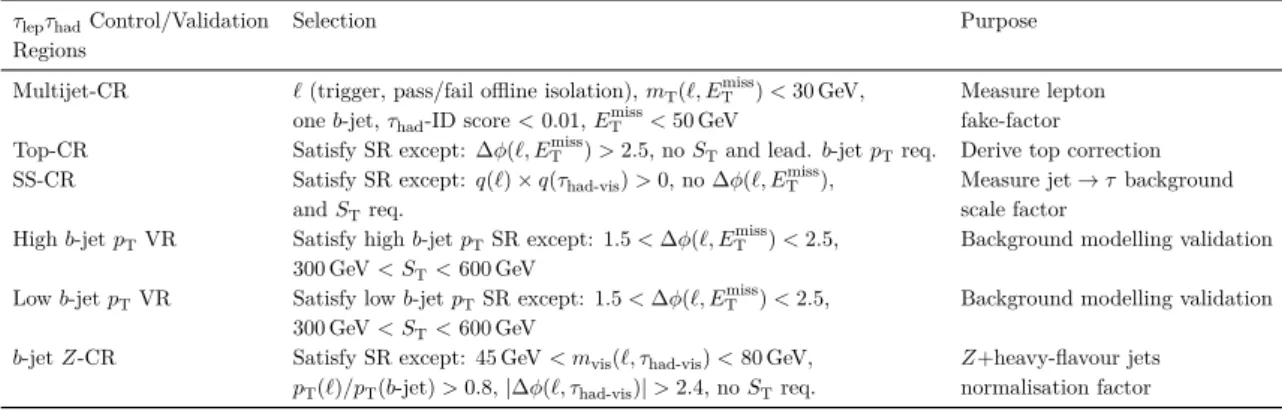
Alternative selections define the control regions (CR), used to evaluate the contribution of the main background processes in the SR, and the validation regions (VR), used to verify the good modelling of the backgrounds. The selection requirements used for the signal regions are summarised in table 3. The use of the control and validation regions in the background estimation methods is discussed in section 6.
6 Background estimation
6.1 τlepτhad channel
Control and validation regions are used in the analysis to estimate and study the modelling of the main background processes. The selection requirements used for the CR and VR in theτlepτhad channel are summarised in table 4.
In the τlepτhad channel the dominant background contributions are fromtt¯and single top-quark events. Processes involving top quarks can produce realτ-leptons, or jets that are misidentified as τhad, and are estimated by using simulation with data-driven corrections.
The t¯t and tW contributions are treated as one combined top-quark background due to their similar kinematics and final states. In the low (high)b-jetpTSR,t¯taccounts for 90%
(86%) of all top-quark processes and 96% (97%) of the single top-quarks are from tW. To ensure that this background is accurately modelled, a top-quark control region (Top-CR) is defined. With respect to the SR selection, the requirements on the leading b-jetpTand the ST are removed, and the condition ∆ϕ(ℓ, ETmiss) < 1.5 is replaced by ∆ϕ(ℓ, ETmiss) >2.5.
This results in a region with a purity of 91% in top-quark processes and negligible signal contamination. Out of all top-quark events in the Top-CR, 91% are from t¯tprocesses and
JHEP10(2023)001
τlepτhadControl/Validation Selection Purpose
Regions
Multijet-CR ℓ(trigger, pass/fail offline isolation),mT(ℓ, EmissT )<30 GeV, Measure lepton oneb-jet,τhad-ID score<0.01,EmissT <50 GeV fake-factor Top-CR Satisfy SR except: ∆ϕ(ℓ, EmissT )>2.5, noSTand lead.b-jetpTreq. Derive top correction SS-CR Satisfy SR except:q(ℓ)×q(τhad-vis)>0, no ∆ϕ(ℓ, ETmiss), Measure jet→τbackground
andSTreq. scale factor
Highb-jetpTVR Satisfy highb-jetpTSR except: 1.5<∆ϕ(ℓ, ETmiss)<2.5, Background modelling validation 300 GeV< ST<600 GeV
Lowb-jetpTVR Satisfy lowb-jetpTSR except: 1.5<∆ϕ(ℓ, ETmiss)<2.5, Background modelling validation 300 GeV< ST<600 GeV
b-jetZ-CR Satisfy SR except: 45 GeV< mvis(ℓ, τhad-vis)<80 GeV, Z+heavy-flavour jets
pT(ℓ)/pT(b-jet)>0.8,|∆ϕ(ℓ, τhad-vis)|>2.4, noSTreq. normalisation factor
Table 4. Definition of the background-enriched control regions (CR) and validation regions (VR) used in theτlepτhad channel. The symbolℓrepresents the selected electron or muon candidate and τhad-visrepresents the leadingτhad-viscandidate.
∼97% of the single top-quark events are fromtW, which is compatible with the composition of the SRs.
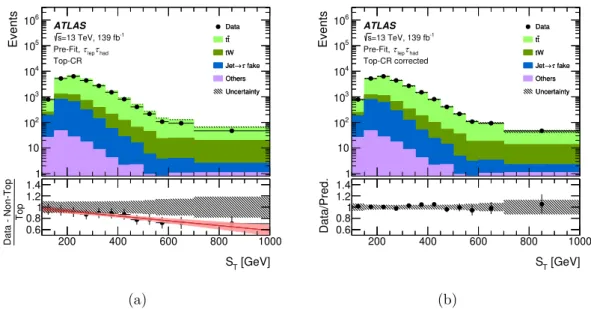
A discrepancy between the data and simulation prediction is observed in the Top-CR, with the simulation overestimating the background contribution. Recent measurements of differential cross-sections have demonstrated that the current simulations of t¯t processes overestimate the upper tail of the top-quark pT spectrum [108, 109]. The discrepancy varies depending on ST; for this reason, a correction is derived as a function of ST in this region based on the ratio between data and simulation. A top-quark correction scale factor is defined in eq. (6.1) and is applied to all t¯t and single top-quark simulated events. The comparison between data and the background prediction in the Top-CR and the derived correction as a function of ST are shown in figure 2, where t¯t and tW events with a generated lepton reconstructed as a lepton (a ‘true’ lepton) and a jet misidentified as a τhad are included under theJet→τ fakecontribution. This demonstrates that the Top-CR is dominated by t¯t and tW events with true leptons and τhad in the final state, thus this correction does not account for mismodelling due to jets being misidentified as τhad. The modelling of events with a true lepton and jet misidentified as a τhad in the final state is discussed later in this section.
The top-quark correction scale factor is defined as a function of ST:
SFTop(ST) = (Ndata−Nnon-Top)(ST)
NTop(ST) , (6.1)
where Ndata and NTop represent respectively the number of data events and of tt¯plus single top-quark events predicted by simulation, NTop includes events with both true and misidentified τhad in the final state and Nnon-Top includes all the other backgrounds es- timated by using simulation. The resulting correction is well fitted by a linear function, which is used to derive the correction scale factors. The correction is also derived with an alternative logarithmic function: SFTop(ST) =aln(ST) +b, and the difference between the two corrections is taken as an uncertainty on the correction. Additional uncertainties related to the cross-section and acceptance of the top-quark processes, as well as the sta-
JHEP10(2023)001
200 400 600 800 1000
[GeV]
ST
0.6 0.8 1 1.2 1.4
TopData - Non-Top
1 10 102
103
104
105
106
Events
Data t t tW
fake τ Jet→ Others Uncertainty
ATLAS
=13 TeV, 139 fb-1
s
had
τ
lep
Pre-Fit, τ Top-CR
Data t t tW
fake τ Jet→ Others Uncertainty
(a)
200 400 600 800 1000
[GeV]
ST
0.6 0.8 1 1.2 1.4
Data/Pred.
1 10 102
103
104
105
106
Events
Data t t tW
fake τ Jet→ Others Uncertainty
ATLAS
=13 TeV, 139 fb-1
s
had
τ
lep
Pre-Fit, τ Top-CR corrected
Data t t tW
fake τ Jet→ Others Uncertainty
(b)
Figure 2. (a) Comparison between data and the background prediction for the ST distribution in the Top-CR in theτlepτhad channel. Thet¯tandtW contributions only include events with true leptons and τhad in the final state. The label Jet→ τ fake corresponds to events with a lepton and a quark- or gluon-initiated jet misidentified as τhad; this contribution is estimated by using simulation. The bottom panel shows the ratio of the data to the prediction where the uncertainty shown by both the points and hatched band includes the statistical uncertainty in the data and background predictions, the theoretical uncertainty in the MC simulation predictions, and the MC subtraction uncertainty. Finally, the line and the cross dashed band show the resulting fit and the associated uncertainty. The label ‘Top’ in the bottom panel denotes the sum oftt¯andtWprocesses, while ‘Non-Top’ refers to all other processes considered. Entries with values above thex-axis range are included in the last bin of the distribution. (b) Shows the same distribution after the top-quark correction scale factor is applied to thet¯tandtWsimulated events. Only the uncertainty associated to the top-quark correction and the statistical uncertainty on data and simulation are considered.
tistical and cross-section uncertainties related to the subtraction of the contribution from the other processes, are applied to account for the slight difference between the fractions of top-quark events that are due to t¯t production in the Top-CR and SRs and for the extrapolation to the SR. The scale factor is applied at the per-event level to the tt¯plus single top-quark events passing the selections of the signal, control or validation regions.
The total uncertainty in the scale factor varies between 4% and 7% for ST in the range of 300–700 GeV. Different binning choices for the ST distribution were also considered, but the impact on the SFTop(ST) uncertainty is found to be below 5% and therefore not considered as an additional source of uncertainty.
Another source of background in the τlep τhad channel stems from multi-jet events, where jets can mimic both theτlep andτhad. This type of background from multi-jet events is estimated via a data-driven fake-factor method by deriving a lepton fake-factor. The lepton fake-factor is measured in the multi-jet control region (multijet-CR) that is enriched in multi-jet events, but is similar kinematically to the SR. The events are still required to satisfy the single lepton trigger and to have exactly one b-jet, but the identification algorithm to reject jets misidentified as τhad is instead used to select multi-jet events by
JHEP10(2023)001
requiring an extremely low value for τhad RNN identification score (corresponding to only 1% acceptance for true τhad). Additional selection criteria on mT(ℓ, ETmiss)<30 GeV and ETmiss < 50 GeV are applied to increase the purity of multi-jet events relative to other backgrounds. The fake-factor is measured with a requirement on the leading b-jet pT >
25 GeV and is defined as:
F Flep(pT(τlep), η(τlep)) = (Ndata−NMC)pass-iso(pT(τlep), η(τlep)) (Ndata−NMC)fail-iso(pT(τlep), η(τlep)).
The variable Ndata is the total number of data events and NMC is the number of background events predicted by simulation that contain a trueτlep. Events are split between the numerator and denominator based on whether the τlep satisfied the lepton isolation requirement or not. The fake-factor is parameterised as a function of the τlep pT and split into central (|η| < 1.52) and forward (|η| > 1.52) regions. The statistical uncertainty on theF Flep(pT(τlep), η(τlep)) fake-factor and simulation-related uncertainties on NMC are considered as systematic uncertainties and propagated to the estimate of the multi-jet background. The uncertainties are in the range of 6–230% as a function of the τhad-vis η and pT. A control region is defined by having the same selection as the SR, except that the lepton isolation requirement inverted. Applying the fake-factor at the per-event level, the multi-jet estimate in each SR is then obtained by scaling the distribution in the corresponding control region where the isolation criteria are not satisfied.
An additional source of background are events where a lepton is produced in association with a jet that is misidentified as a τhad (Jet →τ fake). These contribute approximately 20% to the expected background in the SR and are mostly fromt¯twith contributions from W+jets, Z+jets, and diboson events. To ensure that these are well modelled, a ‘same- sign’ control region (SS-CR) is defined by taking the same selection as the SR, but with a light lepton with the same electric charge as τhad. The requirements on ∆ϕ(ℓ, ETmiss), ST and the leading b-jet pT are removed to increase the number of events in the CR. The top-quark correction scale factor derived in eq. (6.1) is applied to top-quark events in this region (approximately 81% of the total). As the Top-CR used to derive that scale factor is dominated byt¯tandtW events with trueτ-leptons in the final state, it does not correct for mismodelling of jets that are misidentified as aτhad. As a difference between the simulation prediction and the data is still observed, another scale factor is derived to account for any remaining differences from those backgrounds with a lepton and misidentified τhad (approximately 60% of the events in this region). The remaining events contain true τhad and are subtracted, before calculating the scale factor, by applying the top-quark correction scale factor. Then, the scale factor for events with a lepton and a jet misidentified as a τhad is defined as:
SFfake-τ(pT(τhad-vis), ntrack) = (Ndata−Ntrue-τ)(pT(τhad-vis), ntrack) Nfake-τ(pT(τhad-vis), ntrack) ,
where Ntrue-τ is the total number of events predicted by simulation where both the τhad and τlep are true and Nfake-τ is the number of predicted events with a jet misidentified as a τhad and a true τlep. The scale factor is parameterised as a function of pT(τhad-vis)
JHEP10(2023)001
and the number of charged-particle tracks (ntrack). It is applied to any MC background event with a true lepton and a jet misidentified as a τhad. The correction is derived in the SS-CR of the τµτhad channel and then applied to both τeτhad and τµτhad, because the τeτhad SS-CR contains events with misidentified electrons, which are not well modelled by simulation. The SFfake-τ correction values are in the range of 1–1.2 (1–1.5) for τhad with one (three) charged-particle tracks. The statistical uncertainty on the SFfake-τ correction and the simulation-related uncertainties affecting Ntrue-τ and Nfake-τ are propagated to the background estimate as systematic uncertainties. As a function of the τhad-vis pT, the uncertainties amount to 15–20% (22–140%) for τhad-vis candidates with one (three) associated charged-particle track.
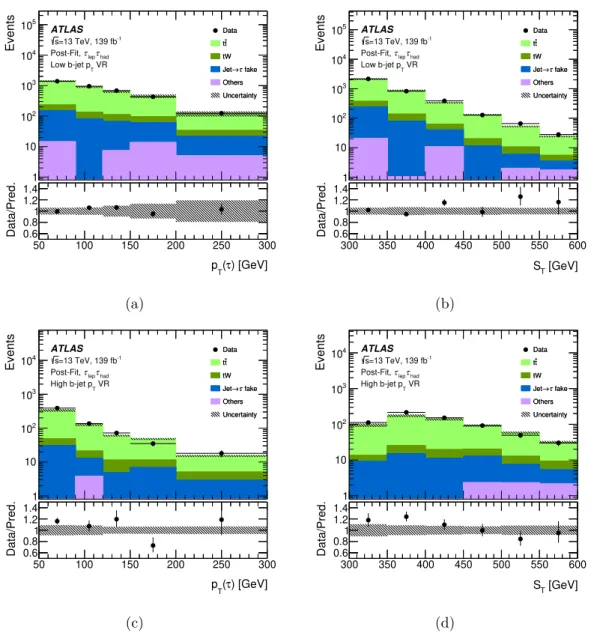
To validate the background modelling in a region depleted in signal, high and low b-jet pT validation regions (high and low b-jet pT VR) are defined by applying the SR requirements, with the exceptions of the ∆ϕ(ℓ, ETmiss)<1.5 and theST>300 GeV criteria, that are modified into 1.5<∆ϕ(ℓ, ETmiss)<2.5 and 300< ST <600 GeV. The low (high) b-jet pT VR consists of 82% (80%)tt¯events, of 8% (10%) single top-quark events, and of 9% (9%) of events where a jet is misidentified as aτhad. Good modelling of the background is found in the validation regions; the background estimate agrees with data within the total uncertainty, as shown in figure3.
6.2 τhadτhad channel
In the τhadτhad channel, the main background sources are Z/γ∗→ τhadτhad events, as well as top-quark processes, with W bosons decaying to τhad, or to electrons, muons or jets misidentified as τhad. Both Z/γ∗ → τhadτhad and top-quark backgrounds are estimated using simulation with data-driven corrections, which are discussed further below. The se- lection requirements used to define the CR and VR in theτhadτhad channel are summarised in table 5.
As the mismodelling of the kinematic distributions observed in the τlepτhad channel originates from the underlying top-quark process rather than the τhad decay, it is also expected to be present in theτhadτhad channel. However, due to small number of events in the τhadτhad channel the statistical uncertainty in the top-quark processes is comparable with the expected mismodelling. This makes it difficult to select a τhadτhad-only control region to quantify this mismodelling. Therefore, the ST-dependent top-quark correction scale factor from eq. (6.1) derived in the τlepτhad channel is also applied to the τhadτhad cha