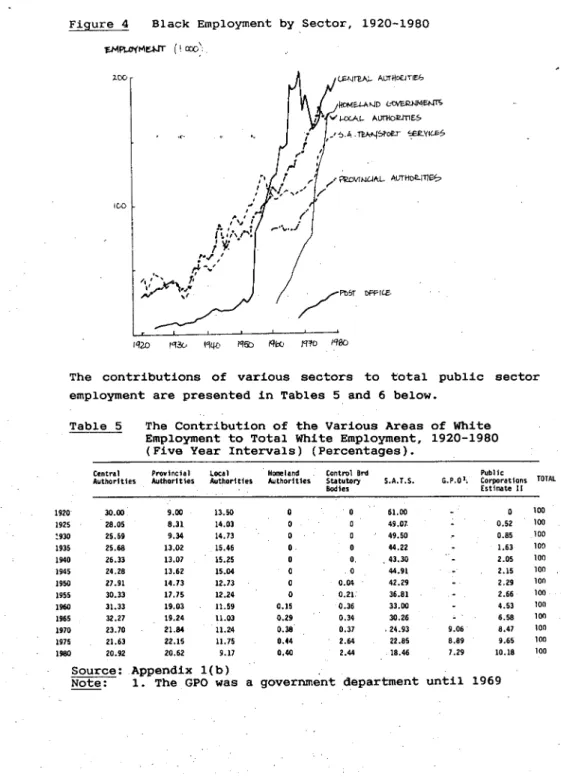
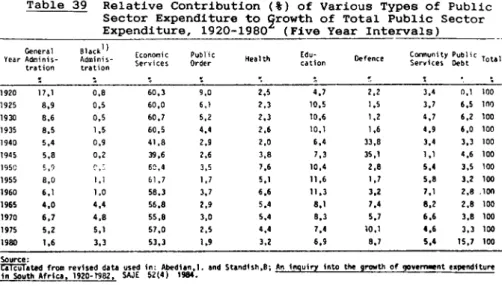
Relative contribution of different types of public sector employment to the growth of total public sector employment, at five-year intervals. Public sector employment data are presented in two forms: by sector and by activity (or function).

PART I TOTAL PUBLIC SECTOR EMPLOYMENT
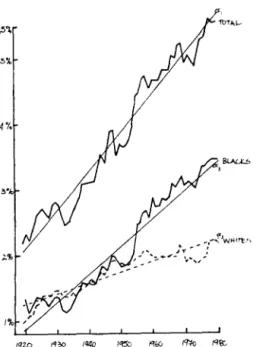
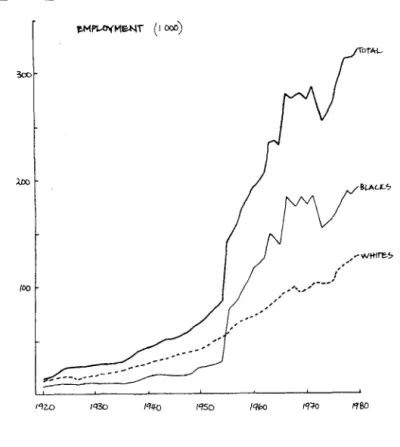
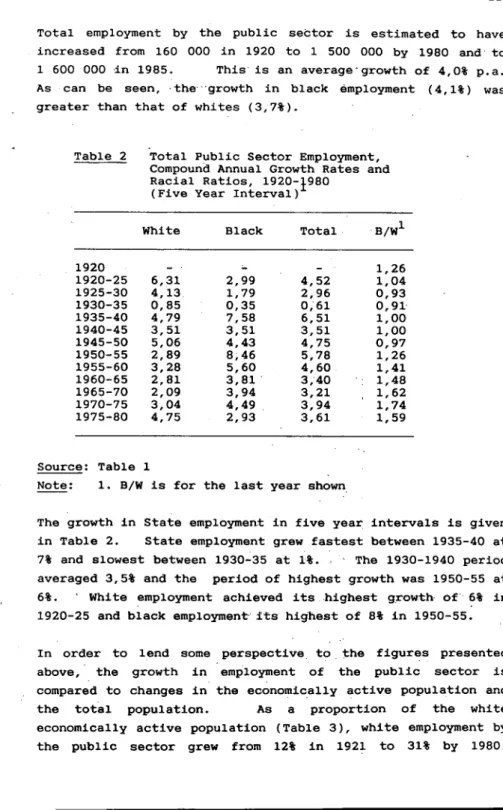
As a share of the white working population (Table 3), white employment in the public sector grew from 12% in 1921 to 31% in 1980. It can be seen from Table 4 that employment as a share of the white population by the public sector had increased from 5% in 1920 to 13% in 1980.
PART II THE SECTORS
THE CENTRAL AUTHORITIES
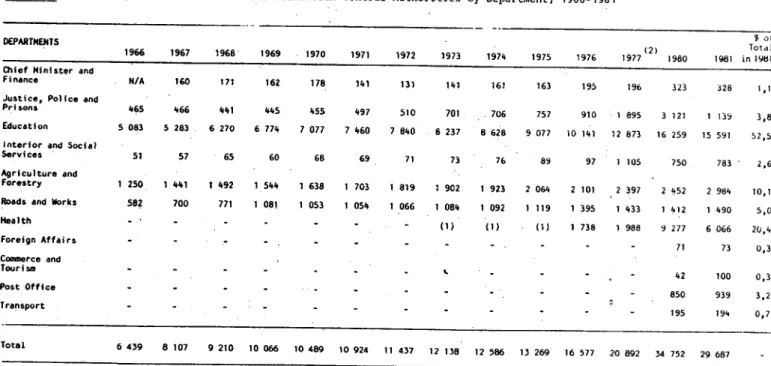
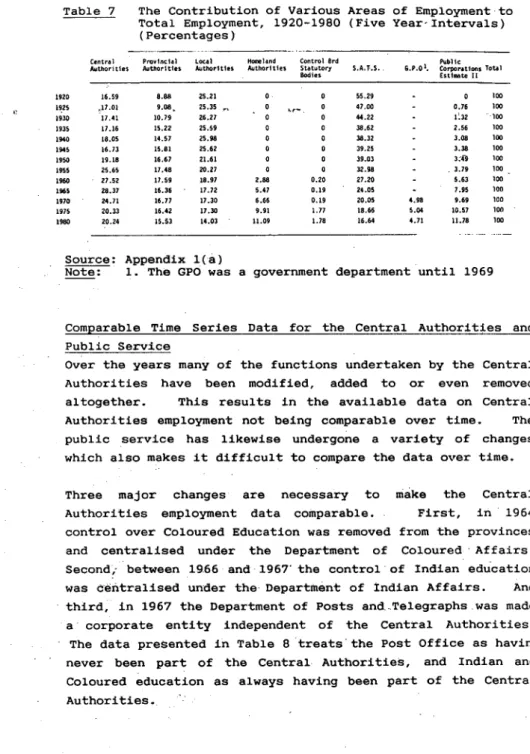
In 1967 the Post and Telegraph Department was disbanded and post office staff became independent of the public service. The comparable public service employment data treat the GPO and 'services' in the SADF and SAP as never having been part of the public service.
PROVINCIAL AUTHORITIES
The consequences of this are that until 1980 the public service operated with fixed factor sizes. It is suggested that the level of this fixed factor proportion was until 1980, simply by employing more whites than blacks in the public service. There are no employment data available from the provincial authorities for the years before 1960.
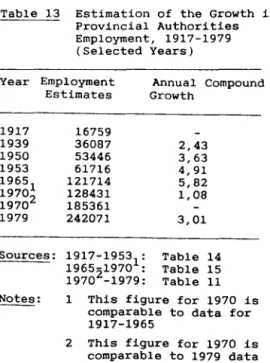
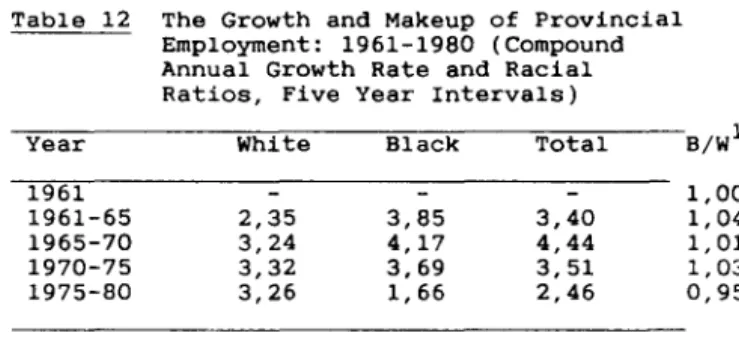
Source: Richards, C S Growth of Employment in S A since Union, Department, .of Commerce',.' University of the Witwatersrand, June 1957. From the available data (Table 13), employment in the provincial government has grown at an average annual rate of 3.5%. The most notable feature of provincial employment, especially since 1961, is that although employment growth has shown some changes, these moderate changes have passed.
The problem is why the ratio of white to black employment remained so stable, while both central and local authorities increased employment for black people despite growth. The two largest components of county government employment are health care and white education.
LOCAL AUTHORITIES
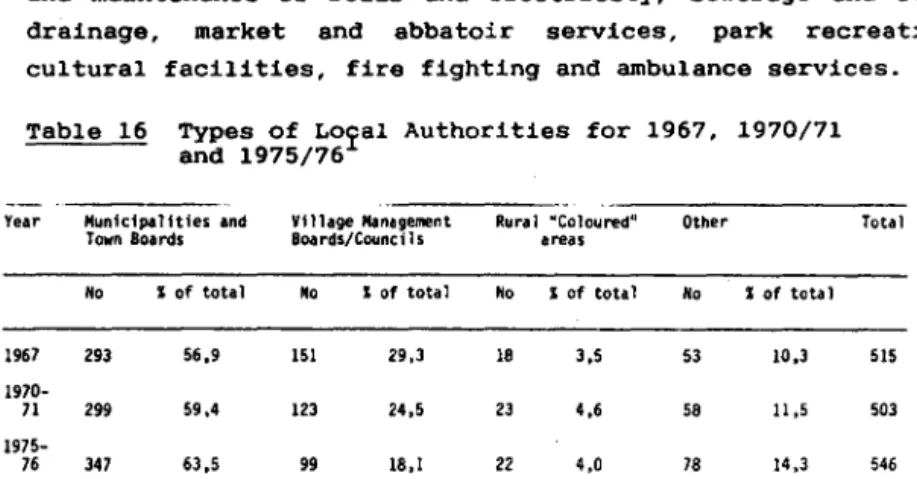
As such, it limited the significant substitution of blacks for whites among provincial authorities' employment. While the above can explain that · the growth in provincial authorities could have been greater. These exist only in the Cape, comprise about 4% of the total number of Local Authorities (Table 16) and were responsible for 0.1% of all employment by Local Authorities in 1972 (Table 17).
In 1976 these comprised 14.3% of all local authorities, but accounted for only 3.4% of total local authority employment in 1972. These are responsible for the majority of employment in local authorities (95.4% in 1972) and is the largest category of municipalities. Urban local authorities control most of the infrastructure and services needed in urban areas, including administration and maintenance of roads and electricity, sewerage and other drainage, market and abattoir services, park recreation, cultural facilities, firefighting and ambulance services.
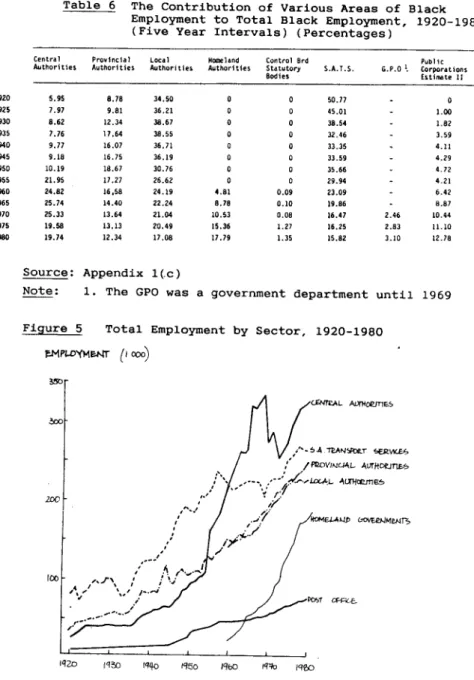
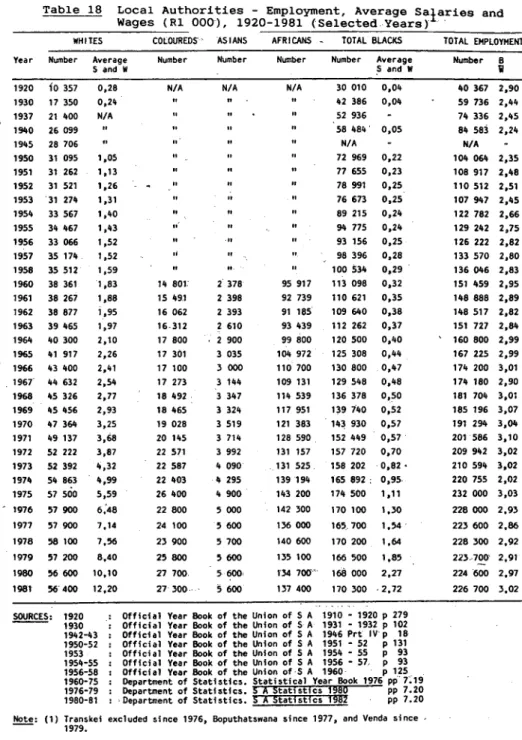
As a percentage of total public sector employment, white employment in local governments rose from 13% of the total in 1920 to 15% during the Great Depression period before gradually declining to 9% by 1980 (Table 1). In 1920, black employment in local governments constituted the second largest share of total employment at 35%.
HOMELAND GOVERNMENTS
While the growth in Homeland employment. was high, growth in relation to de'facto population and labor supply was low. Employment by the Home Governments as a proportion of the total de facto population is shown in Table 22 for 1973 and 1980. However, when compared to the same exercise for total public sector employment, it can be seen that the relative Homeland employment is significantly lower than that of both total white and total black public sector employment.
1980 Calculated from Tables 7 and 100 presented in Benso's Statistical Survey of Black Development Part I and II Pretoria: Benso, 1982. Statutory bodies are bodies such as the "Hotel Board, C. Regional Performing Arts Councils; state libraries, etc. Public companies and bodies that are integral parts of government departments or provincial administrations are not included.).
Recruitment to supervisory committees, mostly agricultural committees, and statutory bodies was very irregular. Public companies and bodies that are part of government departments or provincial administrations are not included.
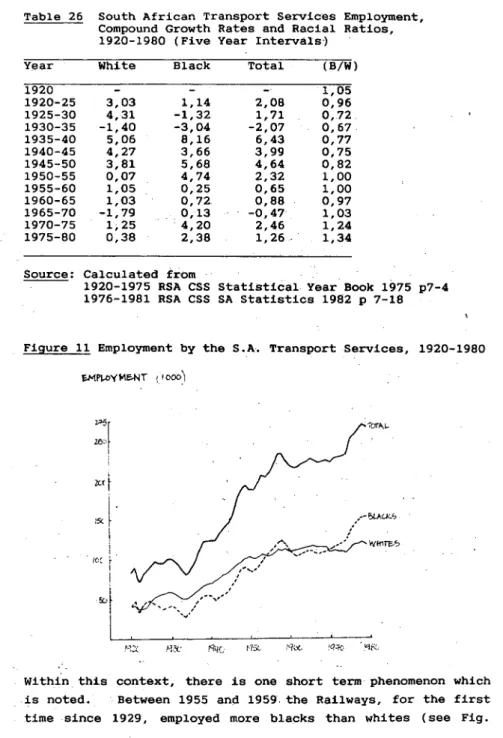
THE SOUTH AFRICAN TRANSPORT SERVICES
This organization, as the country's main transport enterprise, includes a national railway system along with a comprehensive road transport service, major ports, the airline known as South African Airways (SAA) and two pipelines for. Of the many activities of the South African Transport Services, it is the railways that have the greatest importance in employment. The change is seen as significant because it was both large (see Table 25) and occurred at a time of increasing shortage of white labor for the Railways.
White union pressure probably forced a reversal of the trend, for the next time the Railways replaced whites with blacks, in 1970, this was only after highly publicized consultation with white railway unions. The above hypothesis implies that the Railways operated under a fixed constraint which was clear but flexible. If the above is correct, it has important implications for the potential growth of railway employment.
This is reflected in the history of railway employment: the railways experienced the fastest employment growth in the period 1936-1956. As the economy began its dramatic rise in the 1950s and 1960s, railroad employment growth initially slowed and remained virtually constant through the 1960s, while demand for railroad services continued to increase.
THE POST OFFICE
Although no evidence is available to explain this disruption, it appears that the railroads, faced with a growing labor shortage, attempted to replace black labor with white. The increase in railroad employment was limited because the ratio of whites to blacks was greater than one. However, after 1950, as the white labor shortage became apparent, the increase in overall railroad employment was limited by its ability to attract white labor.
It was not until after 1969, when racial hiring restrictions were relaxed, that railroad employment began to increase again.
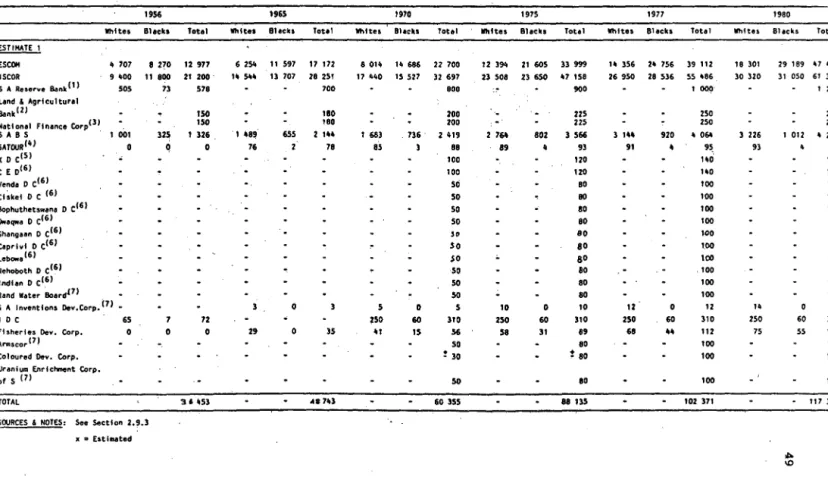
These companies are not particularly numerous and the employment is insignificant compared to the others. Some of the more important service companies are the South African Broadcasting Corporation, the South African Tourist Corporation (Satour) and the Uranium Enrichment Corporation of South Africa. These cover both the pure financing corporations, such as the Land and Agricultural Bank of South Africa and the South African Reserve Bank, and the many numerous development corporations such as the Industrial Development Corporation, Fisheries Development Corporation, Corporation for Economic Development (formerly Bantu) Investment Corporation) and South African Inventions Development Corporation.
There are hundreds, perhaps thousands, of corporations in South Africa under the apparent control of the private sector that simply would not exist were it not for the finance channeled through the development corporations. However, little data is available on the number of 'private' companies that are wholly owned by development companies, partly owned or financed by development companies, or that are recipients of investment funds from development companies. Data on the number of employment opportunities created by homeland development corporations is available, although the reliability of this data is questionable.
Transkei Development Corporations (Xhosa Development Corporation) for Economic Development (CEO) Investment Corporation), as the main development corporations, are. Data is available only for XDC and not for the now separate development corporations.
PART III THE FUNCTIONS
TOTAL PUBLIC SECTOR
No significant increase occurred until after 1960 when employment rose from 1% of the total to 2% in 1965 and has remained at that level. Again real growth in this function occurred only after 1960, and also reflects the growth of the Department of Bantu Administration and Development into the Co-operation and Development monolith. This is the most conservative estimate, but the only one available for any reasonable part of the period.
Over the period, employment as a percentage of the total declined gradually until 1960, increased gradually in the 1960s, increased until 1970, and has declined since. Education: This includes National Education, Bantu Education (Bantu Education has had different names over the years and is currently part of the Ministry of Cooperation and Development), Colored Education and Indian Education. Firstly, these are ex ante figures and do not provide an indication of the ex post situation.
This is especially a problem given the perennial labor shortage problems in most of the public sector. Since the purpose of this section is to give some indication of the distribution of government employees in certain areas of government control, this approximation at least partially fulfills that purpose.
THE PROVINCIAL AUTHORITIES
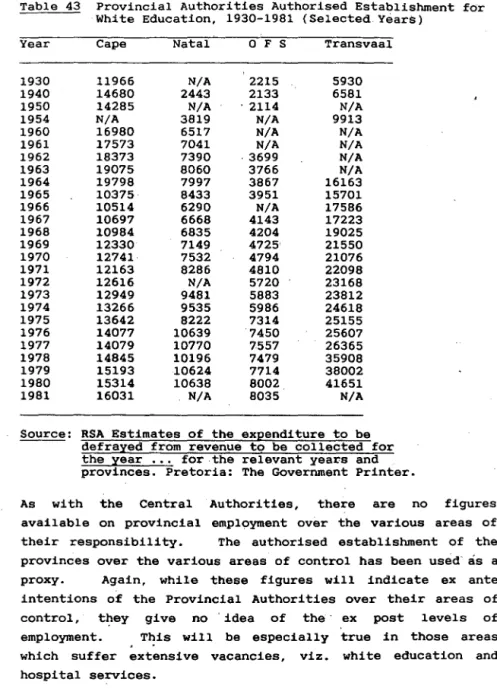
Source: RSA eXEnditures Estimates to be covered by revenue to be raised for the year. As with Central Authorities, there are no figures available for provincial employment across their various areas of responsibility. The authorized creation of provinces over different areas of control is used as a proxy.
Again, while these figures will indicate ex ante intentions of the Provincial Authorities over their areas of control, they do not give any 'idea of the' ex post levels of employment. The functional division of the provinces' authorized service state is given: white education (Table 43), authorized hospitals and health services (Table 44) and the other functions (Table 45). Source: RSA Estimates of the expenses that - - - must be covered from income for which must be collected.
Source: RSA Estimates of the expenditure to be met from revenue to be collected for the year.
THE HOMELANDS
Transkelan C4?verMllnt, Estimates of the Expenditure arising from the Revenues for the ~e.r. In summary, it can be said that employment in the public sector has grown significantly over time and that this growth has been at a rate greater than the growth in both total population and economically active population. The most surprising and least expected result is the evidence regarding the tremendous growth in the number of blacks working for the state.
This growth is largely centered around the growth of black employment in the public services, viz. In terms of the activities undertaken by the public sector, almost half of all employment is related to the provision of economic services. The effect of this was to severely limit the growth in employment in these sectors during the periods when white labor shortages ~,'3.
South Africa, estimates of expenditure to be met from revenues to be collected for the year ending for all years 1910-1984. South Africa, Comptroller and Auditor General, Report of the Comptroller and Auditor General for the financial year for all years 1910-1983.