The solution applies supply chain management principles and constraints to the proposed management model assuming multi-project critical chain management is in place. We simulated the proposed solution and confirmed that it is indeed a valid way to increase the value of the organization in terms of amount and time.
PAGE
PAGE
LIST OF TABLES
LIST OF ABBREVIATIONS
INTRODUCTION
- INTRODUCTION TO THE RESEARCH
- THE CURRENT STATE OF THE INDUSTRY
- THEORETICAL FRAMEWORK
- THEORETICAL BOUNDARIES OF THE STUDY
- THE SCOPE OF THE RESEARCH
- THE RESEARCH APPROACH
- USING THEORY OF CONSTRAINTS THINKING PROCESSES IN THE STUDY
- THE SIMULATION MODEL
- RESEARCH BREAKDOWN
- IDENTIFYING THE MANAGEMENT PROBLEM IN THE MULTI - PROJECT ENVIRONMENT
- THE GENERIC EVAPORATING CLOUD
- HYPOTHESIS
- THE PROPOSED CONTRIBUTION
- CONCLUSION
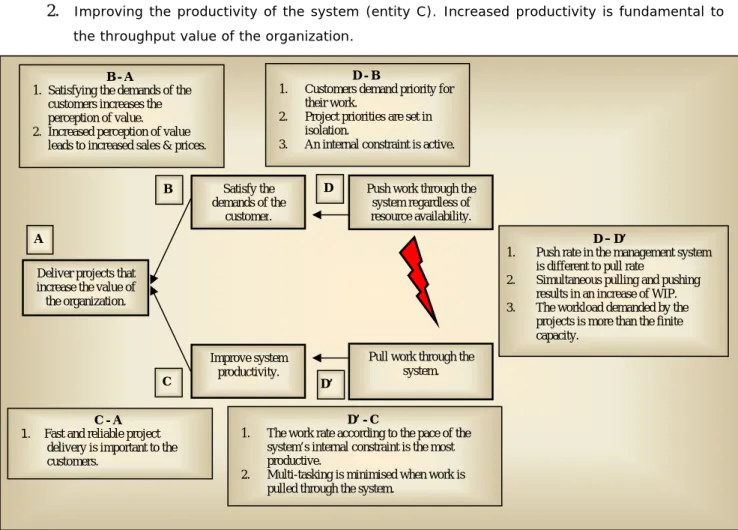
To answer this question, the management problem in the multi-project environment for this study will be postulated using one of the TOC thinking process tools - the Evaporating Cloud (EC). The logic of the EC will be discussed in the following paragraphs and the discussions should be followed alongside Figure 5.

LITERATURE STUDY
INTRODUCTION TO THE LITERATURE STUDY
COMPETING THROUGH DEVELOPMENT CAPABILITY
- THE KEY DRIVING FORCES IN DEVELOPMENT
- THE COMPETITIVE ESSENTIALS
- THE OPPORTUNITY AND THE CHALLENGE
Flatten the organizational structure by using cross-functional teams to make the firm more flexible and responsive. Successful new products also unleash a virtuous cycle in reputation and enthusiasm within and outside the organization.
![Table 1: The development essentials, adapted from Willis and Jurkus [53].](https://thumb-ap.123doks.com/thumbv2/pubpdfnet/8968343.42206/31.918.94.839.739.923/table-development-essentials-adapted-willis-jurkus.webp)
2 .2.3.1 DOING THE RIGHT PROJECT RIGHT
CHARACTERISTICS OF EFFECTIVE DEVELOPMENT
The concept of development strategy, the creation of a total project plan to guide a portfolio of development efforts, and two development processes that successfully initiate and select projects and focus the organization's resources to bring the most attractive opportunities to market quickly and efficiently, will be investigated.
THE VALUE ACQUISITION PROCESS
- THE CONCEPT OF DEVELOPMENT STRATEGY
- PROBLEMS IN NEW PROCESS DEVELOPMENT
- A FRAMEWORK FOR A DEVELOPMENT STRATEGY
- TECHNOLOGY PLANNING AND STRATEGY
- PRODUCT/MARKET PLANNING AND STRATEGY
- DEVELOPMENT GOALS AND OBJECTIVES
- THE AGGREGATE PROJECT PLAN
- POST-PROJECT LEARNING
- STRUCTURING THE DEVELOPMENT FUNNEL
- CREATING THE DEVELOPMENT FUNNEL
- THE STAGE-GATE DEVELOPMENT PROCESS
- ESTIMATION AND EVALUATION OF VALUE OPPORTUNITIES
The technical relevance of the opportunity (availability of required skills and facilities, probability of technical success). Research direction and balance of the organization (connection to research goals and desired research balance).
![Table 3. Problems in new product/project development, adapted from Cooper [8].](https://thumb-ap.123doks.com/thumbv2/pubpdfnet/8968343.42206/37.918.181.734.574.836/table-problems-new-product-project-development-adapted-cooper.webp)
THE VALUE DELIVERY PROCESS
- PROJECT PERFORMANCE ISSUES
- CRITICAL CHAIN PROJECT MANAGEMENT
- IDENTIFY THE CONSTRAINT
- EXPLOIT THE CONSTRAINT
- SUBORDINATING MERGING PATHS
- ELEVATE THE CAPACITY - ACTIVITY PERFORMANCE
- EXPLOIT THE PROJECT PLAN USING BUFFERS AND BUFFER MANAGEMENT
- THE MULTIPLE-PROJECT ENVIRONMENT
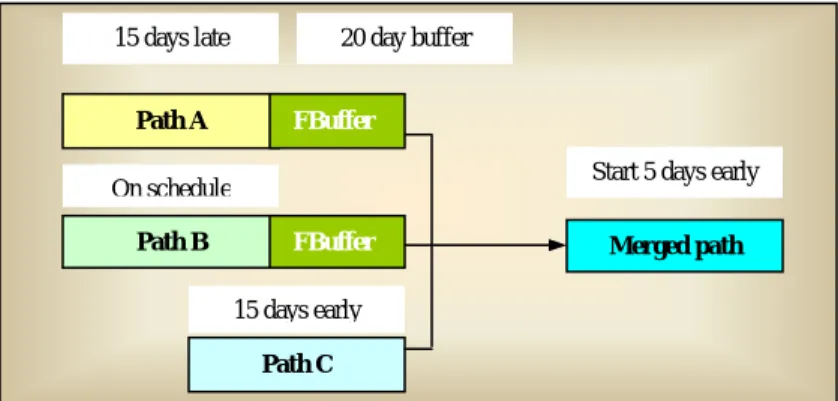
Since (n)1/2 is much smaller than n, the effect of aggregation of independent risks is significant, as discussed by Steyn [45]. This includes paths that merge with the critical chain at the end of the project.
![Table 5:Proposed solutions to achieve a successful project delivery process, adapted from Cooper [8]](https://thumb-ap.123doks.com/thumbv2/pubpdfnet/8968343.42206/52.918.107.809.58.449/proposed-solutions-achieve-successful-project-delivery-process-adapted.webp)
THE EXISTING GAP IN THE LITERATURE
Synchronizing projects in this way has the effect that the work of unrestricted resources is also more efficiently distributed.
CONCLUSION
THE PROPOSED INJECTIONS
BACKGROUND
RATIONALE FOR THE PROPOSED ‘INJECTIONS’
THE PROPOSED INJECTIONS TO THE EVAPORATING CLOUD
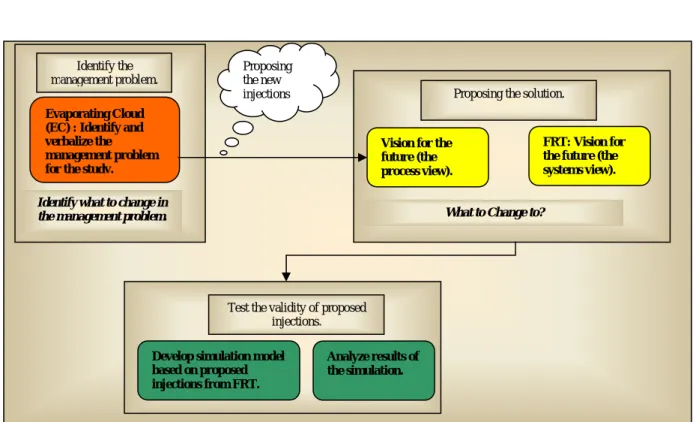
The following sections of this chapter will discuss in detail the "process" and "system" view of the proposed injections. The proposed injections will then be examined in the remainder of the study by building a simulation model to test whether the proposed injections presented by the "system view" (FRT) are indeed a valid and effective way to invalidate one or more of the assumptions. supporting the EC, thus vaporizing the EC. The reasons why injections may invalidate the assumptions supporting EC will become apparent during the course of this chapter and will be further clarified in Chapter 5, after simulation results are presented.
THE ‘PROCESS’ VIEW OF THE PROPOSED INJECTIONS
- FLOW IN A SYSTEM
- CRITICAL CHAIN MULTI-PROJECT MANAGEMENT (CCMPM) APPLIED IN THE PROPOSED SOLUTION
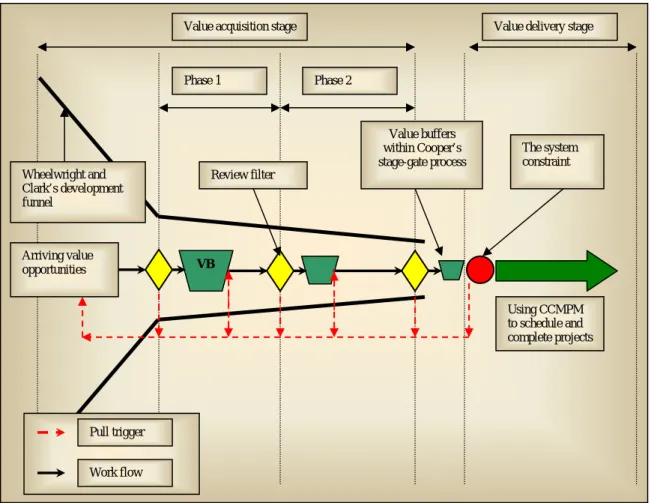
- THE STAGE-GATE MODEL AND THE DEVELOPMENT FUNNEL
- BACKGROUND TO GIVE FOCUS TO THE INJECTION
- THE VALUE ACQUISITION PROCESS
- DIFFERENT PROJECT STAGES AND DECISION FILTERS
- THE VALUE DELIVERY PROCESS
- THE IMPORTANT CHARACTERISTICS OF THE PROPOSED MANAGEMENT MODEL
- SIZING OF THE VALUE BUFFERS
- VALUE BUFFER MANAGEMENT
- SUMMARIZING THE PROPOSED PROJECT MANAGEMENT MODEL
Operate as a pull system with pull triggers located in the last stages of the value chain;. Decision filter 2 – located between phase 1 and phase 2 of the value acquisition process, before value buffer 2. Individual projects in the value chain are scheduled using the Critical Chain project management approach.
In the proposed project management model, the value buffer status indicates the overall health of the model and will be the input for buffer management. The flow in the system will be synchronized with the work rate of the limiting resource.
THE ‘SYSTEMS’ VIEW OF THE PROPOSED INJECTIONS - THE FUTURE REALITY TREE
- CONSTRUCTING THE FRT
Therefore, the work rate of the limiting resource will represent the productivity of the system. Projects are designed for all phases and scheduled with Critical Chain multi-project scheduling according to the work rate of key resources as planned with aggressive duration estimates. This means that one proves that something is the inevitable result of the existence of something else by relying on experience, intuition, common sense and fact (Scheinkopf, [41]).
To test the validity of the conditions stated in the FRT, the categories of legitimate reservation are used. Cause insufficiency – further examine the existence of causality by looking for missing dependent elements of the cause.
![Figure 26: Basic categories of legitimate reservation, adapted from Scheinkopf [41].](https://thumb-ap.123doks.com/thumbv2/pubpdfnet/8968343.42206/90.918.184.738.833.1037/figure-basic-categories-legitimate-reservation-adapted-scheinkopf.webp)
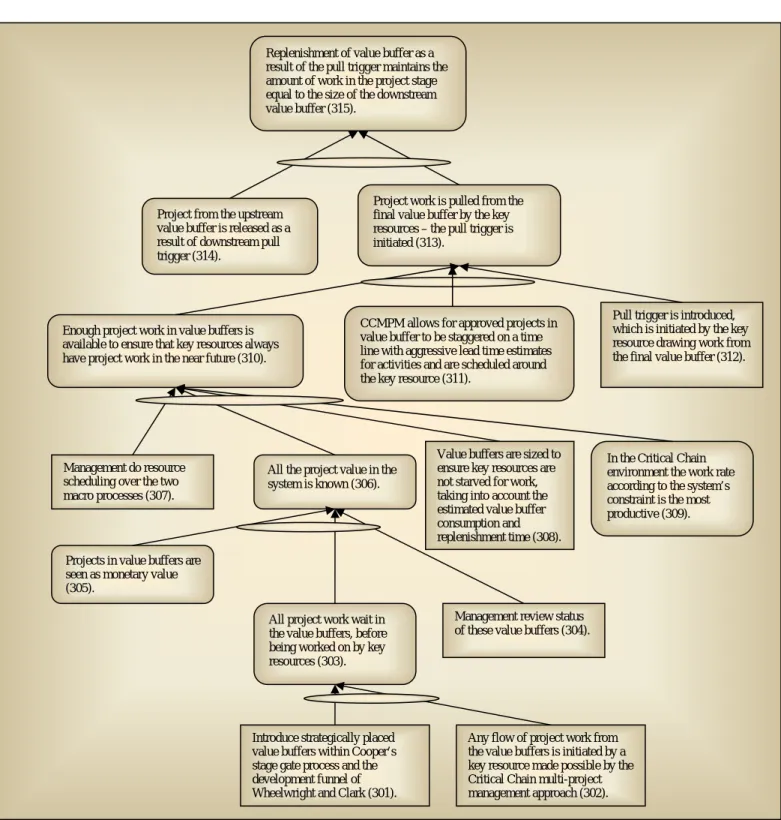
THE FRT FOR THE PROPOSED PROJECT MANAGEMENT MODEL
If the CCPMM allows projects approved in the value buffer to be distributed on a timeline with aggressive lead time estimates for activities and these activities are scheduled around the key resource (311), and a pull trigger is introduced which is initiated by the key resource drawing of work from the final value buffer (312), then the effect will be that project work is drawn from the final value buffer from the main sources; and a pull trigger is initiated (313). If project work is pulled from the final value buffer by upstream (313) and a project from the upstream value buffer is released as a result of the downstream pull trigger (314), then the result will be that the buffer is refilled value as a result of the pull trigger only store the amount of work in the project phase equal to the size of the lower value buffer (315). Project work is pulled from the final value buffer from the main resources - the pull trigger (313) is initiated.
If project work for key resources fluctuates around the maximum level of the value buffer (320) and organizations can better respond to changing priorities in project work (321), the result will be increased production reliability for the system (325). CCMPM ensures that approved projects in value buffer have aggressive lead time estimates for activities and are planned around the most important resource (323).
CONCLUDING THE PROPOSED VISION FOR THE FUTURE
THE SIMULATION MODEL FOR THE PROPOSED INJECTIONS
- BACKGROUND
- THE RESEARCH METHODOLOGY
- RESEARCH INSTRUMENTS
- CONDUCTING A SUCCESSFUL SIMULATION STUDY
- THE SIMULATION SOFTWARE
- THE TYPE OF SIMULATION
- THE INPUT PARAMETERS
- THE INPUT SHEET AND LOGIC OF THE SIMULATION MODEL
- THE WARM UP AND RUN LENGTH OF THE SIMULATION
- SIMULATION AT AN IDLE STATE
- DATA GATHERING PROCESS
- CONFIDENCE LEVELS THROUGHOUT THE SIMULATION
- VERIFICATION AND VALIDATION
- CONCLUDING THE SIMULATION MODEL
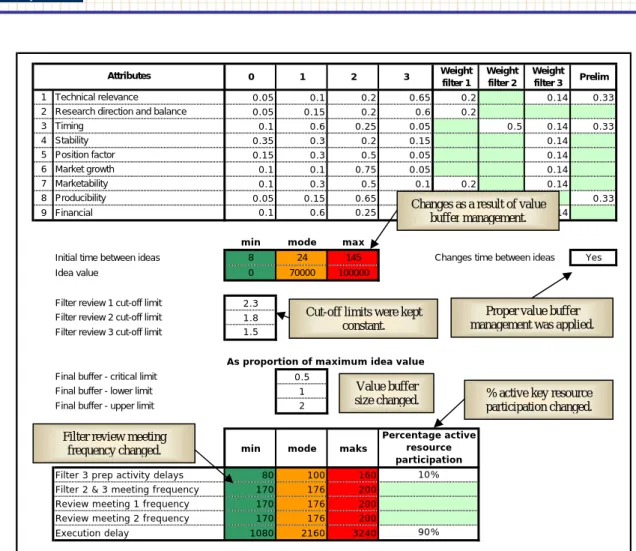
During a simulation run, the model manipulates the provisioning time according to the status of the value buffers. The value of the cut-off values in this study will be kept constant throughout the analysis process. For a test run, Figure 33 shows the difference between the executed value and the value of the opportunities waiting in the final value buffer after the simulation run.
This behavior of the simulation model is as expected and therefore validates the simulation model. The simulation model was validated in a second way by looking at the final status of the buffer value and comparing it to the replenishment time of the value buffer.

DATA ANALYSIS
- BACKGROUND
- DATA GATHERED
- THE DATA ANALYSIS
- CHANGING THE PERCENTAGE ACTIVE LIMITED RESOURCE PARTICIPATION IN THE VALUE ACQUISITION PROCESS
- DIFFERENT FILTER REVIEW MEETING FREQUENCIES
- ACTIVE FINAL VALUE BUFFER SIZING
- AN OPTIMUM MANAGEMENT SYSTEM
- HYPOTHESIS TESTING
- VAPOURIZING THE EC BY INDICATING THAT THE PREDICTED EFFECTS AS INIDICATED IN THE FRT ARE INDEED VALID
- CONCLUSION
In contrast, the value in the terminal value buffer remains more or less constant, regardless of the percentage of limited participation of resources in the two macro processes. The percentage difference between the output value and the value in the final buffer is expressed in Figure 37. Change in the active key resource participation in the value acquisition and value delivery process.
Change in the filter review meeting frequency, which is located in the value acquisition process. The key resource must be located in the last stages of the value chain, in this case after the final value buffer.
CONCLUSIONS AND RECOMMENDATIONS
- BACKGROUND
- RESEARCH RESULTS
- IMPLEMENTATION OF THE PROPOSED MANAGEMENT MODEL
- THE CONTRIBUTION TO THE PRACTICE
- MAJOR BENEFITS TO ORGANIZATIONS
- FUTURE RESEARCH
- FINAL THOUGHTS
The implementation of the injection (the stage-gate-buffer management model) is likely to be a lengthy and costly process. Successful implementation of the management model will depend on the team's commitment to the new project management model and their knowledge of the new model. The study concludes by proposing a number of research options that emerged during the development of the management model.
In reality, a first-in, first-out basis for projects will not be the order of the day. When properly managed, the value buffer concept ensures that project work is pulled through the system at the work rate of the system constraint, ensuring rapid project delivery, ultimately resulting in high-value projects.
APPENDIX A
RESULTS FOR THE OPTIMUM SIMULATION RUN
Stagger2Counter 0 Infinite Review2Meetings 0 Infinite Review1Count 0 Infinite PrelimCount 0 Infinite Review1Meetings 0 Infinite DesignCount 0 Infinite ValueExecuted 0 Infinite Ideas 36 Infinite ExecutedCount 0 Infinite. Stagger1Count 6 Oneindig Point3Fail 2 Oneindig Point1Pass 18 Oneindig Point2Pass 8 Oneindig Point3Pass 3 Oneindig. Stagger2Counter 5 Infinite Review2Meetings 215 Infinite Review1Count 5 Infinite PrelimCount 5 Infinite Review1Meetings 211 Infinite DesignCount 5 Infinite ValueExecuted 536120 Infinite Ideas 68 Infinite ExecutedCount 6 Infinite PointMeetings 210 Infinite Point1Fail 60 Infinite Point2Fail 2 Infinite Stagger1Count 5 Infinite Point3F ail 1 Oneindig Point1Pass 8 Oneindig Point2Pass 6 Oneindig Point3Pass 5 Oneindig.
Stagger2Counter 5 Infinite Review2Meetings 214 Infinite Review1Count 7 Infinite PrelimCount 5 Infinite Review1Meetings 210 Infinite DesignCount 5 Infinite ValueExecuted 432158 Infinite Ideas 116 Infinite ExecutedCount 5 Infinite 1 Point Infinite 10 Point Infinite 10 Point Infinite finite Stagger1Count 5 Infinite Point3Fail 0 Infinite Point1Pass 10 Infinite Point2Pass 6 Infinite Point3Pass 7 Uendelig. Stagger2Counter 5 Infinite Review2Meetings 207 Infinite Review1Count 3 Infinite PrelimCount 5 Infinite Review1Meetings 210 Infinite DesignCount 5 Infinite ValueExecuted 458635 Infinite Ideas 78 Infinite ExecutedCount 5 Infinite 1 Point Infinite 7 Infinite 1 Point Infinite 2 Stagger1Count 5 Infinite Point3Fail 0 Infinite Point1Pass 8 Infinite Point2Pass 4 Infinite Point3Pass 3 Uendelig.
APPENDIX B
RESULTS FOR A SIMULATION RUN WITH A LARGE VALUE BUFFER
Stagger2Counter 9 Infinite Review2Meetings 35 Infinite Review1Count 11 Infinite PrelimCount 8 Infinite Review1Meetings 35 Infinite DesignCount 8 Infinite ValueExecuted 770130 Infinite Ideas 297 Infinite ExecutedCount 9 Infinite PointMeetings 134 Infinite Point1Fail 261 Infinite Point2Fail 16 Infinite Stagger1Count 8 Infinite Point 3Mislukt 4 Oneindig punt1Pass 36 Oneindig punt2Pass 20 Oneindig punt3Pass 11 Oneindig. Review2Meetings 35 Infinite Review1Count 8 Infinite PrelimCount 6 Infinite Review1Meetings 35 Infinite DesignCount 6 Infinite ValueExecuted 90415 Infinite Ideas 201 Infinite ExecutedCount 1 Infinite PointMeetings 133 Infinite Point1Fail 183 Infinite Point2Fail 6 Infinite Stagger1Count 6 Infinite Point3Fail 1 Infinite Point1Pass 18 Oneindig Point2Pass 12 Oneindig Point3Pass 8 Oneindig. Stagger2Counter 14 Infinite Review2Meetings 35 Infinite Review1Count 9 Infinite PrelimCount 8 Infinite Review1Meetings 34 Infinite DesignCount 9 Infinite ValueExecuted 1258169 Infinite Ideas 188 Oneindig uitgevoerdCount 14 Infinite PointMeetings 137 Infinite Point1Fail 165 Infinite Point2Fail 12 Infinite Stagger1Count 7 In eindige Point3Fail 2 Oneindig Point1Pass 23 Oneindig Point2Pass 11 Oneindig Point3Pass 9 Oneindig.
Stagger2Counter 7 Review Infinit2 Encounters 34 Infinite Review 1Number 5 Infinite PrelimCount 7 Review Yes Infinite1 Encounters 35 Design Infinite Number 7 Value InfiniteExecuted 630797 Infinite Ideas 194 Executed InfiniteCount 7MeetFFinnit7 Point Infinite int2Fail 8 Infinite Stagger1Count 7 Infinite Point3Fail 2 Infinite Point1Pass 17 Infinite Point2Pass 9 Infinite Point3Pass 5 Infinite. Stagger2Counter 28 Infinite Review 2 Encounters 35 Infinite Review 1 Count 19 Previous Infinite 8 Infinite Review 1 Encounters 35 Infinite Design Count 18 Infinite Value Executed 2253747 Infinite Ideas 326 Infinite Executions Infinite Counts18Infinite142 3 Infinite Point2Failure 2 0 Infinite Stagger1Count 10 Points of Infinite3Fail 2 Point Infinite1Pass 43 Infinite.
![Figure 4: Generic Evaporating Cloud, adapted from Scheinkopf [41].](https://thumb-ap.123doks.com/thumbv2/pubpdfnet/8968343.42206/26.918.107.773.57.429/figure-generic-evaporating-cloud-adapted-scheinkopf.webp)
![Figure 6: Typical phases of opportunity to product development, adapted from Wheelwright and Clark [52]](https://thumb-ap.123doks.com/thumbv2/pubpdfnet/8968343.42206/33.918.143.786.575.951/figure-typical-phases-opportunity-product-development-adapted-wheelwright.webp)
![Table 2: Selected themes in outstanding development projects, adapted from Cooper [10]](https://thumb-ap.123doks.com/thumbv2/pubpdfnet/8968343.42206/35.918.104.834.620.812/table-selected-themes-outstanding-development-projects-adapted-cooper.webp)
![Figure 9: A generic stage-gate new product process, adapted from Cooper [10].](https://thumb-ap.123doks.com/thumbv2/pubpdfnet/8968343.42206/46.918.109.811.433.655/figure-generic-stage-gate-product-process-adapted-cooper.webp)