This report is a joint publication of the University of Cape Town's Poverty and Inequality Initiative (PII), the Southern Africa Labor and Development Research Unit (SALDRU) and Statistics South Africa. The aim of this report is to provide a profile of multidimensional youth poverty in South Africa and to map its distribution at the district level, using data collected by Statistics South Africa through the 2011 100% Census sample The second part presents the results for South Africa as a whole and then for each province and metropolitan municipality separately.
This report therefore presents a ward-level analysis of multidimensional youth poverty in South Africa using the recently developed Multidimensional Youth Poverty Index (Youth MPI)4. We use a 100% sample of the 2011 census to create maps for South Africa as a whole, as well as for each province and metropolitan municipality separately. In 2014, Statistics South Africa developed the South African Multidimensional Poverty Index (SAMPI), which measures multidimensional poverty among households in South Africa5.
Section 1: Constructing the Youth MPI
Data and unit of analysis
By separating the youth from the household, we assessed the individual hardships experienced by each youth, which may have differed from those of other members of the household. The Youth MPI therefore applies the narrower, international definition of youth than that of 15-2414. The analysis is limited to young people (aged 15-24) who live in either housing units or converted residences and whose usual place of residence is the housing unit in which they were enumerated.
Young people living in other types of housing16 did not receive the required set of census questions and were therefore excluded from the analysis. We also excluded young people whose usual place of residence was not the housing unit in which they were enumerated, as household information on their usual place of residence was not available. When the data from the individual records have been harmonized with the household records; and non-responses and missing values were removed, the sample yielded data for 8,044,807 youth aged 15–2417.
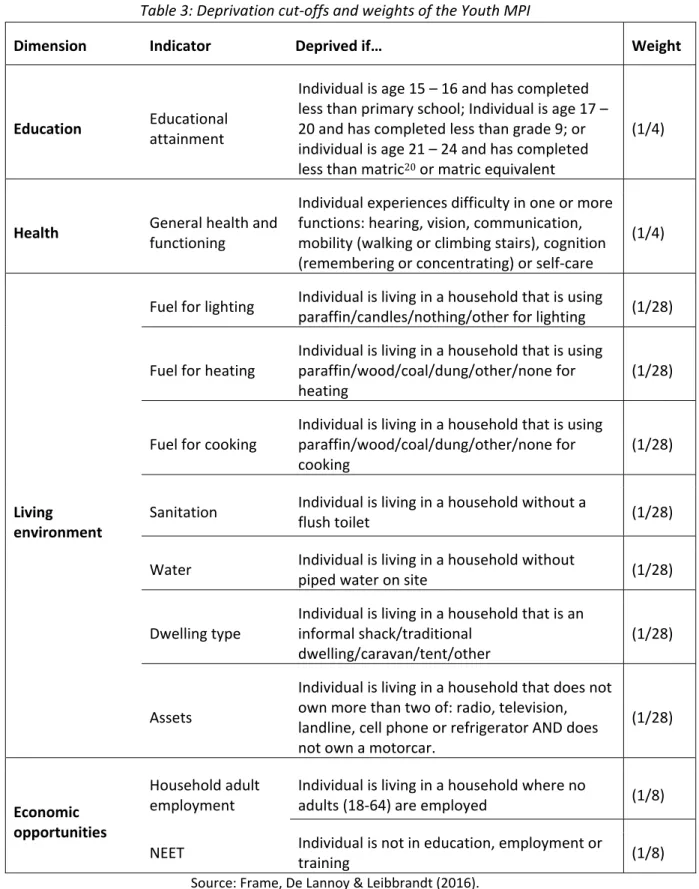
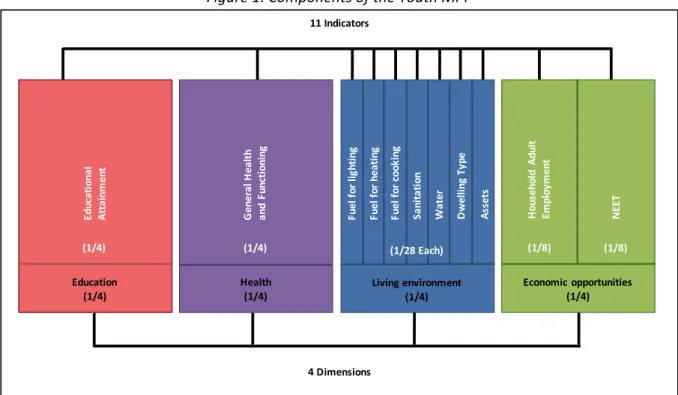
Components of the Youth MPI
In this report, we provide Youth MPI estimates for South Africa's 4277 constituencies15, in line with the wards created by the Municipal Demarcation Board for 2011. Individual is age 15 – 16 and has completed less than primary school; Individual is age 17 – 20 and has completed less than 9th grade; or individual is aged 21 – 24 and has completed less than matric20 or matric equivalent. Individual lives in a household that uses paraffin/wood/coal/dung/other/none for heating.
Individual lives in a household that uses paraffin/wood/coal/manure/other/none for cooking. An individual lives in a household that does not own more than two: radio, television, landline telephone, mobile phone or refrigerator AND does not own a personal car. 20 In the South African school system, matriculation is the final year of secondary school.
Deriving the Youth MPI measures
Creating ranks
Limitations
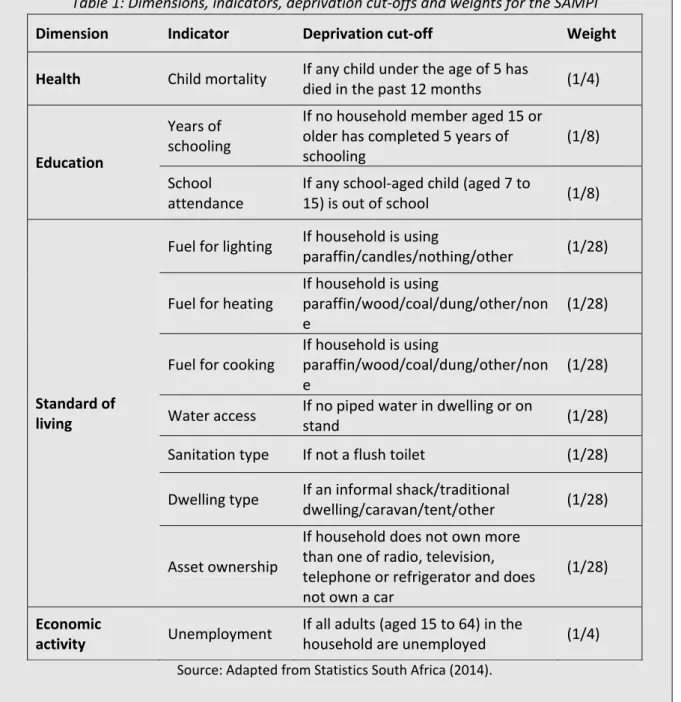
While the SAMPI uses child mortality as a single indicator of health, this is a household-level indicator that is not directly related to the health of an individual young person and was therefore not included in the MPI for youth. The only information about health in the youth population was captured in the module on general health and functioning, relating to an individual's hearing, vision, communication, mobility, cognition and self-care. This was the only health indicator included in the health dimension of the MPI for youth.
These wide variations may be problematic because wards with larger youth populations are likely to be underrepresented in the current analysis. It is possible that smaller groups of highly deprived young people will be hidden within certain wards by relatively lower levels of deprivation found in the same area. 25 These values have been adjusted to account for the underestimation recorded in the census.
Provincial estimates of the Youth MPI
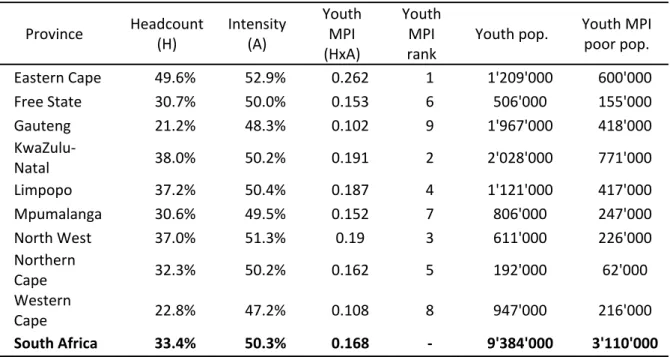
This difference resulted in a noticeably higher Youth MPI score for KwaZulu‐Natal (0.191) compared to Free State (0.153), and consequently a large difference in the ranking attributed to these two provinces (2 for KwaZulu‐Natal versus 6 for Free State). . Free State, Mpumalanga and Northern Cape have Youth MPI scores close to the national average. Remember that the Youth MPI score is the product of two measures: the poverty rate and the poverty intensity.
However, poverty intensity for North West (51.3%) was higher than Limpopo (50.4%), resulting in a higher overall youth MPI score for North West. However, when ranked by intensity or MPI youth score, North West is poorer than Limpopo. Regarding the MPI youth poverty population estimates in the last column of Table 4, many of the provinces with the highest youth poverty numbers also had higher numbers of poor youth.
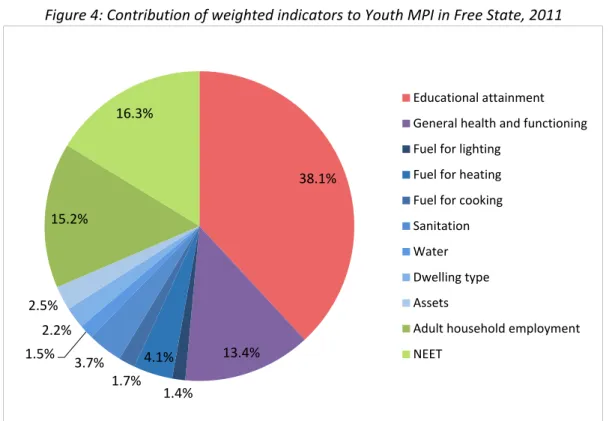
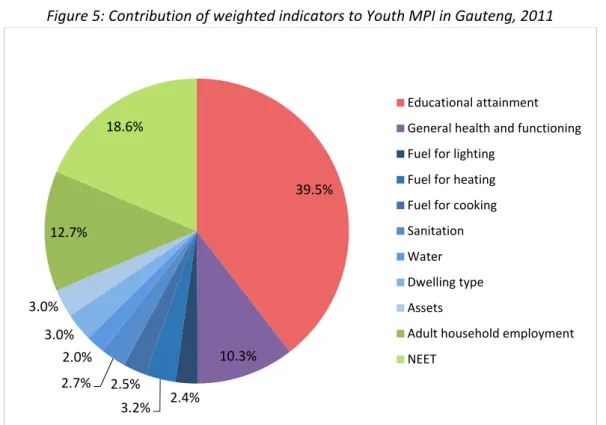
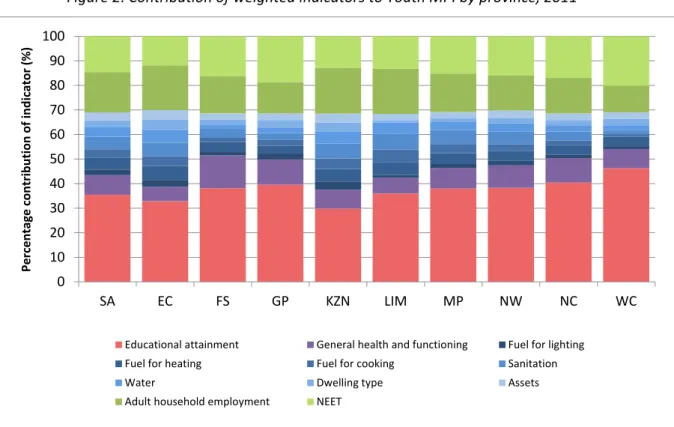
Composition of youth poverty in South Africa
31 In other words: disadvantage in educational level contributed 35.5% to the MPI score for young people, although it was given weight. Although educational disadvantage was the largest contributor to the MPI score for young people in all nine provinces, its relative importance varied widely. The contribution of deprivation to educational attainment tended to be greater in provinces with lower youth MPI scores (less poor), such as the Western Cape (46.3%), Northern Cape (40.4%) and Gauteng (39.6% ).
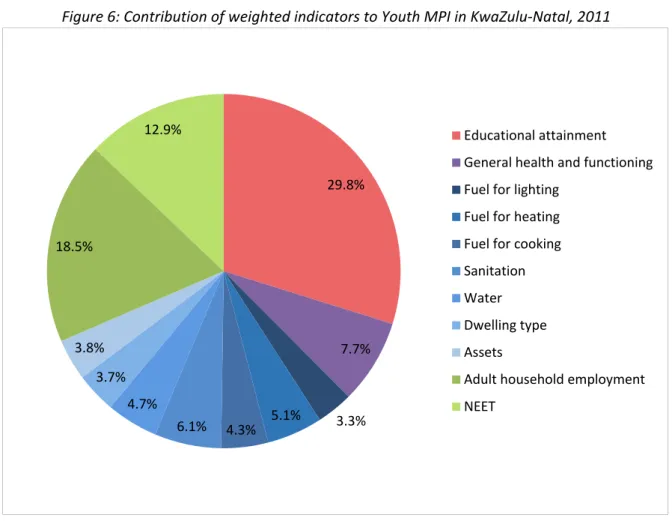
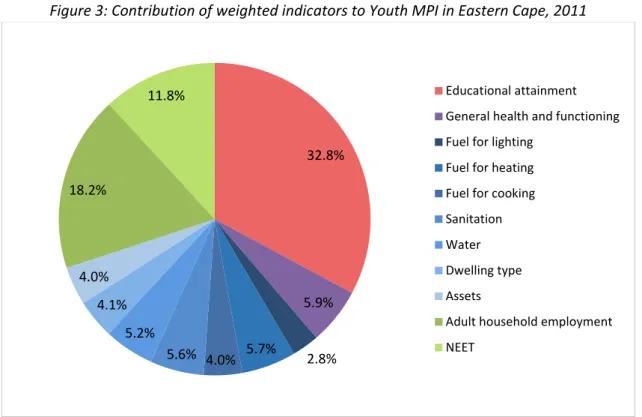
In contrast, deprivation contributed relatively less to this indicator in provinces with higher Youth MPI scores (worse), such as the Eastern Cape (32.8%) and KwaZulu-Natal (29.8%). The contribution of deprivation in the indicators of economic opportunity also tended to correspond to provincial youth MPI scores. Consider, for example, KwaZulu-Natal and North West: their Youth MPI scores were almost identical (0.191 and 0.190 respectively).
Mapping multidimensional youth poverty at the sub‐provincial level
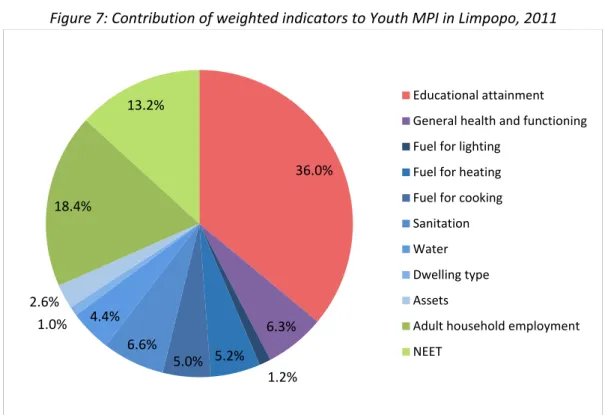
Among the less poor provinces of the Western Cape and Gauteng, deprivation in NEET played a relatively greater role than adult household employment in contributing to poverty. However, in the poorest provinces of the Eastern Cape, KwaZulu-Natal and Limpopo, deprivation in adult domestic work was a relatively greater contributor than NEET. In some cases, the composition of youth poverty even varied between counties with similar Youth MPI scores.
While lack of education contributed more to youth poverty in the North-West (38.3%) than in KwaZulu-Natal (29.8%), the contribution of living environment indicators combined was significantly higher for KwaZulu-Natal (31.0%) than in the northwest (22.4%). %). However, the greatest difference in staff numbers occurred at departmental level (Map 3), where scores ranged from 0% to 100%. These smaller areas of disadvantage are not detectable at the provincial or even municipal level, as scores over a larger area tend to average out the presence of smaller areas with particularly high scores.
Thus, capturing geographic variation at the sub-area level enables the identification of pockets of high youth poverty that are not discernible at higher levels of aggregation, but which clearly need targeted policy support. Like map 3, map 4 shows the multidimensional number of youth poverty at the neighborhood level, but overlays previous state boundaries in blue. This map shows that the wards with the most extreme rates of youth poverty (in dark red on the map) corresponded very closely to the rural and former homeland regions of the Eastern Cape, KwaZulu-Natal and the North West.
However, while youth poverty rates in these urban enclaves were high, they were significantly higher in rural and former homeland regions.
Provincial youth poverty profiles at ward level
- Youth poverty profile: Eastern Cape
- Youth poverty profile: Free State
- Youth poverty profile: Gauteng
- Youth poverty profile: KwaZulu‐Natal
- Youth poverty profile: Limpopo
- Youth poverty profile: Mpumalanga
- Youth poverty profile: North West
- Youth poverty profile: Northern Cape
- Youth poverty profile: Western Cape
The biggest contributor to multidimensional youth poverty in the province was educational attainment (40%) and adult household employment (19%). Pockets of high youth poverty (headcounts between 40% and 60%) were located in Thembisa in the north. Deprivation in educational attainment and adult household work contributed the most to multidimensional youth poverty in the province (30% and 18% respectively).
Lack of educational attainment and adult employment contributed the most to multidimensional youth poverty in the province (38% and 16% respectively), followed closely by NEET (15%). Lack of educational attainment and NEET contributed the most to multidimensional youth poverty in the province (38% and 16% respectively). Notably, the biggest contributors to multidimensional youth poverty in the province were education level (40%) and NEET (17%).
Conclusion
Importantly, while a selection of wards in the Central Karoo and Eden districts had higher numbers of youth poverty and sometimes covered large geographical areas, many had relatively small youth populations50. It was clear from the map that many of the wards where youth poverty was highest were clustered towards the south-eastern periphery of the city. Youth poverty was also particularly high in parts of the northern and southwestern periphery of the city, including parts of Khayelitsha, Crossroads, Nyanga, Philippi, Gugulethu, Mfuleni, Manenberg, Langa and Delft.
Youth poverty was also particularly high in parts of the city's northern and southwestern peripheries, namely in the areas of Doornbach, Dunoon and parts of Hout Bay. As expected, the lowest levels of youth poverty were concentrated around the city center and areas close to the centre, as well as in Somerset West on the south-eastern edge of the metropolis. At the provincial level, the Eastern Cape, KwaZulu-Natal, North West and Limpopo had the highest youth MPI scores, each with a multi-dimensional number of young people in poverty above the national average.
Importantly, however, the composition of youth poverty across provinces varied significantly, suggesting that provinces should direct their policies and efforts towards different deprivations, depending on the extent to which they are contributing to multidimensional youth poverty. youth. The compiled results showed the highly uneven spatial distribution of multidimensional youth poverty across neighborhoods, within the 9 provinces and within each of the 8 metropolitan municipalities. More specifically, the analysis allowed the identification of several pockets of extreme youth poverty across the country.
Taken together, the findings presented in this report illustrate the utility of the youth MPI as a tool to inform and target policies and interventions targeting youth. In addition, the analyzes of the composition of the Youth MPI, which show which particular deprivations contributed the most to multidimensional poverty among young people, can direct efforts towards the deprivations that constitute the most urgent needs among young people. The fine-grained picture these findings provide of the needs of young people within specific areas or communities will allow for a more precise translation of youth development policies into interventions and programs at the local level.
Future analysis will focus on disaggregating youth MPI by gender, race, and rural-urban divides.