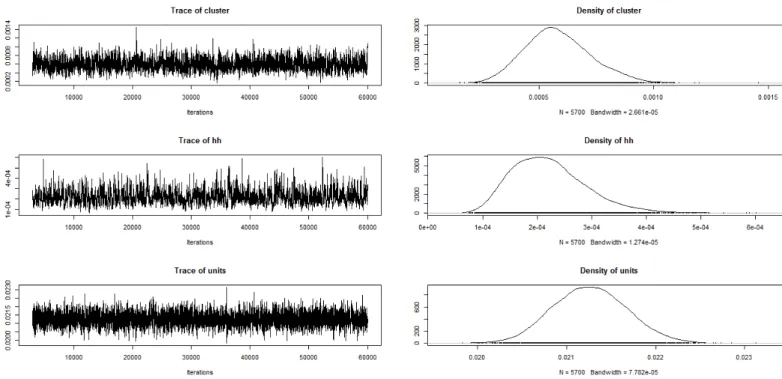
However, the influence of socioeconomic status was different for male and female populations. 108 6 Posterior distribution of variance component for male data 109 7 Posterior distribution for male data.
Background
There are other factors, such as educational attainment, occupation, and media exposure, that may influence risk-taking behaviors and also lead to increased risk of HIV infection. It has been argued that having simultaneous sexual partners in a dense sexual network increases the risk of HIV infection by allowing the virus to spread rapidly to others.
Country profile
The Ethiopian Ministry of Health Policy focuses on preventing the spread of the disease rather than finding a cure [109,113]. To keep this agenda active, the department's primary focus is therefore to identify the main factors or causes behind the spread of HIV/AIDS in the country and then take measures based on its findings to prevent further spread of the disease.
Knowledge and misconceptions about HIV in Ethiopia
Small surveys carried out in different settings also reveal the presence of misconceptions among different sections of the Ethiopian population, [16] for example interviewed 1214 students at Addis Ababa University and found that, despite a high level of knowledge about HIV/AIDS, 34% of the students still considered vaccination as one of the ways of HIV transmission. All the above research results testify to the fact that there is still a low level of HIV awareness and a low level of knowledge in Ethiopia regarding HIV prevention and transmission.
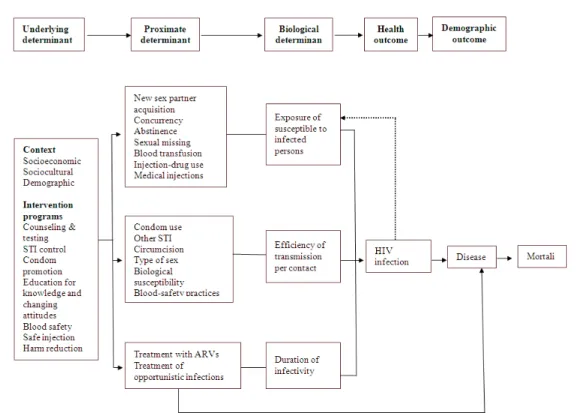
Theoretical framework
Sexually transmitted diseases (STDs) are involved in factors that increase both biological exposure and transmission efficiency of viruses. Education affects the proximate determinants by making individuals aware of how to protect themselves from various types of diseases.
Statement of the problem
As a result, they are not exposed to all the known risk factors for HIV infection [72,73]. It is understood that there is a direct relationship between individual behavior and individual sexual practices that affect HIV infection [28, 43].
The objectives of the study
Significance of the study
Sample design
Layout of the thesis
The research contributions
Failure to account for the stratification in the analysis can lead to overestimation of the standard error, and thus too wide a confidence interval. In general, failure by a data analyst to account for clustering in the analysis can lead to underestimation of variability and incorrect conclusions.
Model description
The unequal selection probabilities inherent in the design of these surveys should be taken into account in the analysis to reduce bias in estimates and underestimation of variabilities. The model must be transformed to a linear model using an appropriate connection function and the mean of the distribution that provides the relationship between the linear predictor.
Estimation Methods
Parameters estimation
To obtain the unknown parameters, we need to differentiate the log of the likelihood with respect to βββ to obtain the following equation. After simplifying the previous equation, we get the following equation, which is called Fisher's information.
Approximate covariance matrix
The log-likelihood function underlying maximum likelihood estimation is given by Using the results obtained in [56], it follows that in one-stage sampling with replacement (WR) or without replacement (WOR).
Conclusion
The aim of this article is to identify key demographic, socio-economic, socio-cultural, behavioral and proximate determinants as risk factors for HIV prevalence among men and women in Ethiopia. This study used data from the 2005 Ethiopian Demographic and Health Survey to identify key demographic, socio-economic, socio-cultural, behavioral and proximate determinants as risk factors for HIV prevalence among men and women in Ethiopia.
Introduction
Standard statistical methods are not suitable for analyzing complex survey data because of the clustering and stratification used in survey design. The difference between them is that geodetic logistics takes into account the complexity of the survey design.
Methodology
Data
Sampling design is generally ignored in statistical analysis of the survey data, mainly because of the possibility of including in the model specifications with certain characteristics of the sampling design. Some adaptations to the classical methods that do not take into account the survey design are therefore necessary to make valid inferences from the survey data [33].
Covariates
Based on factor scores, respondents were classified as having low, medium, or high HIV-related stigma. The decision-making index was calculated based on the respondents' answer to the questions: Final say about own health care, final say about large household purchases, final say about household purchases for daily needs, final say about visits to family or relatives. , last says about food to be cooked every day, and last says about what to do with money man earns.
Analysis plan
An index of media exposure was also calculated using PCA based on responses to questions asked about frequency of watching television, frequency of listening to radio, and frequency of reading newspapers. The decision-making index was a trichotomous variable with levels defined as independent, consulted, and subordinated.
Results
Summary statistics
Logistic regression results
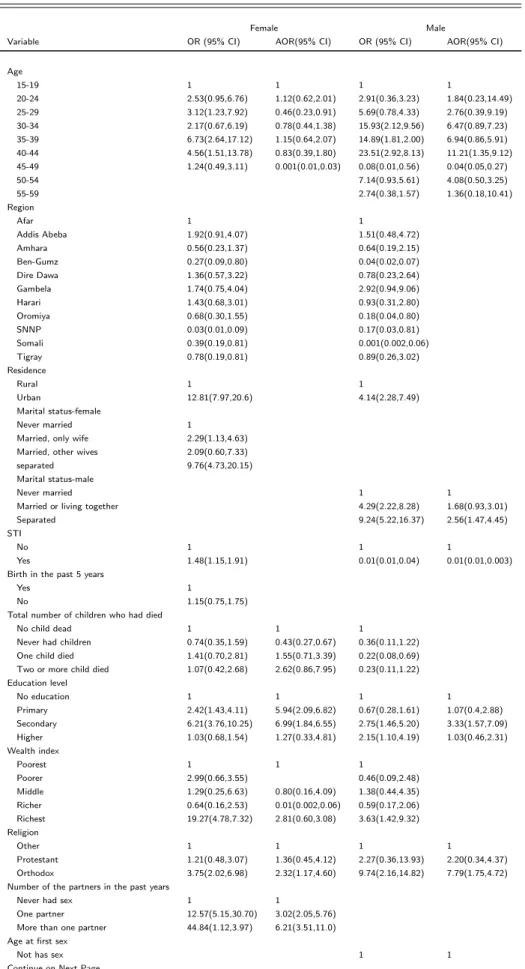
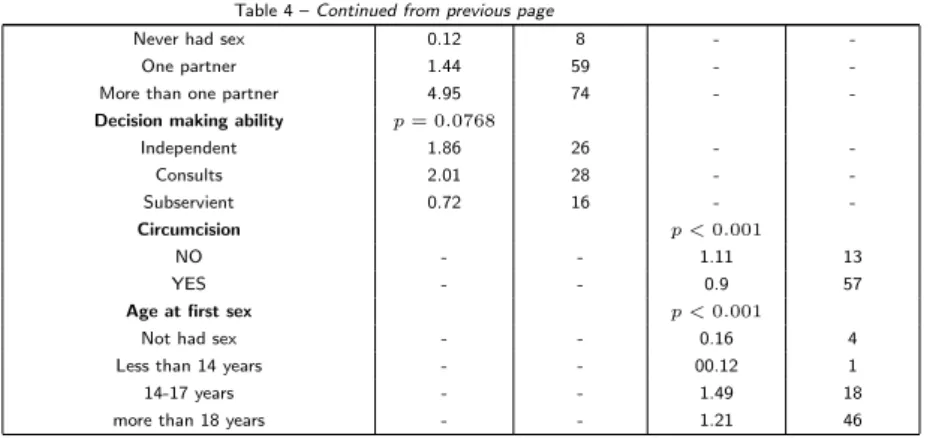
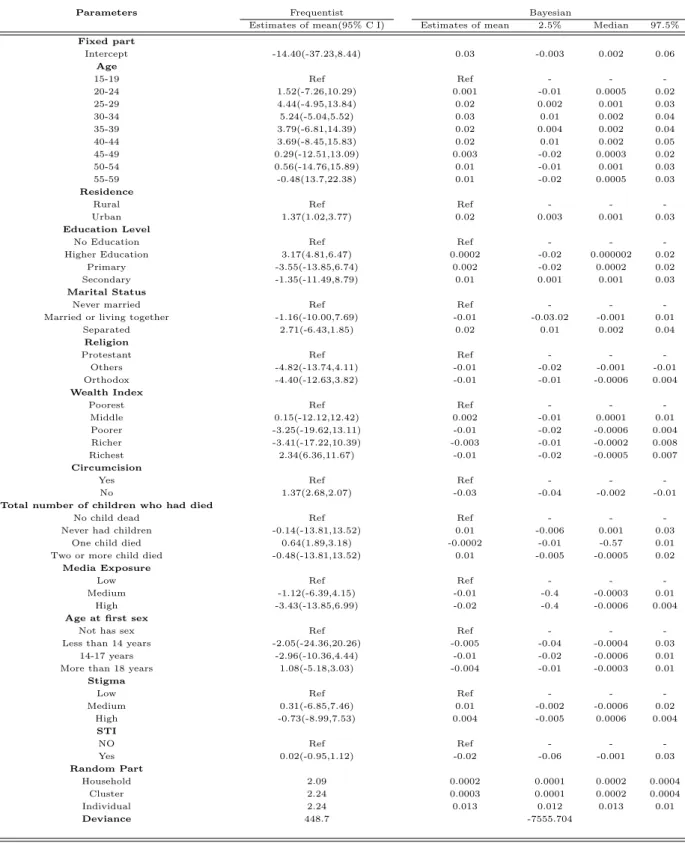
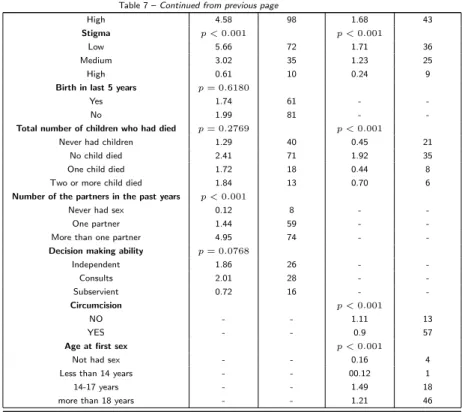
Men living in urban areas are four times more likely to be positive compared to men living in urban areas. Men who are uncircumcised are almost 1.5 times as likely to be HIV positive as circumcised men.
Discussion and Conclusions
A study found that divorced women and men were more likely to be infected with HIV [111]. In addition, the study elaborates on the spread of HIV infection in Ethiopia.
Multilevel model description
The purpose of this chapter is to introduce and examine key statistical properties of multilevel models and then discuss how parameter estimation and inference were performed.
Estimation Methods
Maximum Likelihood Estimation(ML)
By combining Fisher scoring with the EM algorithm, relatively fast convergence can be achieved while avoiding unacceptable variance and covariance estimates. Fixed effects and variance parameter estimates are also asymptotically efficient, meaning that ML estimates will show the smallest sample-to-sample variance when the sample size is large [123].
Restricted Maximum Likelihood Estimation(REML)
Furthermore, under general conditions, the fixed effects are unbiased [88, 89], the estimates of the variance components are asymptotically unbiased [123], and as the sample size increases, the sampling distribution of the estimates becomes approximately normal [123]. When the sample size is small, the ML and REML estimates are questionable, which may lead researchers to consider alternative methods.
Penalized Quasi Likelihood(PQL)
Algebraically rearranging this equation so that all known quantities are on the left side of the equation produces This equation has the same form of the well-known two-level hierarchical linear model Yij∗(s) =XXX0ijβββ+zzz0ijuuuj +ij, (4.11).
Bayesian Multilevel Model
Introduction
Bayesian Updating
Nevertheless, many problems still remain in the application of sampling-based techniques, such as achieving convergence and the choice of efficient sampling methods. Classical analysis via maximum likelihood focuses on the probability p(yyy|θθθ) without introducing a prior, while a full Bayesian analysis updates the prior information about θθθ with information in the data.
Monte Carlo Markov Chain (MCMC) Techniques
Monete Carlo Markov Chains (MCMC) Sampling Algorithm
The algorithm works most successfully when the proposal density matches, at least approximately, the shape of the target density p(θθθ|vv). Gibbs sampling is a special componentwise M-H algorithm, where the proposal density for updating eθθθj is p(θθθ∗j|θθθ[j]) such that proposals are accepted with probability 1.
Monte Carlo Markov Chains(MCMC) Convergence
Ideally, the burn-in period is a short initial series of samples where the effect of the initial parameter values decreases; An advantage of the Bayesian approach is that the uncertainty of the parameter estimates is taken into account when simulating the posterior distribution.
Gibbs sampling
Each residualuuuj is assumed to have a prior distribution uj ∼ N(0, σ2u) leading to the following posterior distribution, where nj is the number of level 1 units in the jth level 2 unit. When there are p(> 1) random coefficients, we must sample a new covariance matrixΩΩΩu; corresponding to the two choices for a single variance is a uniform prior over the space of covariance matrices or an inverse Wishart prior.
Estimation method for Bayesian multilevel
A minimally informative or maximally diffuse choice for the prior would be to take υp equal to the order of ΩΩΩu and Sp equal to a value chosen to be close to the final estimate multiplied by υp; we can usually use maximum likelihood or an approximate maximum likelihood estimate for Sp which is also used for MCMC starting values. A Bayesian formulation for multilevel models combines prior information about fixed and random effects with data-driven likelihood.
Advantages of the Bayesian approach over a frequentist approach
Advantages of the frequentist approach over the Bayesian ap-
This section lists the advantages of the frequentist approach over the Bayesian approach. Simple frequentist models can be run in minutes, while the same model in the Bayesian approach can take a week.
Conclusion
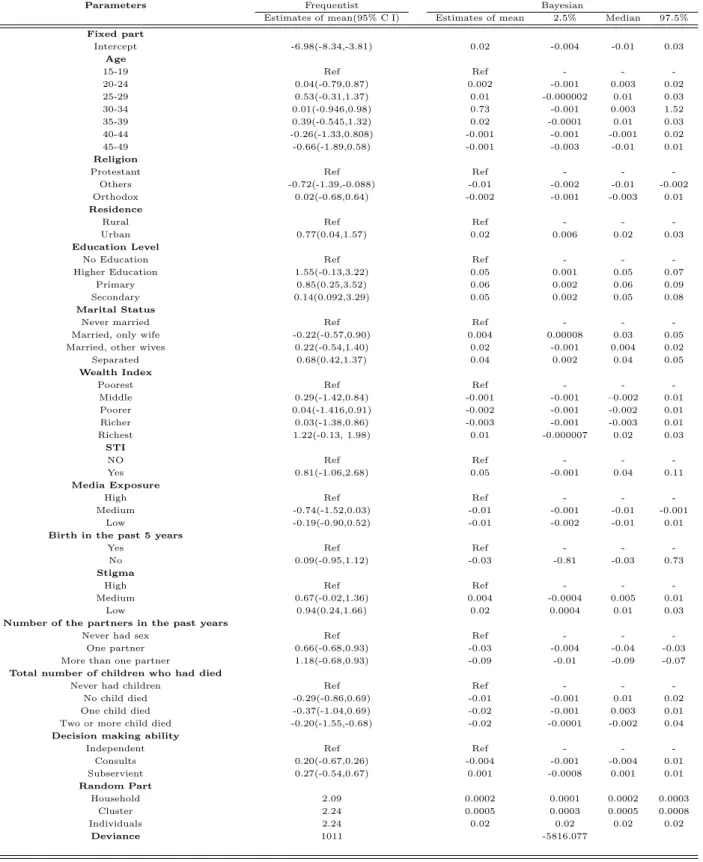
This chapter is a stand-alone research paper on application of the Multilevel modeling to HIV incidence data in Ethiopia. The aim of this paper was to model the HIV incidence data by comparing two paradigms of the multilevel modelling, namely the frequentist and the Bayesian approaches and the finding.
Methodology
Data
- Covariates
Stigma related to AIDS has been defined as “the prejudice, discounting, discrediting and discrimination directed against people who are perceived to have AIDS” [ 64 ]. A media exposure index was also calculated using PCA based on responses to questions asked about the frequency of watching television, the frequency of listening to the radio, and the frequency of
Results
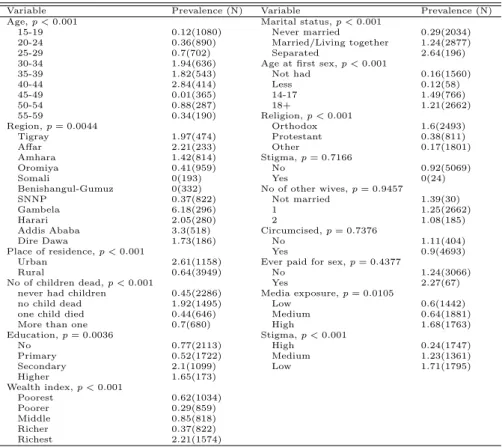
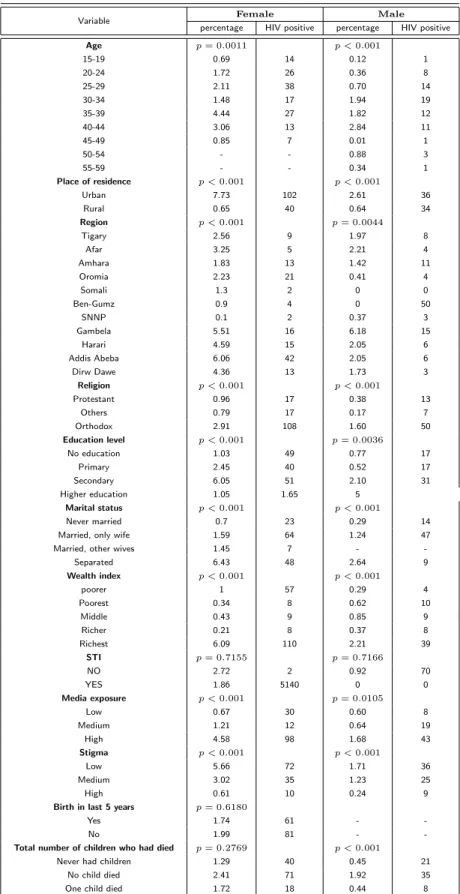
Summary statistics
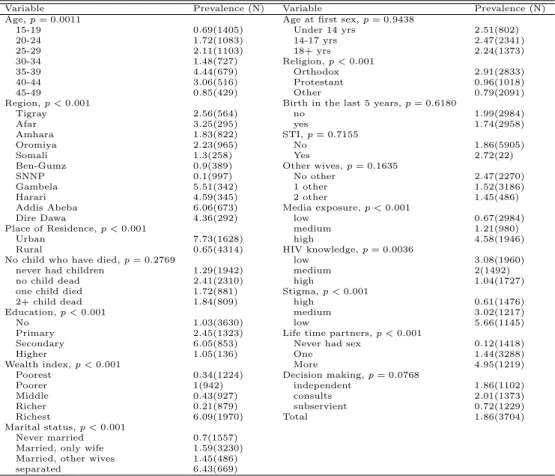
With regard to the wealth index for both men and women, the highest prevalence is found among the richest and Regarding media exposure, the prevalence among men and women, respectively, is among those with high media exposure.
The female data analysis results
The male data analysis results
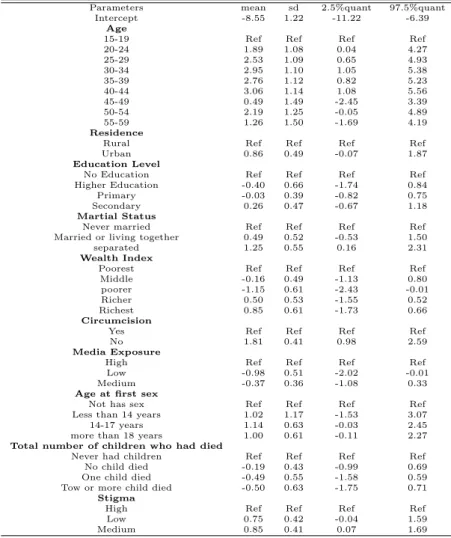
Regarding marital status, divorced men are almost 15 times more likely to be HIV positive compared to those who have never married. The reported STI in the past year is not significantly related to HIV-related serostatus for men.
Discussion and Conclusions
The other critical issue in multilevel models is the model development and specification and the selection of the predictors, which is a critical part of the study design [102]. These issues represent a challenge in spatial modeling due to the strength of maps as a presentation medium.
The Spatial Models description
Conditional Auto-Regressive (CAR) Model
The necessary and sufficient condition for (6.6) to be a valid joint probability density function is that the covariance matrix must not only be symmetric but also positive definite. For Xi to be Gaussian random variables, we defined a symmetric weighted adjacency matrix WWW, where.
Convolution spatial models
Then the joint probability density function of (6.12) can be written in a more compact form as follows: This property can be corrected with the parameterρ. and choose ρ so that Σ−1Dx is nonsingular, preferably with ρ ∈. lt; λn are the ordered eigenvalues of Σ−1DwWWWΣ1/2Dw.
The Integrated Nested Laplace Approximation
MCMC approaches
A common inference approach for latent Gaussian models is Markov chain Monte Carlo (MCMC). A common approach to (attempt to) overcome this first problem is to construct a joint proposal based on a Gaussian approximation of the full conditional xxx.
INLA
One suggestion is to use the one-block approach: make a proposal forθθθ toθθθ0, updatexxx from the Gaussian approximation conditional onθθθ0 and then jointly accept/reject. Despite all these developments, MCMC remains painfully slow from the end user's point of view.
The model selection Criteria
Where D is the calculated deviation in the posterior mean of the parameters and p is the number of parameters.
Conclusion
This Chapter stands alone as a research paper on the application of the spatial analysis and modeling of HIV prevalence data using Integrated Nested Laplace Approximation technique. Most of the people now living with HIV/AIDS (95%) live in low- and middle-income countries, which are also where most new HIV infections and AIDS-related deaths occur [50, 143].
Methodology
Data
- Covariates
Principle component analysis (PCA) [ 48 ] was used to generate the stigma, media exposure and the ability of decision making. The decision-making index was calculated based on the respondents' answer to the questions: Final say about own health care, final say about large household purchases, final say about household purchases for daily needs, final say about visits to family or relatives. , last say about food to be cooked every day, and last say.
Summary statistics
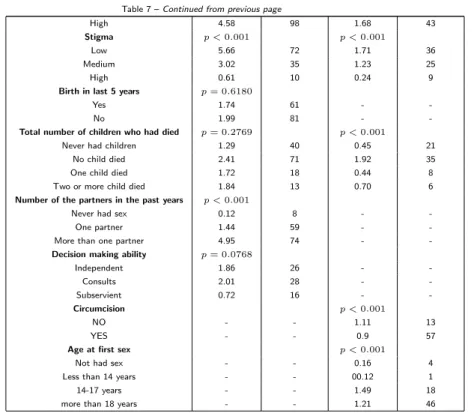
In terms of education level, the highest prevalence was found among those with the highest level of education, followed by those with higher education for both men and women. In terms of wealth index, both men and women find the highest prevalence among the richest, respectively.
Results
Results of the female data
Regarding marital status, divorced women are twice as likely to be HIV positive as those who have never married. Those women with more than one partner are 22 times more likely to be HIV positive than those who have never had sex.
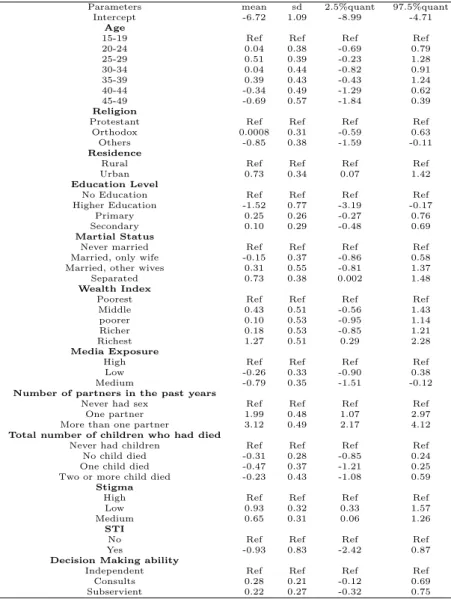
Results of the male data
Those with secondary education are 1.3 times more likely to be HIV positive than those with no education. Figure (3) presents maps of the posterior mean, median, lower quantile and upper quantile and for the male data.
Discussion and Conclusions
The risk of HIV infection among rural women and men is almost identical, while urban women are more than three times as likely as urban men to be infected. The study provides a closer look at the distribution of HIV infection in Ethiopia, specifically in relation to the different regions.
Limitations of the research and future work direction
The Data Limitation
In summary, the HIV prevalence estimate obtained from the ANC surveillance survey appears to have overestimated HIV prevalence among women in the general population. Patterns by age and urban/rural residence suggest potential sources of bias in ANC estimates.
Methodological limitations and future direction
Figure (6) shows the posterior distribution of the random effect part of the model for men, based on the analysis of 60,000 iterations, a burn-in period of 2000, and with thin=10 in MCMCglmm. Figure 7 shows the posterior distribution of the fixed effect part of the model for men, based on the analysis of 60,000 iterations, a burn-in period of 2000, and with thin=10 in MCMCglmm.