151 Figure 6.5: Log odds associated with rapid diagnostic test and age for women. respondents with a source of drinking water. 180 Figure 7.4: Log odds associated with rapid diagnostic test and age for women. respondents with room floor material.
Introduction
Jima et al., 2010) examined the coverage and use of major malaria prevention and control interventions in the Malaria Indicator Survey 2007 in Ethiopia. Therefore, the review section of this thesis identified the need for an in-depth study to identify the socio-economic, demographic and geographical factors that thus lead to the reduction of the risk of malaria.
The data
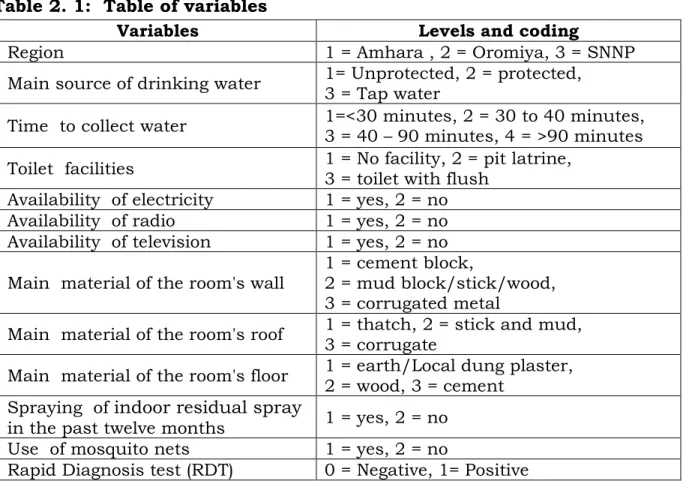
Variables of interest
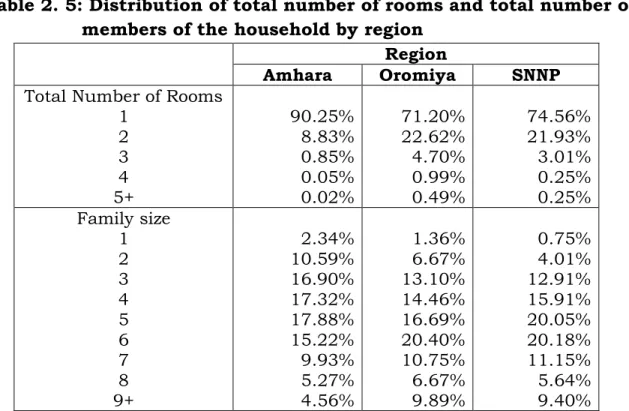
17 following: main source of drinking water, time taken to fetch water, toilet facilities, availability of electricity, access to radio and television, total number of rooms, main construction material of the walls of the room, main construction material of the roof of the room and main building material of the room floor, incidence of indoor residual spray in the past twelve months; use of mosquito nets and total number of nets. Of these variables, age and gender were collected at the individual level, while altitude, main source of drinking water, time taken to fetch water, toilet facilities, availability of electricity, radio, television, total number of rooms, main construction material of walls , roof and floor, the incidence of indoor residual spraying and the use of mosquito nets were all collected at the household level.
Baseline characteristics of the study population
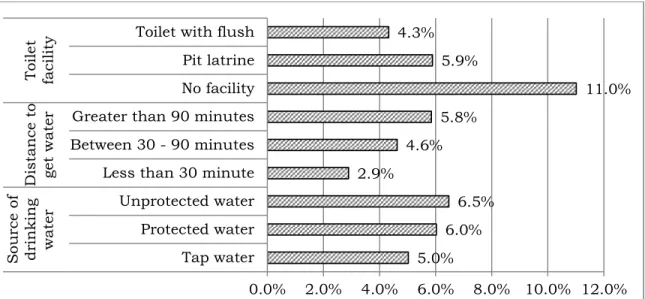
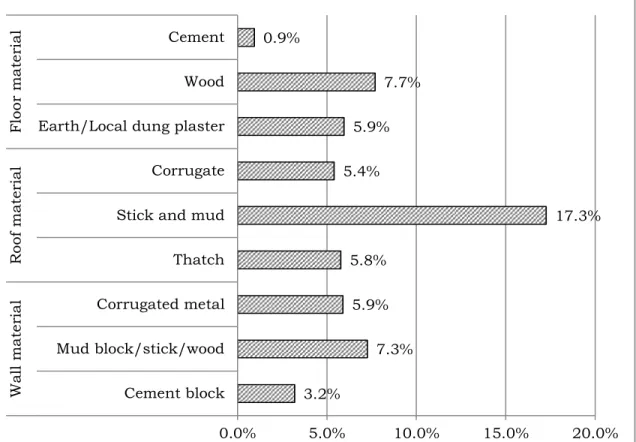
In addition, the distribution of positive RDT results by toilet facility, drinking water source and distance to collect water is shown in Figure 2.2. 21 The distribution of the positive RDT result across the wall, roof and floor materials of the house is shown in Figure 2.3.
Summary
Correspondence analysis
- Introduction
- Review of Multiple Correspondence Analysis (MCA)
- Application of multiple correspondence analysis
- Summary and Discussion
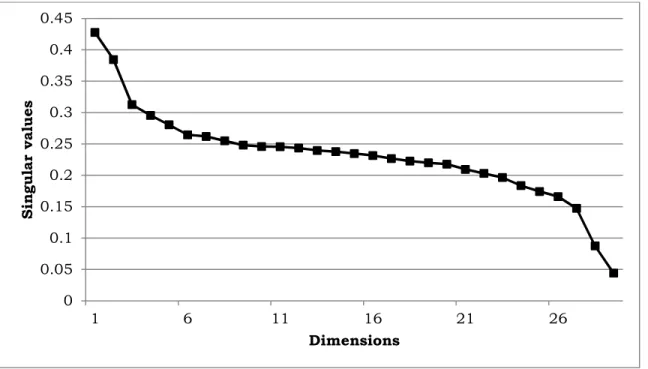
The interpretation of the correlation relations can be simplified for the matrices 7 and /∗ by rotation (Greenacre, 2000). The singular values can be interpreted as the correlation between the rows and columns of the contingency table.
Prevalence and risk factors of Malaria in Ethiopia using
Introduction
Generalized Linear Model
Therefore, the generalized linear model can be expressed in terms of an inverse link function. Therefore, the generalized linear model for the entire data set can be expressed as an additive form as follows.
Estimation in Generalized Linear Models
48 introduced generalized linear models and their second edition in 1989 (McCullagh and Nelder, 1989) serves as the standard monograph on generalized linear models. The initial solution to the equations is guessed and then updated until the iterative algorithm converges to the solution β, called the maximum likelihood estimate of o. The Fisher and Newton-Raphson scoring methods are the two most popular and widely used iterative algorithms for maximum likelihood estimation.
The Newton-Raphson method solves maximum likelihood estimates iteratively using standard least squares methods (Agresti, 1990, McCullagh, 2008).
Survey logistic regression for binary data
The variance estimate of the general estimator is adapted from the Taylor series expansion. Summary findings for the comparison of variance estimation methods are presented in (Wolter, 1985). AIC and SC criteria will be used to test model fit.
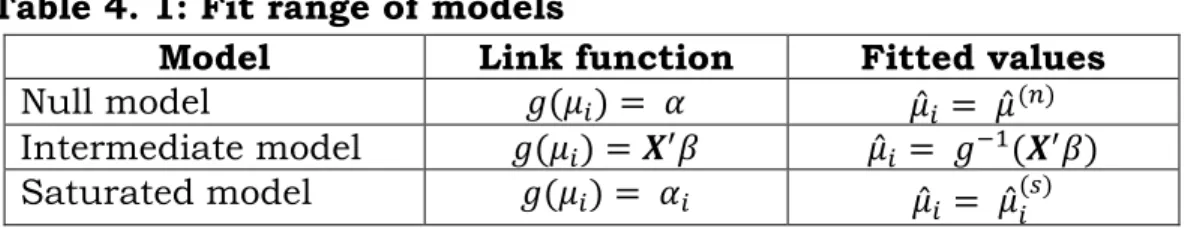
63 where l(μS, ψ; y) is the log-likelihood under the current model, lWμS(Ñ), ψ; yY is the log-likelihood under the maximally achievable (saturated) model, μS is the MLE of the intermediate model, and D∗(y; μS) is called the deviation of the intermediate model.
Data analysis using survey logistic model
68 source of drinking water; gender and main material of the floor of the room; and gender and use of indoor residual spray. Main source of drinking water and main material for the roof of the room (ref. Protected water & cement block). Gender and main source of drinking water and main material of the roof of the room (ref. Man & protected water).
The use of mosquito nets and the application of indoor residual spray to the walls of the house changed the risk of malaria.
Introduction
This can overcome the overdispersion of the data and at the same time take into account the heterogeneity of the population. Therefore, the addition of random effects allows correlation adjustment in the context of a broad class of models for non-normally distributed data.
Generalized linear mixed models (GLMMs)
These points are the distribution of the data, the mean function to be modeled, and the predictors. Conditional on the random effects ò, the elements of all 7 are assumed to be independent, according to the generalized linear mixed model, but the linear predictor is extended with the subject-specific regression parameters ò.
Estimation and prediction of the fixed and random effects
In linear mixed models, estimation of parameters is based on the marginal likelihood of the data and can be evaluated analytically (Jiang, 2007). This expression can be integrated as integrating the mean parameter o out of the likelihood function. Afterwards, a maximization of the likelihood can be found given the working values of parameter estimates in the M step.
Therefore, the random effects of GLMMs can be treated as missing values and the EM algorithm applied.
Evaluation of malaria rapid diagnosis test using GLMMs
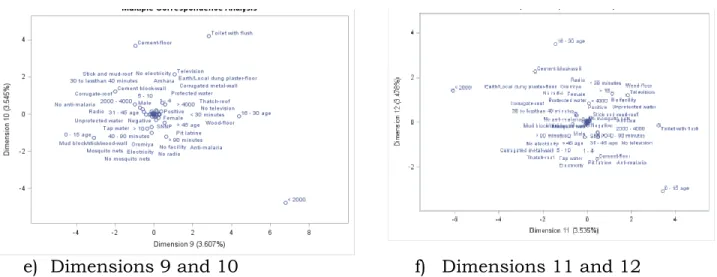
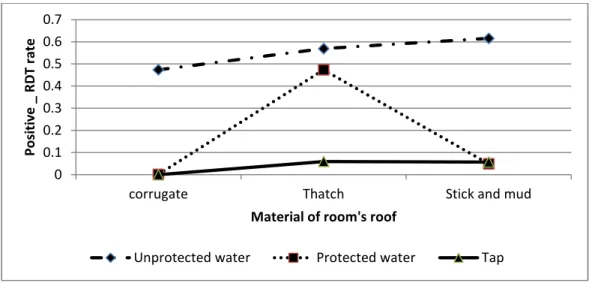
From these main effects, the following were involved in the interaction effects: main source of drinking water; time to collect water; availability of electricity; the main building material for the wall space, the roof and the floor; occurrence of indoor residual spray;. Interaction effects between the main water source and the main construction material in the roof of the room are shown in Figure 5.4. The other two-way interaction effect that is significant is between the time taken to collect water and the main construction material of the floor of the room (Table 5.1).
The relationship between the main room floor construction material and gender for a household is shown in Figure 5.6.
Summary and discussion
However, the risk of malaria was found to be much lower for individuals as the number of nets increased (Figure 5.10). On the other hand, more mosquito nets over beds have been found to be one way to reduce the risk of malaria. The incidence of malaria was found to be lower for households with access to clean water.
Therefore, a house with a corrugated iron roof has been found to reduce the risk of malaria.
Spatial distribution of malaria problem in three regions of
Introduction
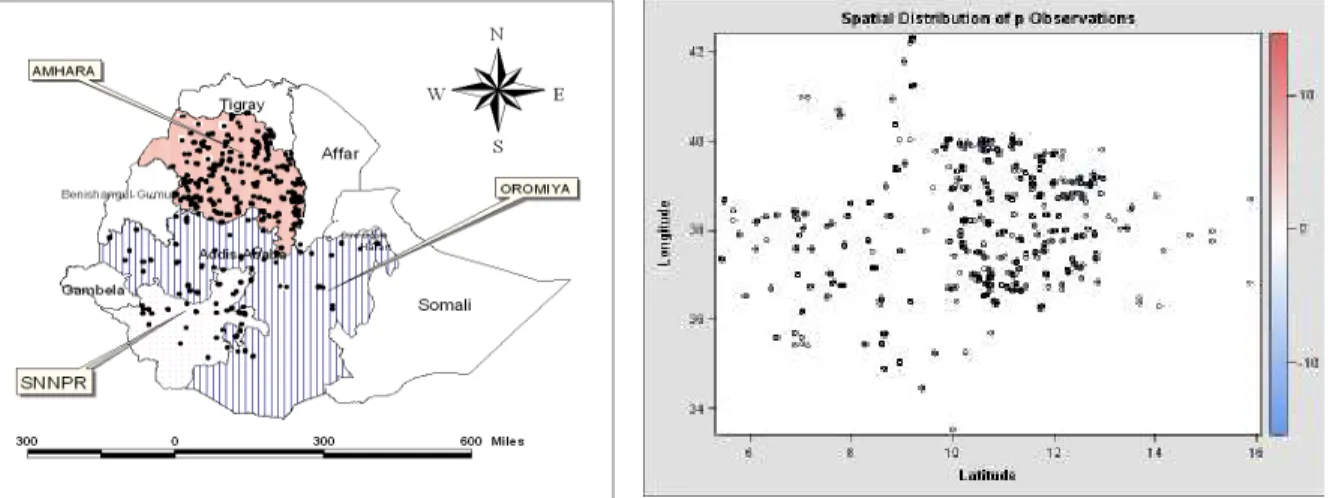
To model the spatial variation of the disease, as well as the relationship of malaria with socio-economic, demographic and geographic factors and the health care system, GIS technology is an important tool (Craig et al., 1999, Schellenberg et al., 1998) . Point model data: - The occurrence of the event response is often fixed and only the places where it occurs are considered random. Of these, the geostatistical approach is the most important for epidemiological analysis which is performed at the landscape scale and based on remote sensing (Chiles and Delfiner, 1999, Goovaerts, 1997, Goovaerts et al., 2005).
Therefore, the purpose of this chapter is to review the theory of spatial statistics and then apply it to malaria RDT data.
Models for spatial correlations
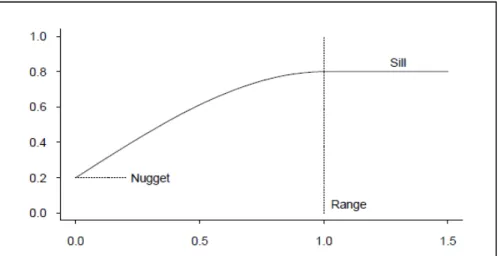
This is of the "nugget/range/sill" form which is often considered a realistic and interpretable form for a semivariogram. This is simpler in functional form than the spherical case (and valid for all d), but without the finite range of the spherical form. The shape of the semi-variograms is as shown in Figure 6.1 (Clay and Shanahan, 2011).
Furthermore, based on Bochner's theorem, the left-hand side of the above relation is the variance.
Estimation
One of the drawbacks to using the MoM method is that it is not robust to the external value of . Compared to Cressie's WLS procedure, the sampling properties of maximum likelihood estimates are clear. In the absence of autocorrelation and regardless of the weight matrix specified, the expectation of Moran's I statistic is .
Its expectation is 1 in the absence of autocorrelation and regardless of the particular weight matrix (Sokal and Oden, 1978).
Spatial Prediction
As part of the iterative estimation process, for penalized quasi-likelihood (PQL), û[ can be derived (Breslow and Clayton, 1993). ÓWióo, ûY is the Bernoulli probability at new locations and Ó(û|û[ jS,∅[) is the distribution of the spatial random effects û at new locations, given û[ at observed locations and assumed to be the normal distribution follow, that is. The mean of the Gaussian distribution in (6.16) is the classical kriging estimator (Schabenberger and Gotway, 2005).
Simulation-based Bayesian spatial prediction is performed by successively drawing samples from the posterior distribution, the distribution of the spatial random effects at new locations, and the Bernoulli-distributed predicted outcome.
Data analysis using spatial statistics approach
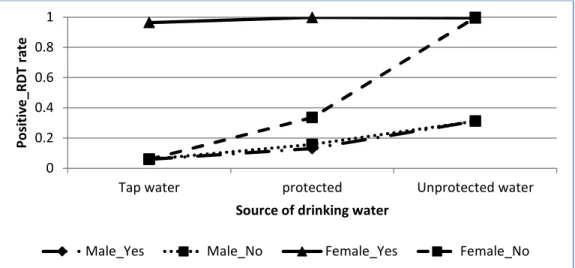
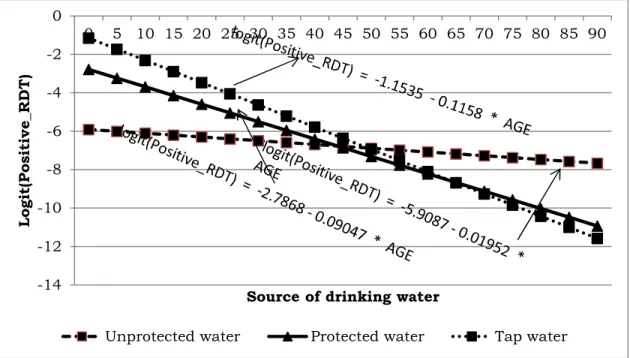
Figures 6.4 and 6.5 show the distribution of malaria rapid diagnostic tests against age, main source of drinking water for men and women respectively. Furthermore, there was a significant difference in rapid diagnostic test between tap, protected and unprotected drinking water sources for those who reported having thatched and stick and mud roofs. As the figure indicates, a positive rapid diagnostic test was significantly higher for female respondents than for male respondents who reported using unprotected water.
However, there was no significant difference in a positive rapid diagnostic test between women and men who reported using protected water and tap water for drinking.
Summary and discussion
Therefore, it is important to identify those factors that are also related to the risk of malaria. In addition to socioeconomic factors, there are demographic and geographic factors that also have an effect on the risk of malaria. Therefore, the spatial distribution of malaria incidence was one of the points important for such GIS studies.
The results of this study provide evidence on the spatial distribution of socio-economic, demographic and geographical risk factors in malaria occurrence.
Modeling of the joint determinants of malaria Rapid Diagnosis
- Introduction
- Joint model formulation for multivariate GLMM
- Evaluation of malaria RDT result using joint models approach
- Summary and discussion
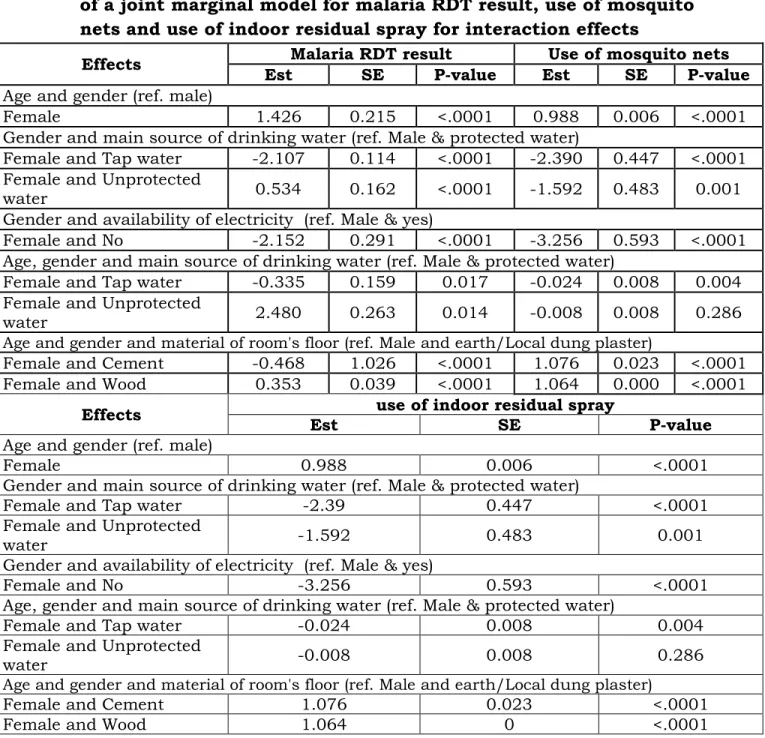
For such a case of multiple outcomes, two types of correlations should be considered, that is, the goals of a multivariate analysis of binary data should include (1) describing the dependence of each binary response on some covariates and (2) characterizing the degree of association between pairs of responses and the dependence of this association on covariates (Verbeke and Davidian, 2008, Verbeke et al., 2012). RDT result, use of mosquito nets and use of indoor residual spray for main effects. For this study, malaria RDT results, use of mosquito nets and use of indoor residual spray in the past twelve months are binary outcome variables.
Therefore, malaria RDT result, use of mosquito nets and use of indoor residual spraying in the last twelve months will be jointly modeled using generalized linear mixed models.
Semiparametric models for malaria Rapid Diagnosis
Introduction
Generalized Additive Models (GAMs)
Generalized Additive Mixed Models (GAMMs)
Fitting malaria RDT result using GAMM
Summary and discussion
Introduction
Rasch models
Tests for Rasch models
Application of Rasch models
Summary and discussion
Discussion and conclusion
![The Integrated Scenarios Explorer ‘ISE’ [3]](data:image/gif;base64,R0lGODlhAQABAIAAAP///wAAACH5BAEAAAAALAAAAAABAAEAAAICRAEAOw==)