The use of visual strategies by educators at tertiary level and its influence on student teachers'
development of mathematical concepts
By
Desiray Ramiah
A dissertation submitted in partial fulfilment of the requirements for the degree of
Master of Education
(Mathematics)
University of KwaZulu – Natal 2018
Supervisor: Prof. V Mudaly
DECLARATION OF ORIGINALITY
I declare that this dissertation is my own work and that all the sources I have used or quoted have been indicated and acknowledged by means of complete references.
D. Ramiah Durban August 2018
ACKNOWLEDGEMENTS:
I would like to express my appreciation and gratitude to:
God, for his immeasurable amount of wisdom, knowledge and understanding.
My mum, my pillar of strength, for her empathetic understanding and support;
My brother, sister-in-law & nieces, Jerome, Diane, Daniella and Jodelle for their understanding, patience.
My supervisor, Prof. V.Mudaly, a true gentleman, for his coaxing, cajoling and insightful guidance. I would like to refer to him as my Guru, a man I truly look up to as my role model.
A Guru who has encouraged and motivated me from my first year of studying.
All participants who participated in this study, and;
Finally, I would like to dedicate this dissertation to the memory of my late Grandmother.
ABSTRACT
South Africa over the past decade has developed a comprehensive set of policies in the field of education with a vision to transform education in order to make amends for the past injustices related to apartheid education.
According to the Department of Education (2005) a National Framework for teacher education was recommended so that it could articulate improvement, consistency and track a more reasonable way forward for the teachers and the South African education system. Furthermore, an important area of priority was that teachers be developed so that transformation can take place. One of the goals of mathematics education according to the Department of Education is to prepare student teachers and current educators to become proficient in their endeavours.
Therefore, various teacher educators were observed, with a view to understand the various strategies used to prepare future mathematics teachers.
Many studies have been conducted in the field of visualisation of mathematics; visual strategies used at university level have been a neglected part in mathematics teaching. In this study I examine the effects of visual strategies at a university in Durban, KwaZulu-Natal. This study examines the multiple uses of visual strategies by educators at university level such as:
1. multiple visual strategies used
2. various multiple representations of visual strategies
3. use of visual strategies to enhance students’ understanding
4. use of visual strategies’ influence on student’s mathematical understanding and educators and students’ perception of visual strategies
Data was collected by means of video to analyse the visual strategies used by educators, and questionnaires were given to educators and a focus group using a semi structured interview for student teachers. The conclusions from the data analysis have shown that visual strategies certainly play a pivotal role in developing mathematical concepts. Literature shows that the link between enhancing mathematical conceptual thinking in students can be done by means of using visual strategies. The literature suggests that visualisation assists students in developing their mathematical abilities as it allows them an opportunity to show their interpretation and understanding of mathematical concepts. Through the use of visual strategies
in mathematics, students make connections in mathematics and employ appropriate strategies to apply themselves mathematically.
CONTENTS PAGE:
CHAPTER ONE ... 1
Introduction ... 1
1.1. Introduction ... 1
1.2. South African Perspective... 2
1.3. Visual Strategies ... 6
1.4. Visuals in a real world context... 6
1.5. Visual Technology ... 7
1.6. Visual Learning Style ... 8
1.7. Semiotics ... 9
RESEARCH PROBLEM ... 10
RATIONALE ... 10
STRUCTURE OF THE STUDY ... 13
CHAPTER TWO ... 16
Literature Review and Theoretical Framework ... 16
2.1. Introduction ... 16
2.2. Visualisation in mathematics ... 18
2.3. Multiple representations of visual strategies... 21
2.3.1. Learning Styles ... 23
2.3.1.1. The theory of Multiple Intelligences ... 23
2.3.1.2. Gregorc’s Learning Style Model ... 25
2.3.1.3. The VARK Model... 27 2.3.1.4. Felder
–Silverman Learning/Teaching Style Model ... 29
2.4. The uses of visual strategies are controversial ... 31
2.5. Artefacts and objects ... 33
2.6. Gestures... 35
2.6.1. Definition of gestures ... 35
2.6.2. The role of gestures ... 35
2.6.3. Gestures and multimodality ... 36
2.7. The theory of Semiosis ... 37
2.8. Semantics ... 39
2.9. Pierce’s Semiotic Triads. ... 40
2.9.1. Triadic Model... 40
2.9.2. A Taxonomy of inscriptions ... 42
2.9.2.1. Descriptive and depictive sign agents ... 42
2.9.2.2. Polysemic and monosemic sign agents ... 43
2.9.2.3. Autnomous and Auxillary sign agents ... 43
2.9.2.4. Semiotic means of objectification ... 43
2.9.3. The Semiotic Bundle... 44
2.9.4. Semiotic Nodes ... 45
2.9.5. Radford’s Cultural-semiotic approach. ... 45
2.9.6. Vygotskian Semiotic Conception ... 46
2.10. Visual Students ... 48
2.11. Visual Learner-spatial Student Model ... 53
2.12. Heuristics ... 55
2.13. The Visualiser/Analyser (V/A) model ... 56
2.14. Technology used as a visual strategy ... 57
2.15. Limitations of visual strategies used in a classroom ... 58
2.16. Conclusion ... 59
CHAPTER THREE ... 61
Research Methodology ... 61
3.1. Introduction ... 61
3.2. Profiles of Research Participants ... 62
3.3 The Critical Questions ... 65
3.4. Methodological Approach ... 66
3.5. Research Design... 68
3.6. Observations ... 68
3.7. Questionnaire ... 70
3.8. Focus group Interviews ... 71
3.9. Data Analysis ... 73
3.10. Sampling ... 74
3.10.1. Convenience Sampling ... 75
3.10.2. Purposive sampling ... 75
3.11. Ethical Issues ... 76
3.11.1. Autonomy ... 76
3.11.2. Non-maleficence ... 76
3.11.3. Beneficence ... 77
3.12. Measures to Ensure Trustworthiness of Research Instruments ... 77
3.12.1. Triangulation ... 77
3.12.2. Validity and Reliability ... 78
13.12.2.1. Credibility ... 79
13.12.2.2. Dependability ... 80
13.12.2.3. Transferability ... 80
13.12.2.4. Confirmability ... 80
3.13. Access to University ... 81
3.14. The Researcher as an Instrument ... 82
3.15. Conclusion ... 82
CHAPTER FOUR ... 84
Data analysis ... 84
4.1. Introduction ... 84
4.2. Overview of this Study ... 84
4.3. Observations of tertiary educators’ classroom practice. ... 84
4.4.1. Analyses of lessons: ... 85
4.4.1.1. Lesson by Lecturer A ... 85
4.4.1.2. Lesson B by Lecturer B ... 86
4.4.1.3. Lesson C by Lecturer C ... 87
4.5. Comparison of Visual Strategies used: ... 87
4.6. Gestures... 89
4.6.1. Lecturer A/ Group ‘A’ ... 89
4.6.2. Lecturer B/ Group ‘B’ ... 90
4.6.3. Lecturer C/ Group ‘C’ ... 92
4.7. Use of Artefacts ... 93
4.7.1. Lecturer A/ Group ‘A’ ... 93
4.7.1.1. Strategy 1 (Strips of paper): ... 94
4.7.1.2. Strategy 2 (Coloured board): ... 94
4.7.1.3. Strategy 3 (Beans): ... 95
4.7.1.4. Strategy 4 (Chalkboard): ... 96
4.7.2. Lecturer B/ Group ‘B’ ... 97
4.7.2.1. Strategy 1 (Whiteboard):... 97
4.7.2.2. Strategy 2 (Chalkboard): ... 97
4.7.2.3. Strategy 3 (Data projector): ... 98
4.7.2.4. Strategy 4 (Booklets): ... 98
4.7.3. Lecturer C/ Group ‘C’ ... 99
4.7.3.1. Strategy 1: (Number line and Pegs): ... 99
4.7.3.2. Strategy 2 (Russian Dolls): ... 101
4.7.3.3. Strategy 3 (Booklets): ... 102
4.7.3.4. Strategy 4 (Data projector): ... 102
4.7.3.5. Strategy 5 (Overhead projector): ... 103
4.8. Classroom Set-up: ... 103
4.8.1. Lecturer A/ Group ‘A’ ... 103
4.8.2. Lecturer B/ Group ‘B’ ... 104
4.8.3 Lecturer C/ Group ‘C’ ... 106
4.9. Visual Students ... 107
4.9.1. Lecturer A/ Group ‘A’ ... 107
4.9.2. Lecturer B/ Group ‘B’ ... 107
4.9.3. Lecturer C/ Group ‘C’ ... 108
4.10. Semiotics ... 109
4.10.1. Lecturer A/ Group ‘A’ ... 109
4.10.2. Lecturer B/ Group ‘B’ ... 110
4.10.3. Lecturer C/ Group ‘C’ ... 110
4.11. Visual strategies used in Lesson A ... 111
4.11.1. Lecturer A/ Group ‘A’: Table 4.11.1 ... 111
4.11.2. Lecturer B/ Group ‘B’: Table 4.11.2 ... 111
4.11.3. Lecturer C/ Group ‘C’: Table: 4.11.3 ... 111
4.12. Focus group interview... 112
4.13. Questionnaires... 120
4.13.1. Participants’ understanding of the notion of visual strategies ... 120
CHAPTER FIVE ... 127
Conclusion and Recommendations ... 127
5.1 Introduction ... 127
5.2 Findings and Conclusion... 127
5.3 Recommendations ... 129
5.4 Limitations ... 130
5.5 Further Research ... 130
5.6 Conclusion ... 130
REFERENCES: ... 131
Appendices:... 154
ETHICAL CLEARANCE REPORT ... 182
List of Figures & Tables:
Figure 1. 1: Math results decline... 2
Figure 1. 2: TIMSS statistics for mathematics achievement ... 4
Figure 1. 3: learning styles with visual being dominant ... 8
Figure 2. 1: Graph Paper ... 20
Figure 2. 2: Cubes ... 20
Figure 2. 3: Learning Styles ... 22
Figure 2. 4: Gardener’s eight multiple intelligences theory ... 24
Figure 2. 5: Learning styles ... 25
Figure 2. 6: Activities to accommodate Gregorc’s learning style ... 26
Figure 2. 7: VARK Learning Model ... 28
Figure 2. 8: Activities that accommodate VARK learning styles ... 29
Figure 2. 9: Feldr-Silverman learning style Model ... 30
Figure 2. 10: Pierce’s Semiotic Model ... 41
Figure 2. 11: Topological versus Typological – Semiosis by Lemke (2001) ... 42
Figure 2. 12: History of a sign ... 46
Figure 2. 13: The relationship between an object, its meaning, and a sign. ... 47
Figure 2. 14: The relationship between an object, its meaning, and a name ... 47
Figure 2. 15: Semiotic Chain ... 48
Figure 2. 16: Visual Spatial Learner Processing ... 51
Figure 2. 17: Visual-Spatial Learner ... 54
Figure 3. 1: Phases of data generated by Creswell et al. (2007) ... 61
Figure 3. 2: Critical questions of the study ... 65
Figure 3. 3: Qualitative research design ... 67
Table 3.2 1: Representing the three University Lecturers ... 62
Table 3.2 2: Representing the Pre-service teachers (Students) ... 64
Table 4.5 1: Comparison of visual strategies ... 88
Table 4.6 1: Lecturers’ responses to question 2 (Do you use visual strategies in your classroom?) ... 122 Table 4.6 2: Lecturers ‘responses to question 3 (What visual strategies do you use?)... 122 Table 4.6 3: Lecturers’ responses to question 4 (Do you think the use of visual strategies influences students in attaining mathematical concepts?) ... 123 Table 4.6 4: Lecturers’ responses to question 5 (Do you use gestures? If yes, what gestures?
Do you think gestures are important when teaching?)... 124 Table 4.6 5: Lecturers’ responses to question 6 (Do you think visual strategies perplex or confuse students when used in a classroom? Explain.) ... 125 Table 4.6 6: Lecturers’ responses to question 7 (What is your understanding about semiotics?
Does it hold a significant purpose in the math class?) ... 126
CHAPTER ONE Introduction
1.1. Introduction
It may be true that by seeing something, one may remember it for a longer time. Perhaps, it is better to see mathematics, than to only hear about it. Mathematical intricacy has been viewed as a sizeable challenge for decades, the use of visuals however appears to be a possible key that helps resolve this problem. Visualisation has been a window to the mathematics world by allowing students an opportunity to delve deeper in an attempt to understand mathematics. Ho (2009: 249) states that, “seeing is believing, or so the saying goes. We depend on our sight for many things in life, using a map to find our way, using a picture to aid recognition, or using diagrams to better describe what our words fail to communicate”. In the mathematics classroom, sometimes the solution to a problem is right before our eyes. The contribution of visualisation to mathematics and mathematics education has raised a number of questions of an epistemological nature (Giaquinto, 2009: 1). Drawing from the mathematics CAPS document, the occurrence of visual strategies in teaching and learning of mathematics appears to be encouraged. It states that mathematics “aims to produce learners that are able to communicate effectively using visual, symbolic and/or language skills in various modes”
(CAPS: 5). The incorporation of images and visual representations found in lessons is gradually becoming an important requirement for the new curriculum, which appears to be more spatially and visually inclined. A specific skill in the curriculum is that the learner ought “to develop essential mathematical skills and the learner should: communicate appropriately by using descriptions in words, graphs, symbols, tables and diagrams” (CAPS: 9). Euclidean Geometry and probability are added sections in the CAPS curriculum; these sections were previously optional in the NSC curriculum, but have now become compulsory. Drawing from my experience in teaching mathematics, these are the sections that are largely influenced by means of visuals.
In past years, many studies on visualisation were very much pessimistically stereotyped (Dreyfus & Eisenburg, 1991; Lean & Clement, 1981; Presmeg, 1992). Mathematics research education has long debated the relative presence and value of visualisation. Visualisation in mathematics has gained a positive review over recent years. In addition, Linda et al. (2010: 45)
state that “Mathematical visualisation objects may have important contributions beyond the introduction of ideas to beginning students”. This has contributed to mathematics by helping students make meaning of information that may have appeared previously to have been incomprehensible. The Open University states that, “Imagery is a powerful force for perception and understanding. Being able to “see” something mentally is a common metaphor for understanding it. An image may be of some geometrical shape, or of a graph or diagram, or it may be some set of symbols or some procedure” (The Open University, 1988: 10). This research study will provide pertinent literature and evidence on visual strategies used at one university. The study firstly looks at visualisation, and visual strategies used at the university level. Secondly this research study looks at controversial issues of whether or not to use visual strategies when teaching mathematics which is discussed at length. The study also shows pertinent literature of various paradigms, models and theories underlying visualisation in mathematics as discussed in Chapter Two. Chapter Three outlines the methodological design of the study. Subsequently, a description is given of the research design, the development of the research instruments, and provides the rationalization for the use of these instruments.
Chapter Four represents the data generated and finally Chapter Five outlines the conclusion and recommendations.
1.2. South African Perspective
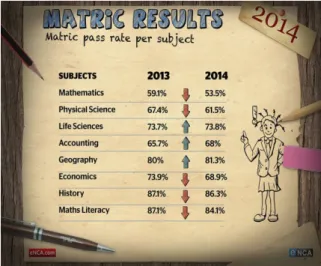
Drawing from the South African perspective, it seems that South African students have struggled with mathematics. According to the national news provider eNCA, the mathematics results showed one of the greatest declines at the matric level (eNCA, 2015: 1).
Figure 1. 1: Math results decline (Adapted from: www.eNCA.com, 5 January 2015)
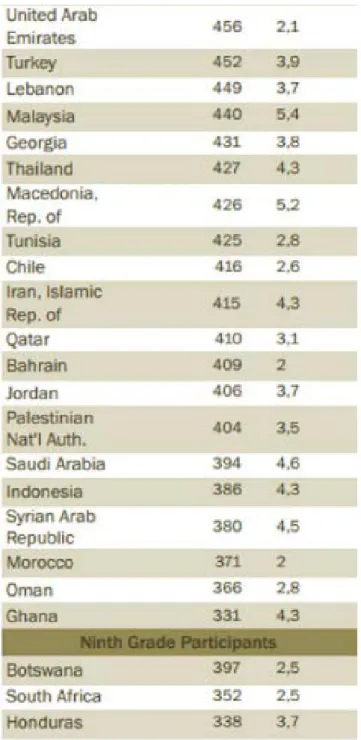
Figure 1.1 shows results of the first batch of ‘CAPS matriculants’ of 2014. The statistics show a decline of 5.6 percent since 2013. It is unfortunate that only 50 percent of the student population is mathematically literate. Teaching strategies used in South Africa’s education system should certainly be scrutinized. It is possible that there are ineffective strategies used in our new and improved curriculum, which would require new and improved methods to fulfil a spatially and visually dominant curriculum. Recently released statistics also published in the TIMSS report stated that South Africa’s mathematics position from 42 countries appeared to take position 40. Figure 1.2 shows South Africa’s struggle in mathematics and very disappointingly appearing second last (V Reddy, 2011: 4).
Figure 1.2: TIMSS Statistics for mathematics achievement (Adapted from: www.hsrc.ac.za, 12 August 2015)
Figure 1.2 displays the results of an independent and international assessment study of the mathematics and science knowledge of Grade 9 learners, released by the Human Sciences Research Council (HSRC). TIMSS was conducted in 45 countries. Of these, 42 countries participated at the Grade 8 level, and three countries, namely Botswana, South Africa and
Honduras, participated at the Grade 9 level. These three countries (Botswana, South Africa and Honduras) continued to perform at the lowest end in both mathematics and science. In addition Reddy articulates, "A striking feature of the mathematics and science scores is that the best performing South African learners matched the average performance of the top performing countries of Singapore, Chinese Taipei, the Republic of Korea, Japan, Finland, Slovenia and the Russian Federation" (Reddy, 2011: 4). According to Reddy (2011: 3), the three top performing provinces in both mathematics and science in TIMSS 2011 were the Western Cape, Gauteng and Northern Cape. The three lowest performers were KwaZulu-Natal, Limpopo and the Eastern Cape. The greatest improvement was among learners who can be described as "the most disadvantaged" and who scored lowest initially. In analysing the top-end performers against the TIMSS international performance standard, the average scores for independent, former House of Assembly and Quintile five schools, all performed below the middle score of 500. Regarding a comparison of the curriculum for these two disciplines, it was found that the Revised National Curriculum Statements that guided instruction and learning of mathematics and science at schools during 2002 and 2011 covered more than 90% of the TIMSS assessment framework on which the learners were tested. Reddy explains that "This implies that the curriculum for Grade 9 schools in South Africa is on par with the international standard, but there are many other factors that shape achievement at school level".
Perhaps the use of visual strategies in a classroom would be an attempt in transforming mathematics in South African Education. Drawing from figures 1.1 and 1.2, it is evident that mathematics is a struggle for South African learners. Visualisation in mathematics has appeared to be a channel of hope to students. There is pertinent literature by Linda et al. (2010:
3) which concludes “Visualisation objects plausibly can be used to assist in the interpretation of mathematical problems”. Many South African students still encounter problems with mathematics as a subject, which is generally deemed only for the intelligent or the more elite class of society. Valdez (2005: 1) argues that, “mathematics and science have suffered from the stereotype that only a few people can and in fact need to be highly proficient in science and mathematics”. Looking at the university, there exists a multicultural, multilingual and multi- abilitied student population. Learning mathematics from a second language perspective may be a task at hand that is most challenging. Visual strategies have become a stunning tool which allows mathematics to be displayed using pictures, images, tables, graphs, and so on and
“students are able to grasp concepts easier when engaging with dynamic images” (Mudaly, 2013:
36). Visualisation in mathematics helps second language learners cut across the difficulty of mathematics that appears to be an added language to the student.
1.3. Visual Strategies
Apart from student’s normal behaviour and their easy-going outlook toward mathematics, educators need to use methodologies that would get their attention and tools that can sustain good teaching in mathematics. Visual strategies have the ability to transform mathematics such that students can begin to comprehend and understand, and also where educators can find teaching mathematics with minimum difficulty. Visual strategies allow for mathematics to be understood easily (Rapp, 2009: 2). Visuals have the ability to communicate to all irrespective of colour, race or language. The language of pictures has the potential to break all barriers whether it is language or cognitive ability. Diagrams or symbols on paper often help, as do physical tools. They aid in trying to say what can (or cannot) be seen. Visualisation in mathematics education ought to become a universal communication tool for students attempting to understand mathematics. Dreyfus (1991: 33) states that visual strategies allow students to see mathematics in colour, animation and the ability to view mathematical objects three-dimensionally. They help to develop students’ understanding and may allow for concepts to be grasped.
1.4. Visuals in a real world context
Many people regard mathematics as the number one subject in the hierarchical ladder owing to its levels of complexity and nature of higher order thinking that it requires. The standards and perceptions of which students and educators consider mathematics are high (Berry & Bol, 2005: 33). Mathematics commands a prominent status universally. It is a subject that holds the key to successful business people, architects, and engineers. All of these highly paid jobs have one thing in common; in the type of work they do, all require the skill of working with ‘visuals’.
This is further expanded in the literature review chapter. If visuals are used in jobs of the working world, surely they should be used in the classroom where student teachers and university educators need to obtain the necessary skills to prepare pupils for the working world?
For example, architects work with many beautiful artefacts (blocks to make tiny buildings).
Architects also work with many visuals; they construct, create, and craft visuals of which many
are shown by means of visual strategies. This study attempts to understand how mathematics student teachers and university educators can be sufficiently trained using visual strategies.
These educators have a task to prepare students for the work environment and using visual strategies is a suitable approach to prepare students into a largely dominant spatial working world. Chapter Two also extensively discusses how visualisation prepares them a step further and epitomizes the many various rich roles it can and should play in the learning and the doing of mathematics. At the same time, the limitations and possible sources of difficulties of visualisation may pose for students and teachers are considered.
1.5. Visual Technology
Visual Technology is a fundamental component of visual strategies used in a classroom. A visually stimulating environment based on technology can allow students to become immersed in their own knowledge construction. There are many new technological modes of visual strategies that have added a new facet to teaching. The interactive whiteboard is the most common visual strategy used in most classrooms today. “Technological change has struck a revolution with teaching. The smartboard and projector keeps me much more focused and interested. It’s much better than someone standing at the front and droning on in a monotone voice while furiously scribbling away on the board” (Iyer, 2009: 19). The benefits of this type of technology are many and can be set up without any complications. Drawing from my experience with the Smartboard visual strategy in my classroom, it has many benefits such as it allows for projecting of effectual mathematical software such as sketchpad and GeoGebra, planning lessons which undoubtedly enhance my teaching and learning. There are many new technological visual strategies used similarly to develop resources conducive to new teaching techniques that keep up with the fast paced technological world. Chapter Two embodies the benefits of using interactive whiteboards and many more technological visual strategies that can be used when teaching mathematics to students. Visual strategies have enhanced visual presentations in the classroom, improved student focus and concentration, increased enjoyment of lessons and more importantly have improved learning in classrooms. The literature review chapter shows exactly these benefits. Drawing from my experience with the new CAPS curriculum, teaching of topics such as Functions, Data Handling, Analytical Geometry, Calculus, and Trigonometry, have been made easier with software programs like Geometers
Sketchpad and GeoGebra. Teaching time traditionally required to complete a section such as Functions can be been reduced by half.
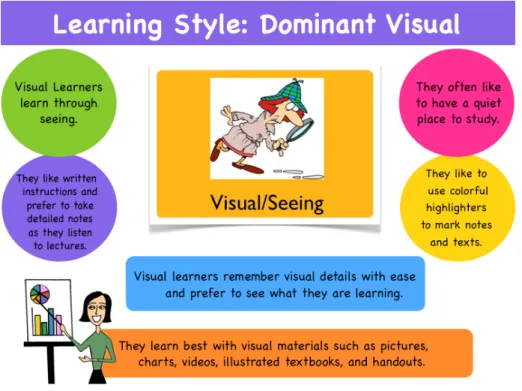
1.6. Visual Learning Style
Research studies shown in the literature and theoretical framework chapter discuss learning styles. The chapter mentions two specific learning styles (dominant visual and individual differences in visual processing in mathematics) by which visual strategies play an integral role. This dominant visual learning style lends itself to visual students; this study therefore examines the manner in which visual strategies help visual students. This learning style in this study draws on many other paradigms and theories based on visualisation in mathematics.
Figure 1.3 shows the various characteristics of being a visual student. Visual students learn purely by means of ‘seeing’. Learning occurs by making meaning with what they see and visual strategies are ways in which students ‘see’ mathematics, especially visual students. This research places some importance on visual students and referring to figure 1.3, it states that visual students learn by means of visual strategies such as pictures, charts, videos, illustrated textbooks and hand-outs.
Figure 1. 3: learning styles with visual being dominant (Adapted from:
https://www.google.co.za/search?q=visual+learning+style&rlz, 02 January 2017)
In the late 1970s, many mathematics educators became aware of the issue of individual student differences in mathematical processing. It is true that not all students receive information in the same way. There are differences in the way different students think and learn. Visual strategies provide a methodology to assist teachers to provide for the different ways in which different students think and learn. Kruteskii’s (1976) research pointed out that there is not just one, mathematical ability, different abilities lead to different thinking styles in learning mathematics (Presmeg, 1986: 42). Kruteskii’s research however also contradicts and states that it is quite possible to do mathematics with minimum visual processing, as long as the verbal- logical component of thinking is present. He also claims that many students who are capable of using visual imagery in their mathematical thinking prefer not to do so if given a choice.
Visualisers really need diagrams on paper or the chalkboard, and visual images in their minds, when they learn mathematics. Thus it may be seen that there is a distinction between abilities and preferences in learning mathematics, and given the ability to do so, preference for using visuals by the use of visual strategies may determine the mathematical thinking and learning style of a student. These learning styles are discussed in greater detail in Chapter Two.
1.7. Semiotics
This research study also lends itself to another important theory called the theory of semiotics.
This theory is discussed at length in Chapter Two and focuses on gestures, signs, symbols, icons and indexes used in mathematics. It can be regarded as a visual strategy used every day in the classroom. Semiotics assists in helping educators and students in making sense of how mathematics functions as a tool for problem-solving in the real world. Lemke states, “A semiotic perspective helps us understand how natural language, mathematics, and visual representations form a single unified system for meaning-making” (Lemke, 2003: 215). Lemke also argues that, it is often difficult to point to this or that sign and say whether it is mathematical or linguistic, mathematical or diagrammatic. Some linguistic signs are also mathematical, and many mathematical signs are also linguistic ones. Some diagrams are mathematical and some mathematical signs are diagrammatic. The semiotic theory can be viewed from different perspectives but this research study will only focus on Pierce’s theory of signs. Pierce believed that “signs are the matter, or the substance of the thought” and said that life itself “is a train of thought”, that is, life and signs are fundamentally related and inseparable for all humans” (Houser, 1987: 270).
This research study will finally look at visualisation in mathematics at university level by looking at university teacher educators’ use of multiple representations of visual strategies. The purpose of this research study is to investigate the use of these visual representations (such as chalkboard strategies, computer representations, simple charts or worksheets) in getting students to understand mathematical concepts. This study will firstly analyse, tertiary educators’ use of visuals and secondly, student teachers’ understanding of mathematical concepts by the use of visual strategies. The aim of this investigation is to establish whether any relationship exists between the use of visual strategies and students’ understanding of mathematics at university level. One of the aims of this study is to explore the relationship between educators’ pedagogical and epistemological beliefs on visual strategies and their intended pedagogical practices.
RESEARCH PROBLEM
This study looks at the use of visual strategies by educators at tertiary level and their influence on student teachers' development of mathematical concepts. In order to explore the manner in which visual strategies are used at university level, I wish to seek answers to the following critical questions:
1. Are multiple visual strategies used at university level?
2. What are the various multiple representations of visual strategies that are used by educators at university level?
3. Does the use of visual strategies enhance students’ understanding?
4. How does the use of visual strategies influence students’ mathematical understanding through concept development?
5. What are educators and students’ perceptions of visual strategies?
6. To what extent can visual strategies be used in a classroom?
RATIONALE
There are a number of dilemmas that are faced by universities as well as schools in an attempt to develop future mathematics teachers. Students however, show a lack in understanding many simple concepts in mathematics which presents a huge problem when they are asked to formally teach learners at a school. Shulman (1987: 1) highlights that knowledge of
mathematics and pedagogy are not sufficient in order to become a mathematics teacher. There seems to be a gap between understanding mathematics at school and understanding mathematics at university, which presents a problem when student teachers are asked to teach mathematics. There could be several reasons for this, such as student teachers come from an ever changing curriculum and lack many basic computational skills of mathematics that tertiary educators may take for granted. Evidence provided by many tertiary educators at the university, of this research study show a large decline in the students’ mathematical understanding.
Despite many students being promoted to the next level, there is still a disjuncture in their mathematical performance and understanding. Research however shows that with the implementation of CAPS, there seems to be no talk about training pre-service teachers about the new CAPS curriculum. Research presented shows that training from the Department of Education is limited only to teachers. “The responsibility for the training and support of teachers in the implementation of the CAPS in the classroom from 2012 onwards rested with the provincial departments and the districts. It is clearly stated in the CAPS implementation plan that orientation and training of teachers and managers is fundamental for the effective implementation of CAPS” (Olivier, 2013: 1). The aim of investigating visual strategies at university level therefore sets out to find possible teaching strategies to alleviate the challenging nature of teaching mathematics when students are asked to teach in a formal situation. Educators seem to be teaching mathematics governed by methods, procedures and rules. Whilst these may be good to enhance mathematical thinking, students may need a little more in order to understand mathematical concepts. Students are comprised of the intelligent, the mediocre, and the weak. Gardner (1999: 1) identifies seven intelligences, and visual / spatial intelligence which is often ignored in the mathematics classrooms. Many educators teach mathematics rather than showing mathematics. Visual strategies allow for students of all intelligences and cognitive abilities to understand mathematics. Visual strategies have also catered for students in this technologically advancing society to accept mathematics as fresh and new.
There are extreme changes in society of the 21st century which place undue pressure on an educator. Expectations of educators now greatly differ from what they were a generation ago.
The mathematics curriculum has changed once again lending itself to the need for a paramount change in methodologies for an educator and content for a student. The changes inclusively show that mathematics is expanding and basing itself more toward real context of everyday
situations. Teaching methods should therefore differ and require useful interesting tools to sustain the mathematics CAPS curriculum. Visual strategies used in a classroom appear to be the most suitable tool to cater for the class of today and seem to have the ability to allow for the necessary skills of a student. Souhrada (2001: 1) states that the "mathematics of the twentieth century is not serving the needs of learners entering the twenty-first century". These changes in society have led to the need of developing visually literate students. We are living and teaching in a globally challenging and technologically evolving period in which visual strategies are required to instil visualisation skills. Many 21st century educators are realising that visuals are crucial to life and are assisting students to develop skills of visualisation in order to communicate in a vastly complex world. Diezmann (1995: 2) states that visual literacy has become an increasingly significant component of communication and problem solving in everyday life and that visual literacy is now essential for extracting information, constructing knowledge and building successful educational outcomes.
When prior knowledge in mathematics is low, visual representations allow for an improved form of learning mathematical facts rather than lessons by means of only verbal communication. Chanlin (1998: 166) reports how lessons with no visuals, still visuals, or animated visuals influence students with different prior knowledge levels as they attain procedural and descriptive knowledge. This report shows that students with a high level of prior knowledge of the subject responded better with the animated form of visuals in learning descriptive facts, but students responded even better with visuals of artefacts and objects especially when learning procedural knowledge. Artefacts and objects play a crucial function in mathematics education and will be discussed more in Chapter Two. Chanlin’s (1998: 167) study suggests differently, he states that students with different prior knowledge levels respond differently to contrasting presentation forms for achieving learning tasks, and that the effectiveness of visual design in learning is related to the prior knowledge of the students.
Animated visuals are not superior to still visuals and may even be distracting to learning if the motions are inconsistent with how students process the visual information.
Anecdotal evidence shows that underachievement in mathematics is an on-going issue in universities across South Africa. Many students are not motivated in mathematics and perform poorly. Part of the reason for this problem may be due to poor attitudes towards mathematics
and poor teaching strategies in mathematics. In order to begin to remedy this problem of poor mathematics motivation and achievement, educators need to be aware and implement the best teaching strategies. Research validates the best teaching practices including the use of artefacts, real life application, and integrating technology which are all components of visual strategies, into mathematics instruction. Educators can now begin to implement these visual strategies in their own classrooms which may be a remedy to the problem of low mathematics motivation and achievement among students throughout South Africa. Furthermore, this research will show university educators highlighting the best visual strategies used in their instruction of teaching. Student teachers can then model this type of instruction in their teaching.
Findings from this research can positively influence the way students and tertiary educators see visual strategies and their connection to mathematics. It will find new meaning to visualisation that can broadly open up mathematics. There is so much more to mathematics which can be synthesised through the use of visuals. This can be done by firstly understanding whether tertiary educators use visual strategies in their lecture rooms, what type of visuals are used, and whether these influence students’ development of mathematical knowledge positively or negatively. This research study will look specifically at these multiple representations of visualisation in mathematics. This research study is valuable as it can contribute extensively in the quest to produce better mathematics teachers.
STRUCTURE OF THE STUDY
This study includes five chapters, referencing and appendices. The chapters in this study are as follows:
Chapter One introduces the background to this study on visual strategies by firstly highlighting the definition of visualisation and secondly it presents a brief underlying meaning of visual strategies. It discusses the relationship between visualisation in mathematics and visual strategies as a mathematical didactic. It scrutinizes the nature and relevance of visual strategies used in classrooms of a university. It also introduces the theories that will be used in this study such as the theory of multiple intelligences, the theory of semiosis, etc. The rationale is also included in this chapter controversially describing the need for visuals in mathematics together with the purpose of why this study of visual strategies and the need for this study are to be
carried out at a university. It motivates the relevance of visual strategies and their influence on students’ conceptual knowledge. It presents the key research questions which are fundamental items in this study.
Chapter Two presents the pertinent literature on the areas under investigation namely multiple representations of visual strategies. The study looks at past and present literature. It shows that visualisation was a huge component since the time of Euclid and is currently obtaining much recognition again in the classroom. This chapter makes a brief study on the historical background and nature of visualisation and visual strategies used in mathematics in terms of the relevance of this study. It also provides reasons and is motivated by evidence why students should be taught using visual strategies. It presents the literature and theoretical framework for this study. The theoretical frameworks extensively show the various theories; paradigms and models used by means of visualisation and in certain instances visual strategies. This chapter gives an indication of the relevance of visualisation in mathematics by using the following theories of multiple intelligences, semiosis, Pierce’s triadic model, etc.
Chapter Three presents the research design, the research methodology and procedures used to complete this study. It also discusses the research instruments used to conduct this study. It introduces the participants of three educators showing whether or not visual strategies are used in their classroom. It also introduces the student teachers as participants of the research study.
It finally shows the characteristics of this study being a qualitative research approach.
Chapter Four deals with the findings and analysis of the data obtained from videos by means of observation, semi structured interviews of students and questionnaires given to educators. It displays the results for students’ reaction to the visual strategies used as well as their effect on their mathematical conceptual build up. It also includes the types of visual strategies observed from university educators. This is an important chapter in this thesis, with qualitative data. It includes the actual findings, report and discussion.
Chapter Five is the final chapter, which presents the conclusion to this study, recommendations, limitations and further research. It also draws up conclusions from the results of this study.
This chapter discusses the data in a summarized format. In this chapter the main points were articulated with clarity; to reiterate, summarize, and perhaps re-sequence the findings.
CHAPTER TWO
Literature Review and Theoretical Framework
2.1. Introduction
Visual strategies utilized in a mathematics classroom were purposed to initiate imagery, spatial ability and intuition in a student. As advocated by Duval (1999: 22) “There is no understanding without visualisation”. Despite mathematicians adding value to visualisation in mathematics and positive links toward visual strategies, there are still many aspects shown to be controversial. In mathematics research, Presmeg (1985) started her doctoral investigation on the role of visually mediated processes in high school mathematics. She mentions that there were only a few reported studies in this field and similar to this research project, there are very few studies presented with regard to visual strategies at tertiary level. Visualisation has always made its mark in the field of mathematics education but it only became a highlighted aspect in the late 1980s. Visualisation in mathematics education consists of many theories, models and paradigms which will be discussed in the following paragraphs.
As stated by Aristotle “without image, thinking is impossible”. (Stokes, 2002: 10).
Visualisation has been the centre of mathematics for many years. According to a research study
“Visualisation of Mathematics education has been a recent phenomenon in that it has only begun its extensive focus; however research also shows that visualisation of mathematics has been in existence since Euclid”. Much research states that the use of visuals in mathematics initiated from the 18th century, gaining much popularity but lost its status in the 19th century when the use of diagrams in mathematics was said to be misleading in problem solving (Lemke, 2003: 215). Despite the rejection of visual strategies used in many publications, research shows that mathematicians still used visual reasoning in their own work (Lean & Clements, 1981;
Presmeg, 1992; Dreyfus and Eisenburg, 1991). Hadamard (1954: 519) claims that even Einstein and Poincare showed the importance of visualisation by placing emphasis on visual intuition. According to Halmos (1987: 400), to be a scholar of mathematics you must be born with the ability to visualise. In addition, Bishop (1973: 271) argues “The aspect of visualisation in Mathematics education has not attracted much research attention in the recent past”.
Drawing from the recent history of visualisation, visual strategies certainly played an integral part in attaining mathematics knowledge in the mind of the mathematics student. In order to
ascertain the integral uses of visual strategies, it is firstly vital to understand the meaning of its concept. Fosset (2004: 24) purports that “Visual strategies include the use of photographs, and visual strategies can be defined as any strategy that brings forth a representation. In the context of mathematics education visual strategies allow, for students’ development of forming an internal image in their minds or external image that can be seen by the eye to convey meaning to the brain.” This research study will focus primarily on tertiary educators’ use of visual strategies. Visual strategies could include any representation that allows for an internal or external image developed by the student. Visual strategies could comprise of a model, a PowerPoint presentation, drawing or writing on a chalkboard, a gesture, or anything that can produce a visual representation. The methodology chapter shows exactly what visual strategies were identified in this South African research study.
South Africa looks back to an ever changing curriculum making the task of mastering teaching strategies a tedious challenge. A recent study done in South African universities shows what lecturers felt about an ever changing curriculum. Lecturers in the same university of this research study expressed their concern about the burden of programme review which may be thrown away by another possible curriculum review. In addition, Gumbo (2014: 12) stated that for educators, it would appear that the taking over by a new minister of education comes with a possibility for change or review of the curriculum. Constant curriculum change deepens the challenge to master teaching strategies. It appears that more time is focused on how to master policy documents rather than focusing on the actual implementation of what is in the curriculum. A serious look at the use of teaching strategies should be constituted as part of an approach to quality teaching and learning in educational policies. There are very few teaching strategies officially by guided documents and in some educational policies there are no guidelines to teaching strategies at all. This study looks at visual strategies from a university perspective since the context of this study originated from a university. In the milieu of a university with students attempting to master mathematics education, visual strategies should be a crucial approach used for the impartation of knowledge. Anecdotal evidence shows that tertiary educators have a lack of skill to disseminate mathematics content by the use of teaching strategies. Leu argues “Professional development of teachers has been neglected because of budget constraints and heavy emphasis on pre-service education, but when it is provided, the cascaded approach is popular for reaching many participants in a short time” (Leu, 2004: 1).
Research shows that in contradiction, mathematics educators especially at university level have
a deep urge and struggle to produce the best results especially since mathematics is regarded as one of the most demanding subjects (Badger, 2012: 1). The need for tertiary educators to want to improve their strategies and teaching methods are present, however there seems to be a lack of training and skill given to tertiary educators to improve their teaching strategies.
Dreyfus (1991: 4) argues that “Mathematics educators seem to have recognized the potential power and the promise of visual reasoning; but in spite of this, implementation is lagging:
Students tend to avoid visual reasoning. It seems that teachers continue emphasizing their instruction on non-visuals method”. At university level, mathematics can be seen as a content based module and most educators lack the ability to correlate mathematics and visuals as a teaching approach. Whilst it is done easily in primary schools and high schools, at university level there seems to be a negative cognisance in seeing the link between using visual strategies especially in mathematics owing to their cumbersome nature. Looking at South African education it is clear there is a lack of good teaching approaches used in the mathematics classroom.
In this section, a review of South African and International literature will be discussed. The objective in analysing this literature from both stances is to get different perspectives on visual strategies used at university level. This research study focuses firstly on interpreting the true meaning and function behind using visual strategies, therefore some models, theories and paradigms were analysed in this chapter. I then, extensively reviewed past and present research that suggests that multiple representations of visuals used in a classroom at university level provide an important position to mathematics. I also analysed its intense connection to the history of mathematics education. I specifically looked at how multiple forms of visual representations and their articulation impeded on the grasping of mathematical concepts with respect to tertiary education. Finally I also considered why research pointed to the effectiveness of multiple representations of visual strategies in mathematics show that all too often they do not achieve their desired educational goal and consider what can be done to overcome these problems.
2.2. Visualisation in mathematics
To adopt a definition of visualisation is crucial to the nature of this study to enhance the true purpose of visual strategies. The definition given by Zazkis et al. (1996: 435) describes
visualisation as “any mental construction of objects or processes that an individual associates with objects or events perceived by her or him externally”. It is impossible to look at visualisation of mathematics in isolation to visual strategies. Whilst these two are regarded broadly in the field of mathematics education, visual strategies seem to lend themselves to a deeper demand. He uses a good example to show the interrelation between visualisation and visual strategies. He also describes how educators at university use a regular hexagon as an example of dihedral groups and symmetries of cubes which were explained by the use of just a chalkboard. The result of trying to explain such a weighted section in mathematics by means of just a chalkboard turned out to be dismal. The educator then allowed these students to make these cubes and encouraged play in another lesson. The ability to visualise plays an important role in comprehending in mathematics. However, the ability to visualise at abstract level becomes a challenge but the use of visual strategies used to enhance abstract thinking eliminates this challenge for educators. Visual strategies are used to assist in enhancing the ability to visualise especially at an abstract level. Zazkis shows that the use of Venn diagrams, tables and flow diagrams are types of visual strategies that can be used in attaining a mathematical concept visually. Whilst learners are in need of using and creating images either externally or internally, it is not always easy for students to construct these representations with ease, hence the educator assists by the use of visual strategies.
Visualisation is a common metaphor used for understanding something that we simply ‘see’.
According to primary magazine, issue 22 “'Visualising means being able to summon a mental image of something, seeing it in your mind. The image may be of some geometrical shape, or of a graph or diagram, or it may be some set of symbols or some procedure”. (p1.).
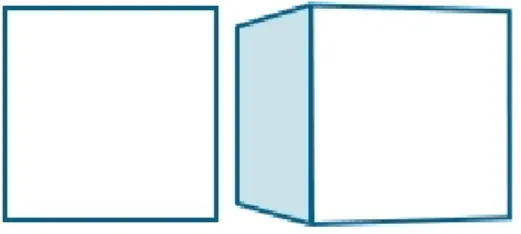
Visualisation could occur by means of closing your eyes and seeing a picture, although some researchers state it has more to do with imagining. There are many aids to visualisation in reference to mathematics. The primary magazine used graph paper and a cube represented in figure 1 and figure 2 respectively to demonstrate the ability to visualise mathematically.
Figure 2. 1: Graph Paper (Adapted from primary magazine, 2013, 20 January 2016) The magazine states that “there is a great deal of visualisation in mathematics. If you really want to grasp a concept or idea, struggling to visualise it is worthwhile”. (p1.). The empty number line is a useful image for students to use to support their manipulation of numbers, but they are also visualising the order of the numbers as they use it. All the various models and images encourage students to support their mathematical visualisations.
Figure 2.2: Cubes (Adapted from primary magazine, 2013, 20 January 2016)
We use visualisation in almost every area of mathematics. Figure 2 displays blocks which refer to visualisation in relation to 2D and 3D shapes. This aids students in envisaging mathematics internally and externally. Visualisation in mathematics is usually associated with drawing pictures or diagrams as an approach to getting started on mathematics problems. Visualisation however has a much greater role to play in mathematics. It includes development of ideas that is envisaged by an individual and much more. In this sense it is not just about pictures and diagrams. The visualisation process has two main elements: an internal model of visualisation or an external representation (Crapo et al., 2000, p.220).
They also emphasise the importance of the interplay between these internal and external representations which support the development of an effective model.
In as much as the ability to solve problems is at the heart of mathematics, visualisation is at the heart of mathematical problem solving. Visualisation is the ability to see and understand a problem situation. Visualising a situation or an object involves “mentally manipulating various alternatives for solving a problem related to a situation or object without benefit of concrete manipulatives” (MOE, 2001, p. 51).Visualisation can be a powerful cognitive tool in problem solving. In the revised Primary Mathematics syllabus (MOE, 2007: 13), it is highlighted as an important skill “essential in the learning and application of mathematics.” This ability to reason visually is increasingly important in the information age. Thus, the role that visualisation plays in students’ mathematical thinking and problem-solving experiences has become more significant. Piggott (2009: 1) questions, “Are there other ways in which we visualise when solving mathematical problems and if so how can we encourage, value and develop visualising in our classrooms?”
2.3. Multiple representations of visual strategies
Multiple representations of visual strategies used in a classroom are pivotal as they cater for students of various learning abilities. Multiple representations of visual strategies are different ways used to symbolize, to describe and to refer to the same mathematical entity by means of various representations. Jao states that “Many researchers have discussed the strength of using multiple representations as a vehicle to construct students’ mathematical knowledge and to support a deeper, more abstract understanding of mathematics” (Jao, 2009: 22). Multiple representations of visual strategies are used to initiate understanding, to develop, and to communicate different mathematical features, sometimes from the same object or differently.
Jao adds that multiple representations may include: graphs, diagrams, tables, grids, gestures, videos, models, manipulative and pictures. “Students can represent their mathematical understanding in a variety of modes, for example: manipulatives, pictures, diagrams, spoken languages, and written symbols” (Jao, 2009: 23). Representations are thinking tools for doing mathematics. The use of multiple representations in general is an important part of teachers’
knowledge of mathematics and can play an important role in the explanation of mathematical ideas (Leinhardt et al., 1991: 87). In addition, Brophy states that “Skilled teachers have a
repertoire of such representations available for use when needed to elaborate their instruction in response to student comments or questions or to provide alternative explanations for students who were unable to follow the initial instruction” (Brophy, 1991: 352).
Researchers have conversed about the notion that mathematical ideas can be represented externally and internally (Putnam, Lampert, & Peterson, 1990: 57). There are two types of representation in which mathematics can be depicted, that is, internal and external representations. External representations include manipulatives, pictures, diagrams, spoken languages, and written symbols (Lesh, Post, & Behr, 1987: 33) and internal representations include mental models and cognitive representations of the mathematical concept (Putnam et al., 1990: 140). External representations can highlight specific aspects of mathematical concepts therefore supporting this process of explanation (Kaput, 1991: 53; Ainsworth, 1999:
131). In addition, the ability to draw on multiple representations is an important aspect of pupils’ mathematical understanding (Hiebert & Carpenter, 1992: 65; Greeno & Hall, 1997:
361). Visual representations enable pupils to make connections between their own experience and mathematical concepts (Post & Cramer, 1989: 221), and therefore gain insight into these abstract mathematical ideas (Duval, 1999: 3; Flevares & Perry, 2001: 330). Figure 3 below depicts an image representing learning styles. The learning styles consist of three types of learners; visual, auditory and tactile/kinaesthetic, using more than one type of representation of teaching and learning are crucial.
(Adapted from: http://studentblogs.le.ac.uk/management/files/2012/10/Learning-Styles- 1.jpg), 25 August 2014
Figure 2. 3: Learning Styles
Perhaps a visual learner holds much importance in the above learning styles. A visual learner obtains mathematical developments not only by sight but through hearing and a sense of touch.
Presmeg (1992: 595) shows that there are different forms of imagery, “continuum from specific to more general”. In contrast, the concrete image can be seen as more visual whilst the abstract demands more spatial skills. Kozhevnikov et al. (2002: 47) argue that whilst some visualisers use images and suffer the challenges; others succeed using more spatial ability. Problems of visualisers may occur because of the lack of balance between their visual and verbal understanding. It is therefore important to scrutinize the visualisers in class to improve mathematics performance.
2.3.1. Learning Styles
The past few years have projected an increasing number of research done on learning styles.
Literature has shown that students gain knowledge in diverse ways. Research has shown that
“Within the last three decades, the proposition that students learn and study in different ways has emerged as a prominent pedagogical issue” (Claxton & Murrell, 1987; Coffield, Moseley, Hall, & Ecclestone, 2004a, 2004b). The methodology of teaching mathematics is crucial and educators should realise, especially at university level that one approach to teaching does not produce skilful students. Research has proven that the incorporation of multiple learning styles in teaching can produce a much desired result of what educators expect in students of mathematics. A variety of teaching and learning approaches has the potential to enhance the learning and performance for a wider range of university students in mathematics.
2.3.1.1. The theory of Multiple Intelligences
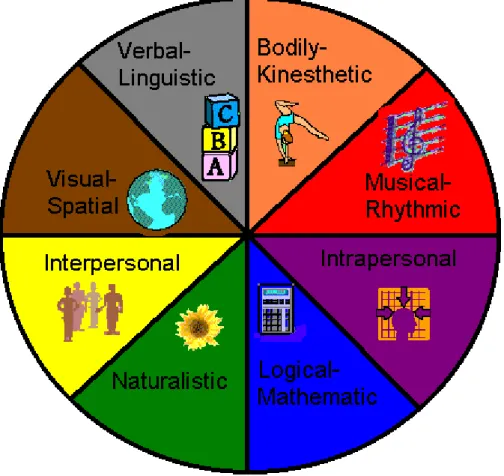
The theory of multiple intelligences initiated by the Harvard psychologist Howard Gardner (1983) has captured the attention of numerous researchers, authors, and educators. The theory has been on vigorous growth since its inception. He developed the theory of eight multiple intelligences. Gardner discusses the link between these eight theories of multiple intelligences, however only the visual learner will be discussed in detail. According to Blink (2015:172) “A visual learner has the ability to perceive the visual. These learners tend to think in pictures and need to create vivid mental images to retain information. They enjoy maps, charts, videos.”
The researchers above showed the crucial need for visual strategies in the classroom for the
benefit of the visual learner. According to recent statistics by Krabbe (2005:5), one out of three learners constitutes the category of a visual learner. Drawing from this statistic there is a need to use visual strategies in the classroom for visual spatial learners.
Figure 2.4: Gardener’s eight multiple intelligences theory (Adapted From:
http://www.google.co.za/imgres?imgurl=http://expectumf.umf.maine.edu/piechart.gif&imgref url), 20 July 2013
According to many researchers, to speak about what makes a real mathematician is to be asserted that “to be a scholar of mathematics you must be born with the ability to visualize.”
Halmos (1987:400). Many mathematicians and researchers have accentuated the importance of visual reasoning in mathematics through the use of visual strategies such as Bishop (1979:
44) and Presmeg (2008: 83) in their history of visual research in mathematics. Some mathematicians such as Lemke (2000: 235) agree that visuals can aid learners, however she also claims that “Mathematics is more powerful than visualisation, it can represent a pattern that cannot be visualized.” This notion of visual strategies used in the mathematics classroom to benefit the student, is controversial. Research studies done, showed that some students are
perplexed by visuals. They claimed that instead of focusing on the actual mathematics, their focus was distracted by the colour and visuals. Some researchers along with Gardner believe that it takes a linking of not just visual/spatial intelligence, but other intelligence such as that mentioned in figure 4 to combine, with visual intelligence to achieve the optimum rationalization of mathematics.
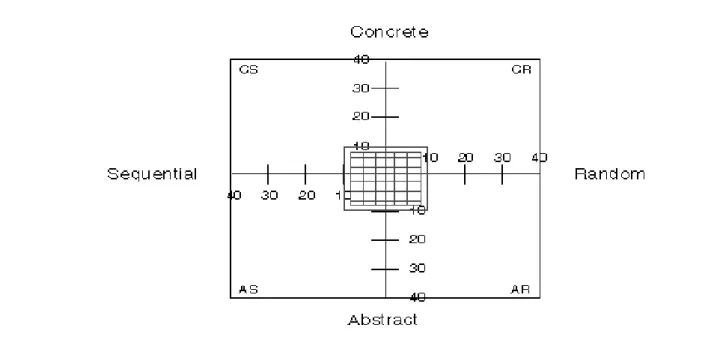
2.3.1.2. Gregorc’s Learning Style Model
The Gregorc Learning and Teaching Style Model are based on phenomenological research as
“distinctive and observable behaviours that provide clues about the mediation abilities of individuals and how their minds relate to the world and, therefore, how they learn” (Gregorc, 1979: 19). This model is suited to students who have natural tendencies for learning. It attempts to analyse the mental intrinsic worth of a student by means of association with the environment.
The four bipolar elements that will be scrutinized are abstract and concrete perception, sequential and random ordering, deductive and inductive processing along with its separative and associative relationships.
Figure 2. 5: Learning styles (Adapted from Gregorc, 1979, 25 August 2014)
The diagram in figure 5 indicates a further four learning styles, which are, Concrete-Sequential (CS), Abstract-Sequential (AS), Abstract-Random (AR), and Concrete-Random (CR). The CS
students have a preference for straight less complex, hands-on experience. These students need organization and an ordered sequence to activities given to them. They follow directions and instructions well. The CS learner relates best to the concrete world with hands-on experience, prefers a structured, step-by-step learning process using all senses, and needs explicit and clear directions. The AS learner creates ideas and uses symbols to make meaning. They are reasonable students and are chronological in thinking in that they enjoy focusing on a job without distractions. The AS student uses the mind to explore, and enjoys researching and investigating, and is very analytical and evaluative. The CR learner is tentative and an explorer.
He/she likes to investigate problems and makes spontaneous jumps in solving, and uses trial and error to work out solutions. The CR learner also relates well to the concrete world, prefers a nonlinear order, looks for the big picture, uses experience to investigate, and is intuitive, creative, and a risk taker. The AR learner relates best to the world of emotions and the spirit, prefers a nonlinear order that is harmonious, wants personal experiences and supportive relationships, and works for good communication. The AR student centres attention on the surroundings and would rather have discussions and conversations that are of an array that is broad. He/she requires time to reflect on experiences. Figure 6 shows the types of visual strategies and other activities needed for these types of students. Some visual strategies are cartoons, maps, diagrams and flowcharts.
Figure 2. 6: Activities to accommodate Gregorc’s learning style (Adapted from Gregorc, 1979, 25 August 2014)
In Concrete Sequential, some visual strategies mentioned in Table 2 constitute of charts, maps, diagrams, flowcharts, and cartoons. Students have the ability to ‘see’ demonstrations and because of the image it sources, the student has the ability to make mathematical sense.
Abstract Sequential allows for more spatial visualisation. For example, students have the ability to think and write which requires one to visualise thoughts and images in the mind before writing a term paper or a report. Abstract Random uses cartoons and role play which most certainly allows students to visualise. Finally Concrete Random which facilitates brainstorming and simulations which is also a main component of a visual strategy used to enhance mathematical development.
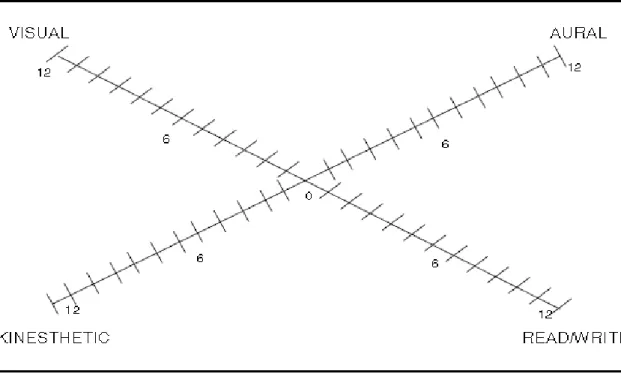
2.3.1.3. The VARK Model
The VARK Model makes reference to a sensory model (Eicher, 1987). The acronym VARK stands for Visual (V), Aural (A), Read/Write (R), and Kinesthetic (K). Fleming (2001: 100) defines learning style as “an individual’s characteristics and preferred ways of gathering, organizing, and thinking about information. VARK is in the category of instructional
preference because it deals with perceptual modes. It is focused on the different ways that we take in and give out information.” The VARK shows four perceptual modes, with students having preferences for anywhere from one to all four. I will, however, only concentrate on the visual mode as the context of this study is based on visual strategies. Individual students have relative preferences along each of the four perceptual modes but can learn to function in the other modes. Figure 7 presents the VARK model (adapted from Fleming, 2001). Fleming (2001: 120) uses the VARK model to explain the visual component by stating that visual learners prefer maps, charts, graphs, diagrams, brochures, flow charts, highlighters, different colours, pictures, word pictures, and different spatial arrangements.
Figure 2. 7: VARK Learning Model (Adapted from Fleming, 2001, 25 August 2014)
Aural learners like to explain new ideas to others, discuss topics with other students and their teachers, use a tape recorder, attend lectures and discussion groups, and use stories and jokes.
Read/Write learners prefer lists, essays, reports, textbooks, definitions, printed hand-outs, readings, manuals, Web pages, and taking notes. Kinaesthetic learners like field trips, trial and error, doing things to understand them, laboratories, recipes and solutions to problems, hands- on approaches, using their senses, and collections of samples. Fleming (2001) offers extensive suggestions for classroom approaches for matching teaching styles and learning styles. Figure 2.8 summarizes a number of learning activities to support each learning style.
Figure 2. 8: Activities that accommodate VARK learning styles (Adapted from Fleming, 2001, 20 January 2016)
Figure 2.8 shows the visual strategies that educators can adopt to their methodology of teaching that are shown in this learning style are proposed to constitute as diagrams, graphs, colours, charts, written texts, different fonts, spatial arrangements and design.
2.3.1.4. Felder–Silverman Learning/Teaching Style Model
The Felder–Silverman Learning and Teaching Style Model (Felder & Silverman, 1988) defines learning style as “the characteristic strengths and preferences in the ways individuals take in and process information” (Felder & Silverman, 1988: 674). It asserts that individuals have preferences “the Active-Reflective, the Sensing-Intuitive, the Verbal-Visual, the Sequential- Global, and the Intuitive-Deductive.” These are represented in Figure 9: Felder–Silverman Model (Felder & Silverman, 1988). I will make secondary reference to the visual component of this learning style.
Figure 2. 9: Felder-Silverman learning style Model (Adapted from Felder & Silverman, 1988, 20 May 2016)
Individual students have preferences along each of the four processes but can learn to function in more than one. Intuiting students prefer ideas and theories, chiefly when they can take hold of new ideas and innovation. Verbal learners like to hear their information and engage in discussion, especially when they can speak and hear their own words. Visual learners like words, pictures, symbols, flow charts, diagrams, and reading books. Sequential learners prefer linear reasoning, step-by-step procedures, and material that come to them in a steady stream.
Global learners are strong integrators and synthesizers, making intuitive discoveries and connections to see the overall system or pattern. Felder and Silverman (1988) discuss a number of teaching approaches useful to match the learning preferences. Visual learners want to see pictures, diagrams, flow charts, films, and demonstrations. Verbal learners like hearing and discussing information, taping lectures, and explaining themselves. Sequential learners like to move step-by-step through the material, progress logically to the solution to a problem. Global learners want to see the big picture, take in information randomly before putting it all together, and work intuitively.