1
Role of local or systemic Schistosoma infections in driving inflammation and HIV risk in women enrolled in the CAPRISA
004 cohort
Sahil Tulsi
Student No: 200309440 B.Sc., B.Med.Sc. (Hons)
Supervisor: Dr Derseree Archary
Co-Supervisors: William Horsnell and Jo-Ann Passmore
Submitted in fulfilment of the requirements for the degree of M.Med.Science in the Discipline of Medical Microbiology, Faculty of
Health Sciences
University of KwaZulu-Natal
2016
2 TABLE OF CONTENTS
Page
Declaration………5
Acknowledgements………...6
List of Abbreviations...7-9 List of Figures………...10-12 List of Tables……….13-14 Chapter: 1. Abstract & Hypothesis……….15-16 2. Introduction & literature review……….17-34 2.1.1 Worldwide prevalence of Schistosomiasis………...17
2.1.2 Prevalence of Schistosomiasis in South Africa………19
2.1.3 Converging epidemics of HIV and helminth infections………...19
2.2 Schistosoma life cycle………..20
2.2.1 Pulmonary schistosomiasis………..21
2.2.2 Female genital schistosomiasis………...22
2.2.3 Gastrointestinal schistosomiasis………...24
2.2.4 Helminth-induced immune responses in humans………...24
2.2.5 Helminth immune modulation increases susceptibility to diseases…………25
3
2.2.6 Schistosomiasis as risk factors for HIV acquisition……….26
2.2.7 Anatomy and physiology of the female genital tract…..……….28
2.2.8 Innate immune responses in the female genital tract………...28
2.2.9 Adaptive immune responses in vaginal mucosa to pathogens……….31
2.2.10 HIV transmission across the vaginal mucosal barrier………..31
3. Methodology...35-47 3.1 Study design and population...35
3.2 Ethical considerations………..35
3.3 CVL collection and processing………...35
3.4 Plasma preparation………...36
3.5 HIV screening and testing………36
3.6 DNA isolation: Template for downstream Real-time PCR………..36
3.7 Preparation of S. mansoni DNA for PCR positive control………...36
3.8 Primer Design, cycling conditions and real-time amplification of target schistosomal DNA………37
3.9 Real-time polymerase chain reaction (RT-PCR) for amplification of schistosomal DNA………38
3.10 Cycle sequencing of PCR products and sequencing clean up reaction prior to capillary electrophoresis………...41
3.11 Measurement of Schistosoma antibodies by ELISA………42
3.12 Measurement of CVL cytokine concentrations by Luminex assay…………..44
3.13 Statistical analysis………47
4 4. Results...48-72
4.1 Description of the cohort...49 4.2 Prevalence of female genital schistosomiasis in CVL………...50 4.3 DNA sequencing of amplicons and alignment to S. haematobium sequence……51 4.4 Seroprevalence of schistosomiasis………51 4.5 Genital cytokine concentrations associated with FGS or HIV infection at study
entry (month3)………....53 4.6 Genital cytokine concentrations associated with FGS or HIV infection at study
exit (month 52)……….57
5. Discussion...73-83 6. Conclusion………...84 7. References………85-94 8. Appendix………95-99
Annexure 1: Expedited ethics approval………95 Annexure 2: Supplementary figures & information………96-98
5
DECLARATION
This study represents the original work by the author and has not been submitted in any form to another University. The use of work by others has been duly acknowledged in the text.
The research described in this study was carried out in the Discipline of Medical Microbiology, Faculty of Health Sciences, University of KwaZulu-Natal, under the supervision of Dr Derseree Archary, Prof Jo-Ann Passmore & Prof William Horsnell.
______________________
S. Tulsi
6
ACKNOWLDEGEMENTS
I would like to express sincere gratitude and appreciation to Dr. Derseree Archary for her guidance, valuable criticism and encouragement throughout the study.
I am sincerely grateful to Prof Jo-Ann Passmore, Prof William Horsnell & Dr. Lenine Liebenberg for their guidance and support during this research endeavour; and for their contribution towards this thesis.
I am grateful to the National Research Foundation (Free-standing Scarce Skills, Grant Reference: 97979) for awarding me their scholarship, the College of Health Sciences for funding this study & Dr Ravesh Singh for his laboratory training during this study
Finally, I would like to thank my family for their encouragement, support and understanding throughout this study.
7
LIST OF ABBREVIATIONS
°C Degrees Celsius
µg Microgram
Μl Microliter
Ab ACD
Antibody
Anticoagulant dextrose
Ag Antigen
AIDS Acquired Immune Deficiency Syndrome ARV
Basic FGF B-NGF
Antiretroviral
Basic fibroblast growth factor Beta nerve growth factor Bp
CAPRISA
base pair
Centre for the AIDS Programme of Research in South Africa CD4, CD8 Cluster of Differentiation
CD4 TH lymphocyte CD4 T-helper lymphocyte
CI Confidence Intervals
CTL CVL CSF CTACK G-CSF GM-CSF
Cytotoxic T Lymphocytes Cervico-vaginal lavage Colony stimulating factor Cell attracting chemokine
Granulocyte-colony stimulating factor
Granulocyte macrophage colony-stimulating factor FGS
FUS
Female genital schistosomiasis Female urogenital schistosomiasis
8 H
HGF
Hour
Hepatocyte growth factor HIV
IL IFN ITS IQR LIF
MCP MCSF
Human Immunodeficiency Virus Interleukin
Interferon
Internal Transcription Spacer Interquartile range
Leukaemia inhibitory factor
Monocyte chemo attractant protein Macrophage colony-stimulating factor
Mg Milligram
MgCl2 Magnesium Chloride
min/s MIF
minute/s
Migration inhibitory factor
Ml Millilitre
mM Millimolar
NaCl Sodium Chloride
Ng PDGF
Nanogram
Platelet-derived growth factor PBMC Peripheral Blood Mononuclear Cell
PBS Phosphate Buffered Saline
PCR Polymerase Chain Reaction
Pg
RANTES
Pictogram
Regulated on activation, normal T expressed & secreted
RNA Ribonucleic Acid
9 rRNA
SCF SDF
Ribosomal RNA Stem cell factor
Stromal derived cell factor
SNP Single Nucleotide Polymorphism
Taq Thermus aquaticus
TNFα Tumour Necrosis Factor alpha
TNFR1/2 TNF receptor 1 / 2 TRAIL
U
Tumor necrosis factor-related apoptosis-inducing ligand Unit
UV Ultraviolet
V VEGF
Volts
Vascular endothelial growth factor
10
List of figures
Chapter 2
Legend
Figure 2.1: Geographical distribution of
schistosomiasis………..17
Figure 2.2: Burden of disease and deaths caused by schistosome infections………...18
Figure 2.3: Parasitic life-cycle of Schistosoma species………...20
Figure 2.4: Urinary, genital & intestinal schistosomiasis……….23
Figure 2.5: Th1&Th2-immune responses in schistosoma infections...25
Figure 2.6: Proposed innate immune responses at vaginal mucosa……..30
Figure 2.7: Mechanisms by which HIV crosses the vaginal mucosal epithelium………...32
Page
11 Chapter 3
Figure 3.1: Principle of real-time PCR………39 Figure 3.2: Melt peaks of real-time PCR……….40 Figure 3.3: FGS PCR amplicon validation on 1% agarose gel……41 Figure 3.4: Principle of indirect antibody ELISA………...44 Figure 3.5 Principle of multiplex luminex technology…………....47
Chapter 4
Figure 4.1: Multiple alignment of FGS PCR products………51 Figure 4.2: S. mansoni specific IgG levels in women at study entry
& exit………...53
Figure 4.3: CVL cytokine comparison of Basic-FGF & MCP-3 in FGS- &FGS+ women at study entry………...56
Figure 4.4: Concentrations of Th1 cytokines investigated in 4 study groups at study exit………...60 Figure 4.5: Th2 cytokine concentrations investigated in 4 study groups at study exit………..61 Figure 4.6: Growth factor cytokines investigated in all 4 study groups at study exit………..62 Figure 4.7: Growth factor cytokines investigated in all 4 study groups at study exit………..63
12 Figure 4.8: Median levels of chemokines in all 4 study groups at
study exit………..64 Figure 4.9: Median levels of chemokines in all 4 study groups at study exit………..65 Figure 4.10: Median levels of chemokines in all 4 study groups at study exit………..67 Figure 4.11 (A-B): Median cytokine levels of Th1 cytokines &
Schistosoma spp associated cytokines in FGS- & FGS+ women at study
exit………...68 Figure 4.11 (C-D): Median cytokine levels of Th1 cytokines &
Schistosoma spp associated cytokines in FGS- & FGS+ women at study exit………..69 Figure 4.11 (E-F): Median levels of chemokines compared between FGS- & FGS+ women at study exit………...71
Chapter 8:
Chapter 8:
13
List of tables
Legend
Page
Chapter 3:
Table 3.1: Primer sequences………..37
Table 3.2: Real-time PCR reaction volumes……….38
Table 3.3: DNA sequencing reaction volumes………..42
Chapter 4:
Table 4.1: Demographic data of study participants……….49 Table 4.2: FGS PCR prevalence in placebo arm
of CAPRISA 004 cohort………...50 Table 4.3: Optical densities based on raw data for Schistosoma spp IgG in IgG-HIV-, IgG+HIV-, IgG+HIV- & IgG+HIV+ women at entry & exit of study before controlling for an OD
>1.0.………...51
Table 4.4: S. mansoni specific IgG sero-prevalence
of women in the placebo arm of the CAPRISA 004 cohort………….52 Table 4.5: Median levels of 48 cytokines adjusted for
multiple test comparisons amongst FGS-HIV- &
FGS+HIV- study groups at study entry……….54-55
Table 4.6: Median levels of 48 cytokines adjusted for
multiple group comparisons amongst FGS-HIV-, FGS+HIV-,
FGS-HIV+ & FGS+HIV+ study groups at study exit……….57-58
14 Chapter 8:
Table 8.1: Conventional FGS PCR reaction volumes………..97 Table 8.2: Conventional FGS PCR cycling conditions………97
15 Chapter 1: Abstract
Female genitourinary schistosomiasis (FGS) has been associated with increased HIV susceptibility, presumably through lesions secondary to parasitic eggs in situ in the female genital tract. We determined the prevalence of FGS infection by real-time PCR (indicative of local involvement of parasitic eggs in the genital mucosae) and sero-prevalence of schistosomiasis (indicating prior exposure to parasitic infection) in HIV-uninfected KZN women (n=383) who had participated in the CAPRISA004 trial. The hypothesis for this study was that FGS, and genital tract inflammation are risk factors for HIV-acquisition. DNA PCR was used to confirm the presence of FGS, ELISAs were used for detection of Schistosoma spp IgG and multiplex technology was used to detect genital tract cytokines in the cervicovaginal lavages (CVLs). The median age of the women in this study was 23 years (range 20-26 years). Of the 383 HIV negative women, 52/383 (13.8%) became HIV-infected by study exit with an HIV incidence rate of 9.1 per 100 women-years ( 95% CI: 6.8 – 11.9). Nine of 383 (2.3%) women had a positive DNA PCR for Schistosoma spp indicative of prevalent genital schistosomiasis. Of these 9 women, 4/9 (44%) acquired HIV infection by study exit with a 4.0 times increased risk for HIV-infection (OR of 4.05- 95% CI 1.8-8.9, p=0.01) than PCR-negative women. Schistosoma haematobium, the endemic species in KZN has high sequence homology with S. mansoni antigen which was used to detect IgG in the plasma samples. Of the 383 plasma samples from study entry, 21/383 (5.5%) and 19/383 (4.96%) of study participants had detectable levels of IgG to S. mansoni at study exit. . Only, MCP-3, a chemokine was significantly higher in FGS+ compared to FGS- healthy HIV negative women. Genital tract pro-inflammatory cytokines at study exit were significantly higher in FGS-HIV+ women for IL-1β, MIF, IL-1A & IL-6 compared to FGS-HIV- women (p<0.0001, p=0.0014, p=0.0088, p=0.0069 respectively). Anti-inflammatory cytokine data in FGS-HIV+ women showed higher median levels of IL-1RA & IL-2RA compared to FGS – HIV- women (p<0.0001 & p=0.0012 respectively). Mixed responses of both pro and anti- inflammatory cytokines in the presence or absence of FGS may be an indication that HIV infection is driving these signatures and causing dysregulation. The presence of parasite DNA in the genital tract was significantly associated with increased risk for HIV acquistion. Taken together, these results highlight the importance of understanding the complex interplay of parasitic infections, and host immunity as potential risk factors for HIV acquistion in regions with high HIV and parasite burden.
16 Hypothesis
Female genitourinary schistosoma infection increases risk to HIV-1 acquisition, possibly by causing local lesions in mucosae, thereby increasing inflammatory responses in the female genital tract. The role of genital tract and systemic inflammation during Schistosoma spp infections in determing HIV risk in women is not completely understood. Therefore, this study sought to investigate the prevalence and incidence of Schistosoma spp infections by identifying the presence of schistosomal DNA and Schistosoma spp antibodies in women who were part of the placebo arm of the CAPRISA 004 trial. Specifically, the hypothesis was that women with detectable DNA specific to this parasitic infection in the genital mucosae had elevated genital cytokine responses compared to women who did not show evidence of infection, placing these women at higher risk for HIV acquisition.
17 Chapter 2: Literature review
2.1.1: Worldwide prevalence of Schistosomiasis
Schistosomiasis or bilharziasis is a waterborne parasitic infection caused by three main species of worms: Schistosoma mansoni, Schistosoma haematobium and Schistosoma japonicum. Schistosoma spp infections are a major global health problem; tropical and sub- tropical countries (Saathoff et al., 2004), at least 200 million individuals may be infected worldwide with ~90% of these cases (~180 million) occurring in sub-Saharan Africa (SSA) (WHO, 2012, WHO, 2015). In SSA, the two main species responsible for infections are S.
mansoni and S. haematobium, accounting for 280 000 infections that occur every year [reviewed by (Lustigman et al., 2012)]. Schistosoma mansoni and S. haematobium in SSA are the species that cause both hepatic-intestinal and urinary schistosomiasis [Figure 2.1].
Figure 2.1: Geographical distribution of schistosomiasis. Sub-Saharan Africa has the majority of both hepatic-intestinal and urinary parasitic infections caused by Schistoma spp.
(Center for Disease Control and Prevention, 2016). Illustration adapted in November 2016,
18 from http://wwwnc.cdc.gov/travel/yellowbook/2016/infectious-diseases-related-to- travel/schistosomiasis.
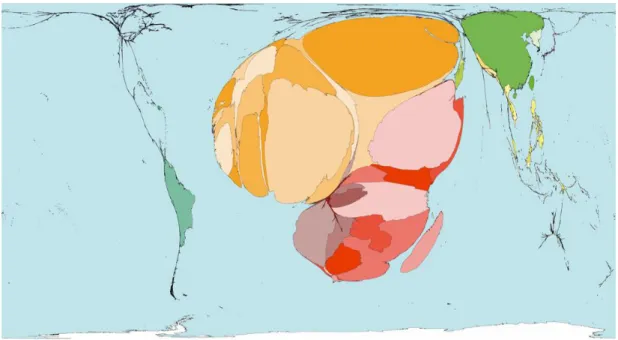
Schistosome infections have been the cause of many deaths worldwide, with SSA bearing the major burden of infection with attributable deaths (Figure 2.2).
Figure 2.2: Burden of disease and deaths caused by schistosomiasis. Disease burden in Africa is highlighted by its disproportionate size relative to other continents. High prevalence of schistosoma infections (indicated in red) exist in SSA, with medium prevalence (indicated in orange and yellow) occurring in North African countries and low prevalence (indicated in green) in South America & Eastern countries . Figure shows deaths that occurred due to schistosomiasis in 2002 (0.08%), with an average of 7 deaths per million people (figure adapted in January 2015 from www.worldmapper.org).
Schistosomiasis is recognized as a disease of poverty, being highly preventable and curable (Olds and Dasarathy, 2001). Poor sanitation remains a key driver of this disease, particularly where people come into contact with human faeces or urine-contaminated water supplies (Center for Disease Control and Prevention, 2012). It has been proposed that women are at a higher risk of contracting this parasitic disease than men because they typically carry out
19 domestic chores, including washing clothes, which may increase their exposure (Mutengo et al., 2014).
2.1.2 Prevalence of schistosomiasis in South Africa
Surveillance for schistosomiasis in South Africa is not routine, seroprevalence has been reported to be high, ranging from 71 to 100% in Limpopo and KwaZulu-Natal (KZN) provinces (Moodley et al., 2003). The prevalence of urinary schistosomiasis in KZN was 7.2% in 2004 [reviewed in (Johnson and Appleton, 2005)], however no more recent studies have been conducted on the parasitic burden in this province. Given the high sero-prevelence rates, schistosoma remains a major but neglected public health concern in South Africa, particularly in KZN (Kjetland et al., 2012).
2.1.3 Converging epidemics of HIV and helminth infections
It has been suggested that helminth infections impact negatively on the HIV epidemic (Mkhize-Kwitshana et al., 2011). In 2013, South Africa had ~6.4 million (range 5.8-6.1 million) individuals infected with HIV, with KZN province having a substantial portion of these individuals [~1.2 (1.1-1.3) million individuals] (WHO, 2013). Furthermore, women are at over two-fold higher risk to acquire HIV than males in South Africa (CDC, 2014), (Abdool Karim et al., 2010a). The majority of HIV infections that occur in South Africa are sexually transmitted (Abdool Karim et al., 2010b). Like schistosomiasis, KZN also has the highest prevalence of HIV (16.9%) than other provinces in South Africa (Shisana and Rehle, 2014).
Since cervicovaginal inflammation has been shown to significantly increase women’s risk for acquiring HIV infection (Masson et al., 2015) by ensuring higher numbers of HIV target cells being recruited to the genital tract (Anahtar et al., 2015), convergence of the HIV and Schistosoma spp epidemics in KZN may predispose women to HIV infection and is therefore important to investigate. Further recent evidence shows that systemic immune activation induced by helminth infections through broad T cell activation can lead to significantly increased susceptibility to HIV (Kroidl et al., 2016) and HPV infection (Gravitt et al., 2016).
20 2.2 Schistosoma life cycle
Schistosomes belong to an ancient lineage of the animal kingdom, known as Platyhelminthes.
They occur in both parasitic and free-living forms (reviewed (Rollinson and Johnston, 1996).
Snails are the intermediate hosts for schistosomes and are an essential component of the parasitic life cycle. Three major species that are responsible for causing Schistosoma infection are S. haematobium (usually but not confined to causing urinary schistosomiasis), S.
mansoni and S. japonicum (usually but not confined to causing intestinal schistosomiasis).
Even though the transmission routes are similar for the various species, they can be distinguished from each other based on egg morphology and also on the main anatomical sites they locate to and cause pathology (Pitchford, 1965). S. haematobium has a terminal spike on its ova whereas S. mansoni has a lateral spike. S. japonicum has a round or pear- shaped ova that are pale yellow as shown in Figure 2.3.
Figure 2.3: Parasitic life cycle of schistosoma species. Schistosoma cercariae penetrate skin of the host and cercariae lose their tails, forming schistosomules. These circulate in the host bloodstream to the liver where they mature into adult worms. Paired adult worms then move
21 to mesenteric vessels of the bowel or rectum, or to the venus plexus of the bladder and egg laying occurs through this passage. Eggs are shed either through the urine or through the stool of the human host. The eggs hatch in the water to release the miracidia, which then penetrate snails as their intermediate hosts, these miracidia then develop into sporocysts. Through several cycles, these mature into cercaria in order to complete the life cycle of the worm (Center for Disease Control and Prevention, 2012). Illustration adapted in January 2015, from http:// http://www.cdc.gov/parasites/schistosomiasis/biology.html
Schistosoma infection occurs when free-swimming larvae, called cercariae, penetrate the skin of individuals who come into contact with contaminated water (reviewed by (Rollinson and Johnston, 1996). The local site at which the cercariae penetrates the human host skin can lead to a condition called “swimmer’s itch” (reviewed by (Rollinson and Johnston, 1996) which lasts for one week (Verbrugge et al., 2004). The cercariae otherwise pass unnoticed into the body and migrate via blood and lymph systems through the lungs to vessels of the liver (Harvie et al., 2007). In the liver of their host, worms pair-up, mature and move to preferred egg laying sites to complete their life cycle.
Sites of infection and manifestation of pathology are specific to the particular schistosoma species causing the infection. S. mansoni is known to cause intestinal schistosomiaisis (reviewed by (Rollinson and Johnston, 1996), whilst S. haemotobium causes mainly urinary or genital schistosomiasis (Kleppa et al., 2014). Often the schistosomules (immature form of schistosome after entry of the hosts blood vessels) migrate via the bloodstream and ultimately manifest in the bladder (Kjetland et al., 2012). Eggs are deposited into the tissue and may be passed through the stool or urine to carry on their life cycle depending on the site of infection (Figure 2.3).
2.2.1 Pulmonary schistosomiasis
Schistosomes may also migrate to and cause pathology in the lungs of human hosts.
Pulmonary schistosomiasis is usually associated with miliary mottling or diffuse nodular infiltrates, detectable by X-ray (Schaberg et al., 1991). Infection usually develops in people residing or travelling in endemic areas (Niemann et al., 2010). Pulmonary schistosomiasis occurs 3–8 weeks after infection and symptoms such as fever, headache malaise, myalgia, cough, hepatomegaly and peripheral eosinophilia are experienced (Cooke et al., 1999).
22 Granuloma formation in the lungs and fibrosis around the schistosome eggs retained in the pulmonary vasculature may cause pulmonary hypertension leading to cor pulmonale, defined as abnormal enlargement of the right hand side of the heart caused by lung disease (Niemann et al., 2010).
2.2.2 Female genital schistosomiasis
Female genital schistosomiasis is defined by the presence of sandy patches visible in the lower female genital tract (Figure 2.4), or by microscopic confirmation of S. haematobium eggs in genital tissue in situ. In the lower reproductive tract, genital schistosomiasis may involve the vulva, vagina, ecto- and endocervix, and bladder, leading to pathogenesis and disease.
One mechanism proposed by which genital schistosomiasis symptoms could occur in the vagina is through transmission via the urinary tract in the infected individual. During urination, the ova are excreted out of the female genital tract (Kjetland et al., 2012). As the ova are excreted through the urine (depending on the load of ova in the urine), these ova can become trapped in tissues and be subsequently recognized and surrounded by immune cells that may have migrated to the site of ova in the tissues of the lower female genital tract. This results in an inflammatory reaction, which can lead to fibrotic scarring (Willey et al., 2008).
An alternative mechanism that has been proposed may be spill-over of eggs into the genital tract and cervix through blood vessel anastomoses (where two blood vessels reconnect, that previously branched out) between the pelvic organs (Figure 2.4). These lesions or sandy patches (Figure 2.4B) and abnormal blood vessels in the genital tissue are visible when colposcopy is performed (Kjetland et al., 2012).
23 Figure 2.4: Urinary, genital and intestinal tracts of a female with schistosomiasis. (A) Diagram showing eggs of the helminth transmitted through the blood vessels anastomoses in the pelvic organs to the genital tract. This process results because of the proximity to the pelvic organs in the female [reviewed in (Kjetland et al., 2012)]. (B) Colposcopy image of the female genital tract from a Schistosoma-infected women, showing (a) homogenous yellow sandy patches (sandy areas with no distinct grains), (b) grainy sandy patches (forming oblong yellow to white grains, approximately 0.05 0.2 mm in size); (c) abnormal blood vessels [also referred to as ‘neo-vascularization’, are pathological convoluted (corkscrew)];
and/or branched and uneven-calibered blood vessels that are visible (under 15X magnification) on the mucosal surface. They are deeply or superficially situated in the mucosa. Diagnosis for female genital shistosomaisis is often quite difficult to make in the absence of colposcopy (Norseth et al., 2014).
Symptoms associated with female genital schistosomiasis, particularly cervical schistosomiasis, are non-specific and may be unremarkable. They may be associated with post-coital bleeding, lower abdominal pain or, in more severe cases, menorrhagia, which involves additional abnormal bleeding during menstruation (reviewed by (Rollinson and Johnston, 1996). Therefore, genital pathology caused by S. haematobium may go unnoticed and remain under-reported and under-treated. Colposcopy is the current gold standard for confirming the presence of female genital schistosomiasis (Kjetland et al., 2012). During colposcopy, cervical schistosomiasis can appear as cauliflower-like growths which are ulcerative, homogenous yellow areas, known as “sandy patches” (Mosunjac et al., 2003).
24 2.2.3 Gastrointestinal schistosomiasis
Some schistosome eggs pass through the wall of the intestine and is the most common manifestation and is usually caused due to S. mansoni [reviewed in (Rollinson and Johnston, 1996)]. Schistosoma mansoni lives in the bloodstream in the portal circulatory system (Pearce and MacDonald, 2002). In some rare cases, S. haematobium was the causative agent (Ata et al., 1970). Paired adult worms migrate to the mesenteric venules of the bowel/rectum and during this process eggs are laid which then circulate to the liver and are shed in stool. In the large intestine, the schistosoma ova are mainly distributed in the loose sub-mucosa, and fewer in the sub-serosa (which is the layer of tissue between the muscularis and serosa) where there is infrequent formation of multiple granulomas (Strickland, 1994). In the gastrointestinal mucosa, sandy patches usually occur if the sub-mucosa thickens due to fibrous tissue containing large numbers of calcified eggs. The mucosa then takes on a yellow dirty appearance (Strickland, 1994). Long term involvement of the gut can lead to bloody diarrhoea and abdominal pains (Nour, 2010). Eggs present in the intestinal veins migrate via portal blood flow to the liver causing inflammation which results in hepatic enlargement and periportal fibrosis (Harvie et al., 2007).
2.2.4 Helminth induced immune responses in humans
Schistosoma infections involve diverse organs and systems in the human host and can therefore elicit diverse immune responses. Cytokines are soluble proteins that exert both broad and targeted immune responses (Berger, 2000). T helper type 1 (Th1) cytokines are known to enhance pro-inflammatory cellular immune responses that account for killing intracellular parasites and eliciting autoimmune responses (Berger, 2000). T helper type 2 (Th2) cytokines control helminth infections, as well as act in allergic responses and enhance antibody responses, through the upregulation of IgE and eosinophilic responses typically found in atopy (Berger, 2000).
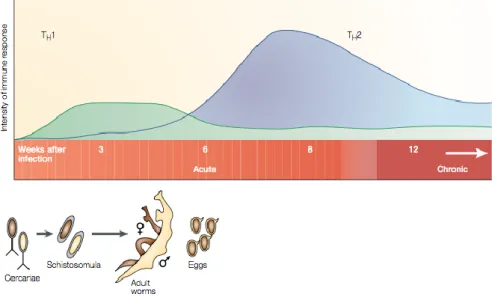
Helminth infections in humans are generally associated with Th2 immune responses (T-cells that produce 1L-4 and IL-13) (Adachi et al., 2014). In the early phase of infection, Th1 immune responses are present while Th2 immune responses dominate after oviposition (deposition of eggs by Schistosoma spp) (Figure 2.5) (Adachi et al., 2014). Infection with
25 parasites (such as the schistosoma species) usually result in the production of interleukin (IL)-4, IL-5, IL-9 and IL-13, typically associated with Th2-type responses (Adachi et al., 2014). These Th2-associated cytokines mediate immune responses by inducing differentiation of T cells, production of IgE and IgG by activated B cells, and recruitment and activation of innate effector cells (Maizels et al., 1993).
Figure 2.5: Th1- and Th2-immune response phases during Schistosoma infection. Th1 immune responses are initiated during the initial acute phase of infection, and wane after 5-6 weeks. Th2-immune responses emerge at 6 weeks post infection, where they dominate and reach a steady state into the chronic stage of infection [adapted from (Pearce and MacDonald, 2002)].
2.2.5 Helminth immune modulation increases susceptibility to other diseases
Helminth infections are thought to impair host immune responses to many diseases, because they skew host immunity to Th2 rather than Th1-type responses typically associated with protection from infectious diseases (Chen et al., 2012, Horsnell and Brombacher, 2008, Horsnell and Brombacher, 2010). Parasitic infection play a role in altering susceptibility to autoimmune disorders and allergies, (Santiago Hda et al., 2015) through increased IgE and eosinophilic responses (Huang et al., 2015). This suggests that parasitic infection impairs host immune function through ongoing antigenic stimulation in various biological compartments (Bashir et al., 2002). Infection by helminths are known to increase the susceptibility for HIV
26 acquisition (Kroidl et al., 2016) and HPV infection (Gravitt et al., 2016)due to the systemic immune activation caused by these parasites.
2.2.6 Schistosomiasis as a risk factor for HIV acquisition
Understanding mucosal risk factors in the female genital tract is critical for understanding HIV susceptibility. Female urogenital schistosomiasis (FUS) could pose as a risk factor for HIV acquisition (Downs et al., 2011). A few epidemiological studies have highlighted increased risk for HIV acquistion in areas highly endemic for schistoma parasites (Downs et al., 2011, Kjetland et al., 2006, Ndhlovu et al., 2007). Furthermore, female genital schistosomaisis along with sexually transmitted infections (STIs) are associated with an increased susceptibility to HIV-1 acquisition, presumably because they create lesions in the genital mucosa allowing entry of the virus (Kleppa et al., 2014, Mbabazi et al., 2011).
Immunological studies have provided mechanistic insight into the relationship between schistosomiasis and risk for HIV acquisition. In addition to causing lesions in the genital mucosa, schistosomiasis also appears to increase HIV susceptibility through inducing chronic immune modulation (Secor et al., 2003). The various mechanisms put forward show that there is a bias towards the Th2 immune response and at the same time there is a downregulation of the Th1 response which may then increase the susceptibility to HIV infection (Pearce et al., 1991). This is further supported by evidence that CD4+ T-cells with a Th2 phenotype rather than a Th1 phenotype were more likely to be HIV-infected (Maggi et al., 1994), and in the presence of a background of a S. mansoni –HIV co-infection, these Th2 CD4+ T-cells are preferentially depleted [reviewed in (Mbabazi et al., 2011, Mwinzi et al., 2001)]. In addition, S. mansoni –HIV co-infection also depletes HIV specific CD8 T-cell responses further compromising immunity (McElroy et al., 2005). However, despite the decline of CD4+ and CD8+ T-cells with S. mansoni-HIV co-infection, upregulated surface expression of CCR5 and CXCR4 (major co-receptors that facilitate the entry of HIV into CD4+ T-cells) on target cells increase HIV infection of cells and replication (Secor et al., 2003). However praziquantel treatment in Schistosoma-HIV co-infected individuals have been shown downregulate CCR5 and CXCR4 expression (Secor et al., 2003), suggesting that
27 such treatment may indeed impact on the spread of HIV in high prevalence areas where HIV and Schistosoma spp prevail.
HIV-1 and STIs remain a public health challenge and the interplay between these and the presence of female genital schistosomiasis remains largely undefined. The CAPRISA 002 study focused on women that were in the acute phase of HIV infection and aimed to characterize the viral set point, clinical progression of subtype C infection and identify host genetic, viral and immune factors that may predict disease progression. In the CAPRISA002 Acute Infection cohort, Mlisana et al., (2012) demonstrated that both symptomatic and asymptomatic STIs resulted in increased concentrations of several soluble cytokines at cervicovaginal lavages (CVLs). These inflammatory cytokines were independent predictors of HIV acquisition in prospective follow-up, after accounting for multiple comparisons, including: IL-6 (HR 1.25, 95% CI 1.05-1.50), IL-1β (HR 1.28, 95% CI 1.07-1.54), IL-8 (HR 1.39, 95% CI 1.04-1.87) and sCD40L (HR 1.45, 95% CI 1.02-2.07; per 1 log10 pg/ml increase in cytokine concentration.
Pre-infection, Masson et al. (2015) further showed that in women with genital inflammation there was a >3.0 fold increased risk for HIV acquisition compared to women with no genital tract inflammation. Inflammation was defined as having 5 of 9 key pro-inflammatory cytokines (MIP-1α, MIP-1β, IP-10, IL-8, MCP-1, IL-1α, IL-1β, IL-6, and TNF-α) elevated in the genital tract. Genital tract inflammation, defined as being in the highest quartile for any combination of 5 of 9 inflammatory cytokines (including IL-1α, IL-1β, TNFα, IL-6, IL-8, IP- 10, MCP-1, MIP-1α, and MIP-1β) was associated with a 2.9-fold increase in risk of HIV acquisition overall.
Kedzierska and Crowe (2001) reported that Th1 cytokines (IL-2 and IFNγ) are generally suppressed during HIV infection, whilst Th2 cytokines (IL-4 and IL-10) are elevated. IL-10 treatment inhibited HIV replication in monocytes (Masood et al., 1994). The interplay between the Th1 and Th2 responses in the presence of genital inflammation due to STIs and parasitic infection remains poorly understood.
28 2.2.7 Anatomy and physiology of the female genital tract
The female reproductive tract has distinct anatomical compartments composed of the upper tract including the endocervix and uterus, and the lower tract including the ectocervix and vagina. The upper genital tract is a predominantly sterile environment, whilst the lower genital tract comprises a complex biome of commensal flora, including lactobacillus species, and sometimes pathogens (Huszar, 1991). Lactobacillus species promote vaginal health by producing lactic acid that lowers pH that is inhospitable to many non-commensal bacteria.
Predominance of Lactobacilli is negatively correlated with bacterial vaginosis (BV), a dysbiotic outgrowth of anaerobic bacteria (Lamont et al., 2011). Lactobacilli in the genital tract also produce hydrogen peroxide (H2O2), antibiotic toxic hydroxyl radicals, bacteriocins and probiotics (Lamont et al., 2011) which have antimicrobial activity.
The female vaginal tract has two types of epithelia: type I and type II. The type I epithelium of the endocervix is comprised of the simple columnar epithelium while the type II epithelium of the vagina and ectocervix mucosa comprises non-keratinized stratified squamous epithelium. This forms a natural barrier against pathogens (Rose et al., 2012). The region at which the two types of epithelia transition is known as the transformation zone, and is thought to be particularly susceptible to infections including human papillomavirus (HPV) and HIV. The sub-mucosa lies beneath the epithelium, which is the site of innate and adaptive immune cells.
2.2.8 Innate immune responses in the female genital tract
At mucosal barriers to the outside world, one of the first barriers against infection is mucus, which acts as a defense barrier for most invading pathogens. The lower reproductive tract in women is lined with mucus which covers the luminal surface (Iwasaki, 2010). In an aqueous matrix, the thick consistency of the mucus is due to its constituents such as glycoproteins and gel-forming mucins (Pudney et al., 2005). Goblet cells are responsible for producing and secreting mucus in type I epithelia, whilst local mucus-secreting epithelial cells produce
29 mucus in type II epithelia (Pudney et al., 2005). In the lower reproductive tract, goblet cells are found in the endocervical canal. Vaginal mucus also contains other immune defense molecules such as antibodies, antimicrobial peptides and enzymes.
In the lower reproductive tract, a variety of immune defense molecules [such as complement proteins, antimicrobial peptides which includes mannose binding lectins (MBLs) and secretory leukocyte protease inhibitors (SLPI)] are responsible for protecting the vagina against invading pathogens [reviewed in (Iwasaki, 2010)]. MBLs bind to carbohydrates on various, parasites, pathogens & bacteria. Complement proteins have been detected in cervicovaginal secretions, providing first-line defence against infectious agents colonizing the lower region of the reproductive system (Bulla et al., 2010). These molecules prevent interaction between the pathogens and vaginal epithelium by directly combating and killing foreign pathogens. These antimicrobial compounds are constantly produced by vaginal mucosal epithelial cells, and neutrophils present in the sub-mucosa and cervix [reviewed in (Iwasaki, 2010)]. Vaginal fluid also contains defensins and lysozyme that contribute to antimicrobial defense (Valore et al., 2002).
The presence of commensal flora at the vaginal mucosa has recently been shown to be central in maintaining genital health in women [reviewed (Spurbeck and Arvidson, 2011)].
Commensal bacteria typically found in the lower reproductive tract include Lactobacillus, Corynebacterium and Peptostreptococcus spp., with Lactobacillus species being the most prevalent [reviewed in (Spurbeck and Arvidson, 2011)].
Innate immune cells that provide protection against pathogens in the vaginal mucosa include macrophages, dendritic cells (DC), langerhans cells and γδ T cells [reviewed in (Milligan, 1999)]. Additional innate immune cells are recruited to the site of pathogen invasion, which include natural killer cells (NK cells), neutrophils, monocytes and plasmacytoid DCs (pDCs) (Pudney et al., 2005). Dendritic cells patrol and protect the vaginal environment through phagocytosis [reviewed in (Savina and Amigorena, 2007)]. Upon DC activation (Figure 2.6) by an invading pathogen, they migrate to the draining lymph node where they prime naïve T and B cells, initiating an adaptive immune response [reviewed in (Iwasaki and Medzhitov, 2004)].
30 Figure 2.6: Innate immune responses at vaginal mucosa. a) Innate immune cells such as DCs and macrophages patrol the vaginal lumen during a relaxed state whilst the epithelial layer of the vaginal lumen is still intact (no invading pathogen). b) Microabrasions of the epithelial layer occurs upon invasion of antimicrobial peptides, viruses and pathogens. Antigen presentations by DCs that detect pathogens occur and migration to the lymph node takes place. Infected macrophages release type I IFNs, whilst NK cells and monocytes are also released from the blood stream [taken from (Iwasaki, 2010)].
31 2.2.9 Adaptive immune responses in vaginal mucosa to pathogens
Upon detection of an invading pathogen, antigen presenting cells such as DCs take up foreign antigen at the mucosal surface, migrate to the lymph nodes and present to naïve CD4+ and CD8+T cells (Lee et al., 2009). Activated CD8+ T cells, which are also known to be cytotoxic, migrate to the site of infection and kill virus-infected cells expressing cognate antigen (Altfeld et al., 2002). CD4+ Th1 effector cells have the ability to protect against viruses by migrating to the mucosa and secreting interferon gamma (IFN-γ) (Iijima et al., 2008). Following infection, Th2 cells induce class switching (biological process that changes B cell’s immunoglobulin production from one type to another) in B cells, leading to antibody production (Toellner et al., 1998). Antibody-producing B cells constitute an important arm of the adaptive immune response in the genital mucosa. Sexual transmission of pathogenic viruses, parasites and bacteria are the most common causes of infection in the genital tract, with HIV being the most prevalent sexually-transmitted viral infection among women in SSA [reviewed by (Quinn and Overbaugh, 2005)].
Although less studied and less common, parasitic infection of the female genital tract, causing genital inflammation, could lead to an increased susceptibility to HIV-1 infection (Feldmeier et al., 1998).
2.2.10 HIV transmission across the vaginal mucosal barrier
The vaginal epithelium is a multi-layered thick, mucus-coated barrier that is almost impenetrable to invading viruses, bacteria and parasites. Lesions caused by female genital schistomomiasis provides opportunity for HIV to enter the mucosal barrier through these microabrasions and gain access to target cells in the submucosa, including CD4+ T cells, DCs, langerhans cells and macrophages [reviewed in (Magaisa et al., 2015)]. About 80% of new HIV infections are caused by a single HIV variant following vaginal transmission, usually referred to as a “bottleneck” (Keele et al., 2008).
However, in the presence of vaginal microabrasions, multiple viral strains may have a chance to permeate and enter the genital mucosae (Iwasaki, 2010).
32 Several mechanisms have been proposed for how HIV is able to cross the mucosal barrier and gain access to CD4+ target cells, including transcytosis of the epithelial layer, or entry through micro-lesions or microabrasions in the epithelial barrier [Figure 2.7; reviewed by (Shattock and Moore, 2003)]. Infection of Langerhans cells within the epithelium which can transmit virus to CD4+ target cells in the submucosa is another hypothesized method of transmission (Miller and Shattock, 2003). The transformation zone between the multi-layered squamous epithelia of the vagina and single-layered columnar epithelium in the endocervix was previously thought to be the most susceptible point for HIV infection because of the presence of high numbers of potential target cells like the CD4+ cells in this region (Carias et al., 2013). More recently, Stieh et al. (2014) showed that HIV also caused infection of the upper reproductive tract.
Figure 2.7: Mechanisms by which HIV crosses the vaginal mucosal epithelium [taken from (Shattock and Moore, 2003)]. Left figure panel represents HIV crossing the mucosal barrier in columnar epithelium (a) infection by HIV with viral RNA integrating into the DNA of host cells, (b) transcytosis of HIV virion through mucosal barrier & (c) transmigration of HIV virion that’s attached to a macrophage. The right panel of the figure represents the HIV mechanism of entry in
33 stratified epithelium, (d) HIV virions attach to Langerhans cells between the mucosal barriers due to (e) physical abrasions that allow HIV entry to occur with ease. As pathogens invade the mucosal barrier, dendritic cells come into contact with the viral particles for antigen presentation [reviewed in (Neutra and Kozlowski, 2006)].
Recruitment of HIV target cells in the female genital tract under cytokine gradients can strongly influence susceptibility to HIV acquisition. Other co-factors including STIs and parasitic infections have been associated with increased risk for HIV acquisition (Feldmeier et al., 1998). Parasitic infections may cause increased immune activation, particularly in co- endemic regions where STIs such as HIV and parasites co-exist (Bentwich et al., 1995).
Helminths that induce systemic immune responses could also alter the local mucosal immunity of the genital tract (Witkin et al., 2000).
Infection by Schistosoma spp remains a global challenge. Sub-Saharan Africa has the largest burden for both the Schistosoma infections and HIV. In particular, in South Africa, Kwa-Zulu Natal has the highest prevalence of HIV infections countrywide and is therefore epicenter for HIV. At the same time, KZN is also endemic for Schistosoma spp. and has the highest prevalence of this disease countrywide too. This study that was undertaken in two sites KwaZulu-Natal therefore focuses on the interplay between these two diseases and explores the immunological risk factors for HIV-acquisition in the presence of Schistosoma infection in the female genital tract.
The aims of this dissertation were to:
- Determine the prevalence and incidence of HIV in women with/without Schistosoma spp infections, by indentifying presence of schistosome DNA and Schistosoma spp antibodies in women who were part of the placebo arm of the CAPRISA 004 trial.
- Determine the differences in cytokine levels that play a role in genital inflammation in women with/without FGS and with/without HIV. This could help determine whether genital schistosomiasis influenced inflammation was associated with increased risk of HIV infection.
Specifically, the hypothesis was that women with detectable DNA specific for parasitic infection in the genital mucosae had elevated genital cytokine responses compared to women
34 who did not show evidence of infection placing these women at higher risk for HIV acquisition.
35 Chapter 3: Methodology
3.1 Study design and population
This study was a retrospective study of 383 women from the placebo arm of the CAPRISA 004 1% tenofovir micobicide gel trial (Abdool Karim et al., 2010a). Participants for the study were from both a rural community (Vulindlela, Kwa-Zulu Natal) and an urban community (eThekwini Clinic, Durban). All women consented to the study. This sub-study included specimens from two time-points for each women: study entry time-point (3 months post- enrollment) and study exit, with an average period of 3 years between the study entry and the study exit time-points. Cervicovaginal lavage (CVL) supernatants, CVL pellets and anti- coagulant dextrose plasma (ACD) samples were selected from both time-points for this sub- study.
3.2 Ethical considerations
The CAPRISA 004 trial, which assessed the safety and effectiveness of the vaginal microbicide 1% Tenofovir gel (Abdool Karim et al., 2010a) was approved by the Biomedical Research Ethics Committee (BREC 111/06). This sub-study underwent expedited ethics approval (BREC 333/13). A copy of the original ethics approval letter and expedited BREC approval letter for the sub-study are attached as Annexure 1 (Appendix).
3.3 CVL collection and processing
CVLs were obtained and processed as previously reported (Bebell et al., 2008, Mlisana et al., 2012). A volume of 5ml of sterile PBS was used to irrigate and repeatedly bathe the cervix.
The pooled cervicovaginal fluids that were aspirated from the vaginal vault using a sterile plastic bulb pipette were dispensed into sterile conical tubes and transported on ice to the laboratory for further processing. CVLs were centrifuged, and the supernatant was stored at
−80°C. CVL samples were not collected from menstruating participants, for whom sampling was postponed to the following week.
36 3.4 Plasma preparation
Whole blood collected into ACD tubes were spun down at 800 x g for 30min for the processing and storage of the ACD plasma samples. After centrifugation, the ACD plasma was pipetted out and stored at -80°C until further use.
3.5 HIV screening and testing
At each study visit of the CAPRISA 004 trial, two HIV rapid tests [Determine HIV 1/2 (Abbott Laboratories, Illinois, USA) and Uni-Gold Recombigen® HIV test (Trinity Biotech, Wicklow, Ireland)] were performed for each participant to confirm their serostatus. Study participants with concordantly positive, discordant or indeterminate results were assessed for possible seroconversion by means of two separate RNA PCRs (Roche Cobas Amplicor HIV- 1 Monitor v1.5, Roche Diagnostics, Branchburg, New Jersey, USA), approximately one week apart. When HIV seroconversion was confirmed, use of the microbicide or placebo product was discontinued and women were enrolled in local AIDS treatment services, including the CAPRISA AIDS Treatment Program which provided free antiretroviral therapy for HIV infected participants.
3.6 DNA isolation: Template for downstream Real-time PCR
DNA for real-time PCR was isolated from all CVL pellet samples using the MagNA pure isolation kits (Roche, Germany). Volumes of 50μl of reconstituted cervical pellets per sample were aliquoted into 32-well cartridges (Roche, Germany). According to the manufacturer’s instructions, the samples were lysed with lysis buffer, followed by a series of wash and precipitation steps with ethanol-based wash buffers using an automated extraction method involving the use of the MagNA pure 32 (Roche, Germany) for the extraction and the isolation of the DNA. The DNA was then eluted in 100μl of elution buffer that was supplied in the kit and was stored at -80oC until utilized. The concentration of DNA was quantified using the NanoDrop 2000 UV-Vis spectrophotometer (Thermo Fischer Scientific, USA) and only the DNA samples with a OD260/OD280 ratio of 1.8 were used. The DNA samples were then standardised to 1μg of DNA for each sample and for downstream use in real-time PCR amplification.
37 3.7 Preparation of S. mansoni DNA for PCR positive control
In order to verify the presence of the parasite in the clinical isolates of the DNA samples from the participants in this sub-study we amplified a region of Schistosome genome common to both S. mansoni and S. haematobium. This allowed the use of cercarial S. mansoni DNA as a postive control. Total DNA was extracted manually from the cercariae of S. mansoni, (obtained from the Division of Immunology, IDM, University of Cape Town) according to the manufacturer’s instruction using QIAamp DNA mini kits (Qiagen, USA). This cercarial DNA was used as a positive control for the real-time PCR assay when screening for the presence of both S. haematobium and S. mansoni DNA.
3.8 Primer Design, cycling conditions and Real-time amplification of target schistosomal DNA
Primers are short nucleic acid sequences that serve as a target specific starting point for PCR or DNA replication processes. Specific primers Ssp48F and Ssp124R (Kjetland et al., 2009) were designed and synthesized to detect a target region common to both Schistosoma species (Roche, Germany) and were validated in the Hasso-Plattner Laboratory at the HIV Pathogenesis Programme laboratory, University of KwaZulu-Natal. Oligonucleotides for Ssp48F &Ssp124R shown below in table 3.1 were used to amplify the 77-base pair (bp) fragment of the internal transcription spacer (ITS), homologous to both S. haematobium and S. mansoni species from DNA extracted from the CVL pellets. The ITS is the DNA spaced between small sub-unit ribosomal RNA (rRNA) and large sub-unit rRNA.
Table 3.1: Primer sequences Specific primers Sequence 5’- 3’
Ssp48F 5′-GGT CTA GAT GAC TTG ATY GAG ATG CT-3′
Ssp124R 5′-TCC CGA GCG YGT ATA ATG TCA TTA-3′
38 3.9 Real-time polymerase chain reaction for amplification of schistosomal DNA Real-time PCR was performed using the Light Cycler LC 480 (Roche, Germany) to detect Schistosoma spp. DNA in the CVL pellets from genital samples obtained through cervico- vaginal lavage. Samples that tested positive for schistosome DNA in the pellet of the CVLs were defined as women who were FGS PCR positive for the purposes of this study.
Furthermore in this study, women that were found to be schistosome DNA PCR positive in their CVL do not necessarily have FGS and not all women that have FGS would have tested positive by PCR for schistosome DNA in the CVL due to the insensitivity of the genital tract PCR (Kjetland et al., 2009, Randrianasolo et al., 2015). Cycling conditions used were as follows: 95oC for 5 minutes, 95oC for 30 seconds, 60oC for 30 seconds and 72oC for 30 seconds with a total of 55 cycles.
Each PCR reaction contained 10μl according to the Master mix reagents and volumes are shown below in table 3.2. Each of the DNA samples were run in in duplicate on a 96-well real-time PCR plate purchased from Roche. Each 96-well plate for PCR was run with a positive and a negative control. SYBR green was used as an intercalating fluorescent dye to detect the presence of double stranded DNA amplicons which would represent a positive result. In addition, the melting temperature of 81.2oC, or within range of 1oC when compared to the melting temperature of the positive control (81.2oC) were also used to confirm a positive PCR result. Furthermore, samples deemed as positive were also validated on a 1%
agarose gel to confirm molecular weights of PCR products with the use of a molecular base pair ladder (GeneRuler, ThermoFisher Scientific, USA).
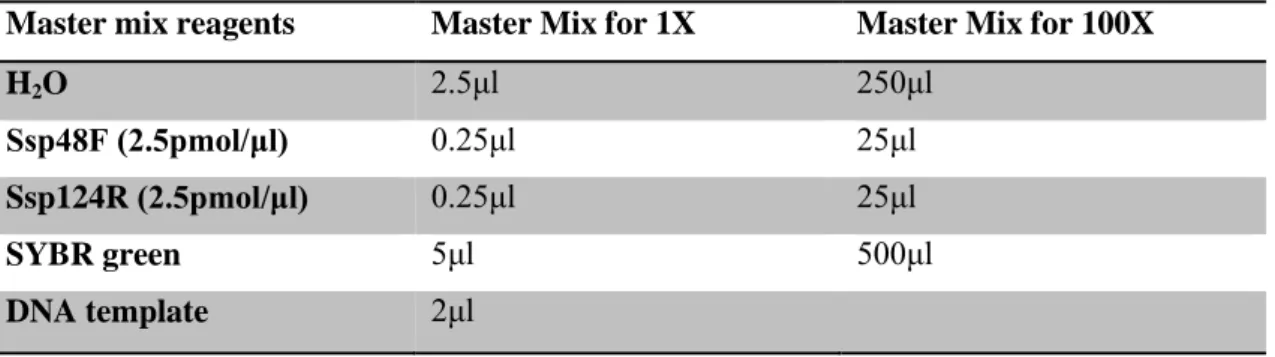
Table 3.2: Real-time PCR reaction volumes (10μl)
Master mix reagents Master Mix for 1X Master Mix for 100X
H2O 2.5μl 250μl
Ssp48F (2.5pmol/μl) 0.25μl 25μl
Ssp124R (2.5pmol/μl) 0.25μl 25μl
SYBR green 5μl 500μl
DNA template 2μl
Real-time PCR in general has specific advantages over conventional PCR. Conventional PCR is only measured at the end-point of the assay (plateau), whilst real-time PCR provides data
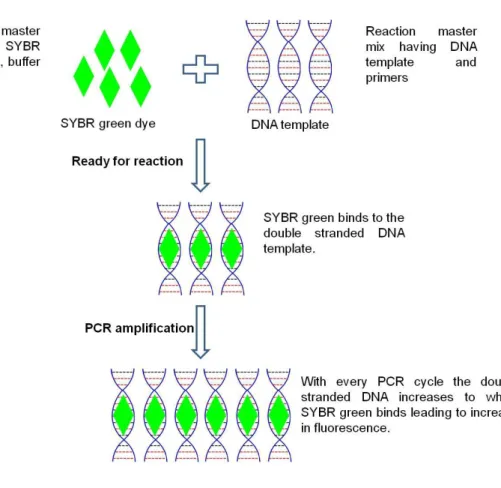
39 in the exponential growth phase of a reaction. Monitoring of melt curves also provides a definitive tool for the identification of PCR positive samples when looking at fluorescence history and melting temperatures. In real-time PCR, an increase in reporter fluorescence signal (Figure 3.1) is directly proportional to the amount of double-stranded DNA (amplicons) present.
Real-time PCR is therefore quantitative while conventional PCR is largely qualitative. The cleaved probe provides a permanent record amplification of the amplicons. For real-time PCR, there is an increase in dynamic range of detection and does not require post PCR processing.
Figure 3.1: RT-PCR principle using universal intercalating dye SYBR green (SG). As the amplification of DNA increases with every cycle, more SG is bound to the double stranded DNA, corresponding to a proportional increase in fluorescence [adapted from (Ali et al., 2011)].
40 Positive FGS PCR samples were identified by Ct (cycle threshold) values between cycles 15- 30 (Figure 4.1). Cycle threshold values are the fractional cycle of a PCR at which the normalized signal of the reporter dye intercepts the threshold. No Ct values were observed for Negative FGS PCR samples as the amplification curve (representing the reporter dye of the target) of the negative samples did not intercept the threshold.
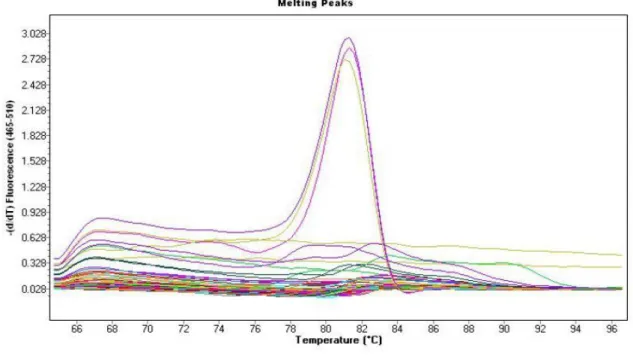
Figure 3.2: Melt peaks of real-time PCR assay showing melting curves temperatures of amplicons from nine participants positive for FGS at 81.5°C, thus validating specific PCR product.
Distinct peaks on melt peak plots are representative of the specific targeted PCR product.
Samples positive for FGS PCR that share the same melting temperature on melt peaks, are a clear indication of a specific PCR product. Melting temperature is the temperature at which the double stranded DNA product separates into two single strands. Polymerase chain reaction products of equal size share common melting temperatures. In this study, amplicons with a melting temperature of 81.5°C (Figure 3.2) were identified as FGS positive PCR products and confirmatory tests of the RT PCR products through agarose gel electrophoresis were performed in order to further validate that the amplicons were the same molecular mass
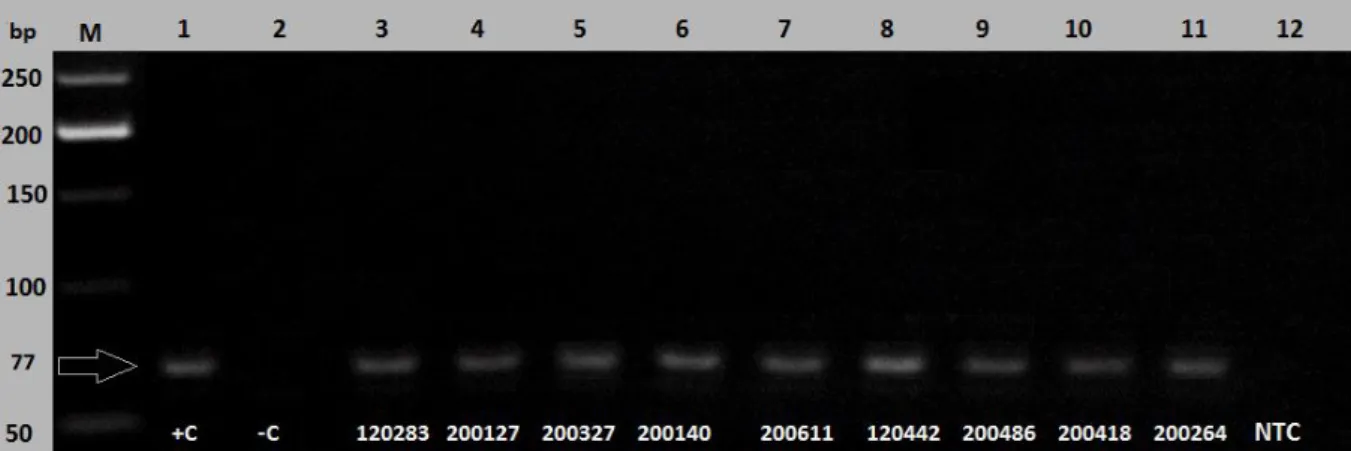
41 as that of the positive control. Figure 3.3 represents the 77 base pair FGS PCR amplicons that were amplified from the RT PCR reactions of the genital CVL specimens.
Figure 3.3: FGS PCR amplicons (77 bp) performed using a 1% agarose gel as a confirmation to the analysis of melt peaks from the real-time PCR data. The positive control together with the molecular weight ladder confirmed the positive results obtained. NTC = None-template control, +C = Positive control, -C = Negative control.
3.10 Cycle sequencing of PCR products and sequencing clean-up reaction prior to capillary electrophoresis
In order to validate FGS PCR amplicons, products were also amplified conventionally [Table 8.1 & 8.2, (Annexure 2, Appendix)] using Platinum Taq DNA polymerase (Invitrogen, USA) and subjected to DNA sequencing. DNA obtained from the genital CVL samples with the same molecular mass and sharing the same melt peaks as the positive control were then subjected to DNA sequencing with BigDye v3.1 terminator kits (Applied Biosystems, USA) on a 3130XL Genetic Analyzer (Applied Biosystems, USA). Sequencing clean-up reactions were performed using the 3M sodium acetate/100% ethanol precipitation with a dilution of 1:10. Sequencing was performed on the 3130 XL genetic analyzer (Applied Biosystems, USA). Sequence reaction volumes are shown below in table 3.3.
42 Table 3.3: DNA sequencing reaction volumes
Sequencing reagents Master Mix for 1X Master Mix for 12X
H2O 3.6μl 43.2μl
BigDye 0.4μl 4.8μl
5X sequencing buffer 2μl 24μl
Primer (1.6pmol/μl) 2μl 24μl
Amplified DNA from CVL pellets
2μl
3.11 Measurement of Schistosoma antibodies by ELISA
In order to detect the presence of Schistosoma haematobium/mansoni IgG antibodies (as a surrogate for exposure to the parasites), qualitative enzyme-linked immunosorbent assays (ELISA) were performed on all ACD plasma samples at both study time points. Due to the cross-reactivity of the IgG between the species, S. mansoni antigen used to coat the plates was supplied by the Division of Immunology at the University of Cape Town in order to detect antibodies to both S. haematobium or S. mansoni species. Plasma samples that were obtained from the Division of Immunology at the University of Cape Town, were from individuals confirmed to be sero-positive for schistosome infections. These samples were used as a positive control for each ELISA, on every plate run in order to validate the assay for detecting human IgG responses to S. mansoni antigen. Plasma samples that had no history of exposure to helminth infections as well as standard PBS were used as negative controls for each ELISA plate.
To pre-coat the ELISA plates (day 1), 96 well Nunc-Maxisorp plates (Nunc Maxisorp™;
ThermoFisher Scientific, Roskilde, Denmark) were coated with 50μl of 5μg/ml S. mansoni antigen and incubated for 3 hours at 37oC in a 5% CO2 incubator (ThermoFisher Scientific, USA). The antigen used to coat the plates was diluted 1:100 in carbonate buffer (the methods for the various wash and blocking buffers for this procedure is attached as Annexure 2).
Plates were then washed three times with each well containing 200μl of the 1X wash buffer to wash off any excess or unbound antigen. Blocking buffer was then prepared as a 2% milk powder in PBS and all wells were then blocked with 200 μl of blocking buffer overnight at 4oC and plates were wrapped in cling wrap to prevent evaporation.
43 On day 2, ELISA plates were washed three times with 200μl wash buffer 24 hours later.
Dilution buffer (made up using 1% bovine serum albumin PBS solution) was used to dilute ACD plasma samples. Dilutions of the plasma samples (80μl/reaction) were done on V- bottom 96 well plates, first a 1:50 dilution of ACD plasma sample into dilution buffer, followed by 1:5 dilution for a further seven serial dilutions in dilution buffer. The pre-diluted samples (50μl) were then transferred onto the ELISA plates and incubated at 4oC overnight for further processing.
On day 3, plates were washed three times each with 200μl/well of wash buffer 24 hours later.
Secondary antibody, mouse anti-human IgG (Fc)-AP (Clone JDC-10) (Biocom, Biotech, Berlin, Germany) was prepared as a 1:1000 dilution in dilution buffer and 50μl was added to each reaction well. Secondary antibodies were alkaline phosphatase conjugated, 4- Nitrophenyl phosphate disodium salt hexahydrate (PnP) was used as a substrate to develop the colour reaction. PnP (Sigma Aldrich, USA) was diluted in substrate buffer and 50μl of substrate buffer containing PnP was added to each reaction well (Figure 3.2). Plates were incubated at room temperature for 15 minutes to develop, and thereafter reactions were stopped with 25μl 1M NaOH once developed.
Plates were then read on the VersaMax ELISA microplate reader plate reader (Molecular devices, USA) with the use of Software Max Pro with using the following dual wavelength laser modules (LM). LM1 was set at 405nm and LM2= 492nm as the (reference wavelength). Optical density values > 1.0 in this study were regarded as positive and detectable IgG levels for S. mansoni (Vendrame et al., 2001) and was used to confirm that participants had exposure to this parasite and had experienced schistosoma infections.
Participants with S. mansoni IgG O.D values <1.0 were recorded as undetectable in this study.
44 Figure 3.4: Principle of indirect antibody ELISA used in this study. Alkaline phosphatase conjugated secondary antibody was used, that binds to primary antibody, causing substrate PnP to produce a yellow colour (Figure taken from http://www.leinco.com/indirect_elisa, March 2015,).
3.12 Measurement of CVL cytokine concentrations by Luminex Multiplex assay
In order to quantify for multiple cytokines in a limited sample volume, a multiplex assay was used for the quantitative determination the concentrations of 48 cytokines, chemokines, and growth factors in a relatively small volume of CVL sample. The advantage of using this multiplex assay is that a number of analytes can be quantified under the same laboratory conditions, decreasing the impact of inter-assay variability. In this approach, magnetic microscopic beads were coated with antibodies specific to cytokines that were bound using a chemical process of covalent binding (Figure 3.3). CVL was then added to the antibody- coated bead and antibody complex where the respective soluble cytokines present in the CVL would then bind. Fluorescent-labeled reporters are then able to bind to the captured cytokines. Target cytokines were identified and quantified by lasers that detected different wavelengths of the fluorescent labeled beads. Prior to the cytokine multiplex assays, each


![Figure 2.7: Mechanisms by which HIV crosses the vaginal mucosal epithelium [taken from (Shattock and Moore, 2003)]](https://thumb-ap.123doks.com/thumbv2/pubpdfnet/10698443.0/32.892.160.682.554.885/figure-mechanisms-crosses-vaginal-mucosal-epithelium-shattock-moore.webp)