Household formation subsequently remained stable throughout the 2000s, hiding variation in who formed which types of households. In this article, I examine the change in the denominator at the national level by describing trends in family formation. However, in South Africa, single-person households are also notable because of a long history of variable labor migration in the Southern African region (Wilson 2001).
Measurement - both conceptual and practical - is a central theme in the literature on households in South Africa. It is black African men who are at the vanguard of the meteoric rise in the rate of living alone, the group historically associated with circular labor migration. In the BHV and the GHS, households are asked to self-identify one household head.
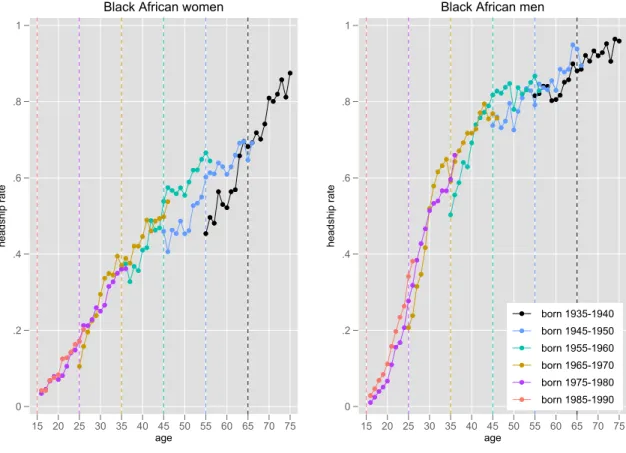
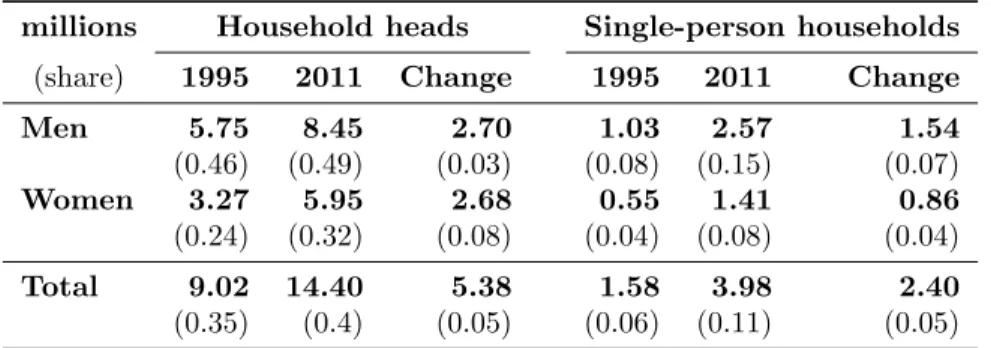
Note that single-person households are a subset of household heads and are always included in estimates for household heads. However, black African men were the only male group to increase their household formation rates in the 1990s, and this continued, albeit more slowly, in 2000. All female groups increased their household headship rates significantly in the 1990s years immediately after apartheid, after which their household formation roughly returned to keep pace with population growth in the decade of the 2000s.
In summary, household headship rates increased for women (older and older) and black African men in the 1990s before leveling off in the 2000s.
Getting a job or getting a grant
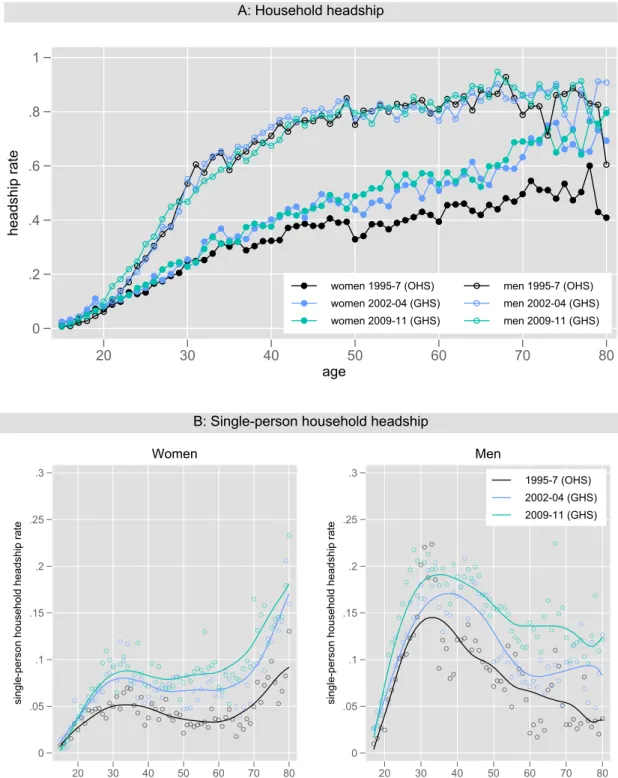
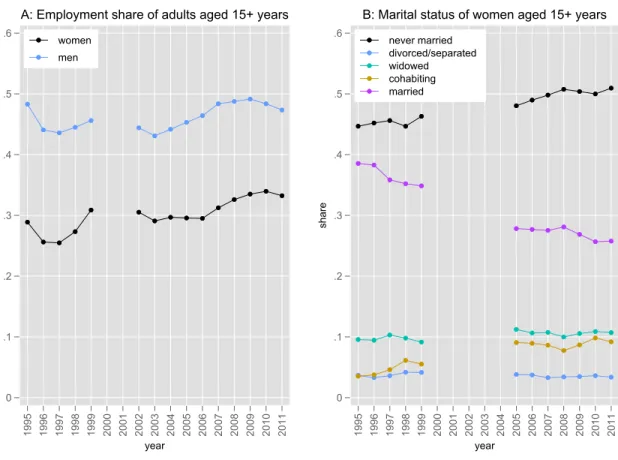
Getting older is associated with strengthening preferences for privacy and autonomy (Fafchamps & Quisumbing 2007), and I have already described age profiles of leadership in the previous section. Marriage is also a focal point for young adults' detachment from the parental household in the nuclear family pattern. The years 2002-4 are omitted for marital status because cohabitation was not separately distinguished in the questionnaire in these years.
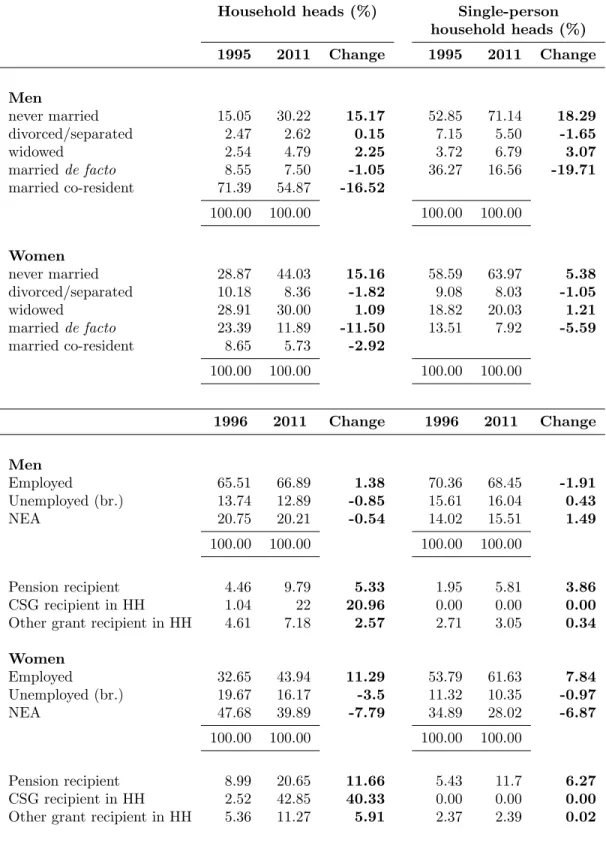
However, in all cases, female heads are about twice as likely as male heads to draw on grant income. Panel B of Figure 4 describes how marriage rates have fallen and led mainly to more never-married people than divorce. As high male unemployment in the post-apartheid period continued to destabilize the viability of marriage (Posel & Casale 2013), childbearing was largely disconnected from marriage (Hosegood et al. 2009).
There are four marital statuses consistently identifiable in the data: never married, divorced/separated, widowed, and married. However, both male and female heads increased by about 15 percentage points the percentage of heads who had never married. Single and widowed status were tied for the most common marital status for female heads of household in 1995 at about 29% each; but by 2011, the heads of never-married women were more likely to come in at 44%.
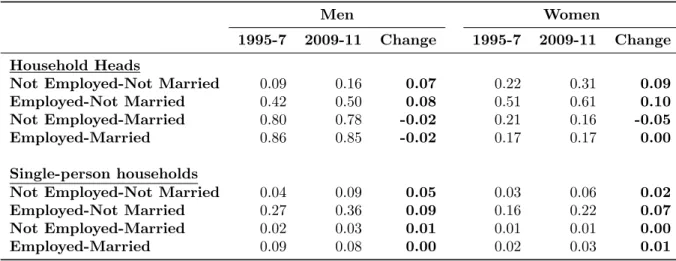
There have also been large increases in the percentages of never-married single-person households. In general, people who live alone are more likely to never marry than the combined group of heads of household. There was an 18.3 percentage point increase in the proportion of men living alone who had never married, resulting in over 70% of men living alone never having married in 2011.
This can be compared to the 23% of actually married female heads in the same year. But even in 2011, 17% of men living alone were de facto married, meaning they were likely migrants living in large households. An important question is to what extent marriage modulates ties among long-lived households and to what extent these ties might persist even in the absence of marriage.
Household formation behaviour
Notes: Own calculations using OHS-GHS series, weighted using Thornton & Wittenberg (2022b) survey weights. Notes: Own calculations using stacked OHS and GHS sets weighted using Thornton & survey weights. The key points that emerge from the previous sections and which I want to relate to household composition are that household formation patterns are strongly gendered, single-member households grow after the rains, and that never-married heads are an important group.
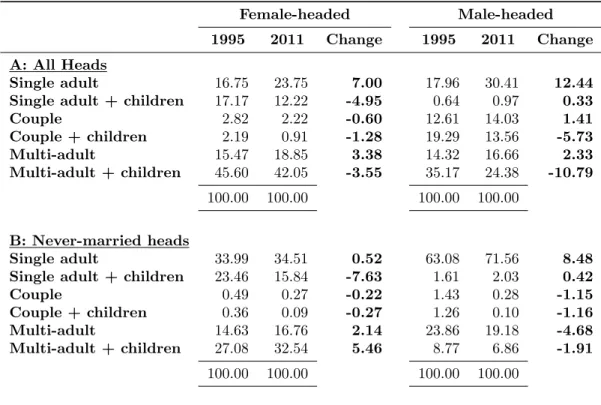
Notes: own calculations using a pooled series of OHS and GHS weighted using survey weights from Thornton. Until 2011, the most common form of headed household was the one-person household; while this was a very adult. All types of households with children declined as fertility rates fell (Moultrie & Timæus 2003), and multi-adult households with children declined particularly rapidly for men as one-person households increased in prevalence.
Single-person households have risen to be quite comfortably the second most common female-headed household type and multi-adult households are the only other category gaining ground over time, albeit only marginally so. Roughly equal shares of men and women head multi-adult households (which may include children of the head over 15), but closer examination of the members who make up these households (see Annex Table 5) shows that it is extended family members who become more common. Women are likely to head households alone with children, while this is almost never the case for men.
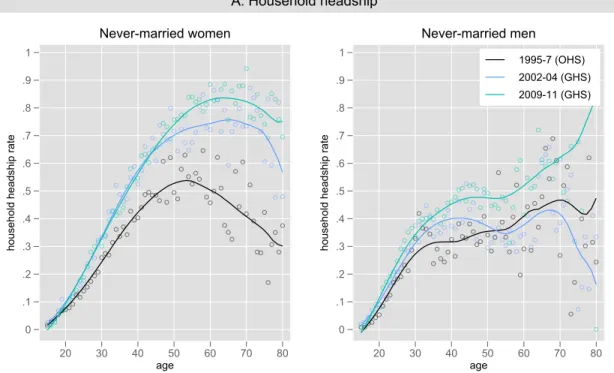
In previous debates about whether South African households were becoming more nuclear, single-person households were often treated as nuclear (Ziehl 2002). Given the growth in the number of never-married heads, it is particularly interesting to investigate which types of households are formed by never-married people, as reported in Part B of Table 4. In 2011, more than 70% of never-married male heads of households lived only in a consolidation of the pattern for heads in general.
For never-married female heads, the composition clusters at the poles: about a third of never-married female-headed households consist of a single household or of several adults with children. Despite declining fertility, the share of multi-adults with children has increased slightly, which also points to a consolidation of patterns in which women live with children. Appendix Table 6 shows that these households had more children of the head (both above and below the age of 15), as well as more grandchildren and other relatives.
Living alone as a driver of household gender polarisation
The increase in the number of households in South Africa was about double the increase in the population between census 1996 and 2011. Getting married is another path to household formation in the economic literature, but interestingly in South Africa it can be about don't get married in the first place. Black African men are at the forefront of the astonishing rise in single-person households in South Africa.
Younger women face very high unemployment rates in South Africa and are more dependent than men on marriage as a way out of the parental home (Thornton 2023). The sample consists of all households of a size greater than one person, headed by never-married persons. 2009), 'Female mortality from intimate partner violence in South Africa: a national epidemiological study', Violence and Victims. Gender equality and cultural diversity in South Africa', Constitutional Court Review Work in progress: expanding access to abortion services in South Africa after legalization', International Family Planning Perspectives.
1997), 'The Structure of Urban Black Households: New Survey Evidence from a Colored and an African Community on the Cape Flats in the Western Cape of South Africa', African Sociological Review Living Arrangements in South Africa, in. 2002), 'The continuing feminization of the labor force in South Africa: an analysis of recent data and trends', South African Journal of Economics. DataFirst (2015), South Africa - General Household Survey 2005 - Metadata, Technical Report, University of Cape Town, Cape Town.
2009), 'Surviving unemployment without state support: unemployment and family formation in South Africa', Journal of African Economies Trends in South African income distribution and poverty since the fall of apartheid, OECD Social, Employment and Migration Working Papers, no. 1991) Huizen Apart: The Separated Cities of South Africa, Indiana University Press. 2019), 'An empirical analysis of trends in women's labor market participation and the gender pay gap in South Africa',Agenda The South African Fertility Decline: Evidence from two censuses and a demographic and health survey',Population studies The economy and poverty in the twentieth century in South Africa, CSSR Working Paper No. 2020), Measuring labor migration after apartheid: Patterns and trends, in 'Migrant labor after apartheid: the inside story.', HSRC Press, Cape Town, chapter Living alone and depression in a developing country context: Longitudinal evidence from South Africa', SSM -Population Health The Economics of Households in South Africa, in A. Valodia, eds, 'The Oxford Handbook of the South African Economy', Oxford University Press, chapter Going Beyond Female-headed households: Household composition and gender differences in poverty', Development South -Africapp.
2016), 'Qualitative perceptions of the meaning of "headship" and female-headed households in post-apartheid South Africa', Social Dynamics How did racial discrimination develop in the labor market after the end of apartheid', South African Journal of Economics Demographic Transitions in South African cities: An analysis of household structures in the City of Tshwane', Regional Science Policy and Practice. 237, Center for Social Science Research (CSSR), Social Survey Unit, University of Cape Town, South Africa. 2001), 'The impact of labor migration on African families in South Africa: Yesterday and today', Journal of Comparative Family Studies.
Statistics South Africa (2017), Poverty trends in South Africa: A survey of absolute poverty between 2006 and 2015, Report No Government of South Africa, Pretoria, South Africa. 1995), 'Urban household structures in the Republic of South Africa', Family formations and dissolution: perspectives from east and west household formation in post-apartheid South Africa measurement and trends, PhD thesis, University of Cape Town.