UNIVERSITY OF KWAZULU-NATAL
ANALYSING THE ETHEKWINI GREEN ECONOMY ACCORDING TO ITS DYNAMIC AND COMPLEX
COMPONENTS FOR IDENTIFYING LEVERAGE POINTS
By
Magashen K. Naidoo 210549919
A thesis submitted in fulfilment of the requirements for the degree of Doctorate of Business Administration
Graduate School of Business and Leadership College of Law and Management Studies
Supervisors: Prof. A. Kader and Prof. C. Gerwel-Proches
2018
i
DECLARATION
I, Magashen. K. Naidoo, declare that
(i) The research reported in this thesis, except where otherwise indicated, is my original research.
(ii) This thesis has not been submitted for any degree or examination at any other university.
(iii) This thesis does not contain other persons’ data, pictures, graphs or other information, unless specifically acknowledged as being sourced from other persons.
(iv) This thesis does not contain other persons’ writing, unless specifically acknowledged as being sourced from other researchers. Where other written sources have been quoted, then:
a) their words have been re-written but the general information attributed to them has been referenced;
b) where their exact words have been used, their writing has been placed inside quotation marks, and referenced.
(v) Where I have reproduced a publication of which I am author, co-author or editor, I have indicated in detail which part of the publication was actually written by myself alone and have fully referenced such publications.
(vi) This thesis does not contain text, graphics or tables copied and pasted from the Internet, unless specifically acknowledged, and the source being detailed in the thesis and in the References sections.
Signed:
ii
ACKNOWLEDGEMENTS
A journey into the unknown is seldom embarked on in solitude. This journey tested my endurance, sanity, critical thinking and I conclude all the more stronger and resolute, albeit only through the support of my well-wishers.
Prof. Cecile Gerwel-Proches and Prof. Abdulla Kader, my academic supervisors, allowed me the flexibility to search the wilderness and let the process organically unfold, while constantly being present for solid advice. Their support and guidance through this process is highly appreciated.
Life is rarely experienced with the privilege of being able to dedicate focus on one aspect of life in totality. My parents, Nandagopa and Syamapriya, have gone beyond normal parental duties, and taken so many responsibilities and pressures off my plate, without which the completion of this Doctorate would not have been certain.
A special thanks to Ms. Shiksha Benimadho, Dr. Krish Kumar, Mr. Sibonelo Mbele, Ms. Chumisa Thengwa, Mr. Richard Boon, Mr. Jay Balwanth, Mr. Derek Morgan, Mrs. Simisha Pather-Elias, Mr. Derek Naidoo, Mrs. Ronel Mitchell, Mr. Deena Govender, Mr. Gideon Vundla and Mr. Musa Mbhele for your contributions that have led me to this point.
To all the respondents that completed the survey, or participated in the interview or focus groups – your time and willingness was critical for the completion of this research.
To Granny who held out to see me graduate.
DEDICATION
This Doctorate is dedicated to all my high school teachers who were certain that I was going to fail Matric.
iii
GLOSSARY
Anthropogenic activity: Human activity that results in the emission of greenhouse gases.
Complex Adaptive Systems: A type of system that is made up of more than two components that have the ability to learn and adapt to stimuli, from other components and the broader environment, within which the component is embedded.
Climate change: Long term change in climate patterns that often results in natural disasters, such as flooding, droughts and severe storms.
Climate change mitigation: Activities or interventions that either seek to decrease the amount of anthropogenic greenhouse gas emissions or sequestrate emissions from the atmosphere.
Energy efficiency: The reduction in consumption of energy, often electricity, for the same level of output.
Fossil fuels: Sources of energy that are derived from extraction of natural material from below ground.
Renewable energy: Energy that is derived from renewable, often natural sources that have the ability to replenish itself, such as solar energy, hydro power or wind power.
iv
LIST OF ABBREVIATIONS AND ACRONYMS
ABM: Agent-based Modelling.
ACE: Agent-based Computational Economics.
ACEGES: Agent-based Computational Economics of the Global Energy System.
BASA: Banking Association of South Africa.
C40: C40 Cities Climate Leadership Group.
CAS: Complex Adaptive Systems.
CH4: Methane.
CO2: Carbon dioxide.
COP: Conference of Parties.
DCCS: Durban Climate Change Strategy.
EMA: EThekwini Municipal Area.
GDP: Gross Domestic Product.
GHG: Greenhouse gas.
GVA: Gross Value Added.
GWh: Gigawatt hour.
HFC: Hydrofluorocarbon.
IDP: Integrated Development Plan.
IEP: Integrated Energy Plan.
INDC: Intended Nationally Determined Contribution.
IRP: Integrated Resource Plan.
KSEF: KwaZulu-Natal Sustainable Energy Forum.
LTMS: Long-Term Mitigation Scenarios.
N2O: Nitrous oxide.
NDC: Nationally Determined Contribution.
OD: Organisational Development.
PFC: Perfluorocarbon.
SASA: South African Sugar Association.
SDF: Spatial Development Framework.
SDG: Sustainable Development Goal.
SF6: Sulphur hexafluoride.
tCO2e: Tons of carbon dioxide equivalent.v
ABSTRACT
It is widely accepted that climate change is taking place as a result of anthropogenic activities. The rapid rate of the current bout of climate change being experienced is unprecedented. Climate change results in disastrous consequences for humankind.
However, climate change also offers opportunities which include the potential for developing a green economy. A green economy is a concept that will result in actions for enhancing the growth of an economy, while simultaneously protecting the environment and spurring progress towards social equity. This study was of the position that the eThekwini green economy is not well understood in terms of its dynamic and complex characteristics. Specifically, the core focus of the study was to identify the components that make up the eThekwini green economy, highlight the characteristics of the components, determine the manner in which those components interact, pinpoint leverage points in the system and develop a framework to depict the eThekwini green economy from the findings. Pragmatism was the guiding philosophical worldview for this research, which resulted in a mixed methods approach being adopted. Data collection tools included surveys, focus groups and interviews. The population and sample for this research consisted of sixteen purposely identified individuals for interviews. In addition, four hundred and ninety seven individuals were identified for survey participation and a total of twenty two for focus groups. It was noted during the study that many businesses that provide green related goods and services, do not view themselves as being part of the green economy. It is widely accepted that the eThekwini green economy does exist, albeit it has stemmed as organic growth from the broader economy. A total of seven key components were identified through the research, with a total of forty two sub components. In addition, a total of ten leverage points have been highlighted, the principal of which is that without addressing unemployment, discretionary income, inequality and Gross Domestic Product (GDP) per capita, the eThekwini green economy will not grow. It was further found that no component operates in isolation. Characteristics of components were broadly found to be made up of similar elements, but to differing degrees. A plethora of indicators were raised and synthesised into a matrix of five core indicator segments. All information gathered through the study resulted in the development of a framework that depicts the manner in which the eThekwini green economy operates.
vi
TABLE OF CONTENTS 1
CHAPTER ONE: INTRODUCTION ... 1
1.1 Introduction ... 1
1.2 Background ... 6
1.2.1 Climate change... 6
1.2.2 Green economy ... 13
1.2.3 EThekwini Municipality ... 17
1.3 Problem statement ... 19
1.4 Study aim and research questions ... 20
1.5 Limitations of the research ... 21
1.6 Assumptions of the research ... 22
1.7 Significance of the research ... 22
1.8 Overview of chapters ... 22
1.9 Conclusion ... 23
CHAPTER TWO: LITERATURE REVIEW: GREEN ECONOMY ... 25
2.1 Introduction ... 25
2.2 Definition of Economics ... 25
2.3 Green economy ... 26
2.3.1 Overview and definition ... 26
2.3.2 Sectors and components of the green economy ... 30
2.3.3 Green economy indicators ... 34
2.4 Sustainable Development Goals ... 37
2.5 South African legislation, frameworks, plans and strategies ... 40
2.6 Business risks ... 51
2.7 Organisational Development ... 53
2.8 Conclusion ... 54
CHAPTER THREE: LITERATURE REVIEW: THEORETICAL BASIS ... 56
3.1 Introduction ... 56
3.2 Discussion of various theoretical foundations for this research ... 57
3.2.1 Economic schools of thought ... 57
vii
3.2.2 Other relevant theoretical foundations ... 61
3.2.3 Complex Adaptive Systems ... 63
3.3 Agent-based Modelling ... 64
3.3.1 Introduction ... 64
3.3.2 Agent-based Computational Economics ... 65
3.3.3 Advantages and disadvantages of Agent-based Computational Economics ... 69
3.3.4 Previous relevant research ... 71
3.3.5 Need for Agent-based Computational Economics ... 88
3.4 Conclusion ... 89
CHAPTER FOUR: RESEARCH METHODOLOGY ... 91
4.1 Introduction ... 91
4.2 Philosophical worldview ... 92
4.3 Strategy of inquiry ... 94
4.4 Population and sampling strategy ... 95
4.4.1 Population ... 96
4.4.2 Sampling ... 98
4.4.3 Amended population and sample ... 99
4.5 Data collection tools ... 101
4.5.1 Pilot survey and main survey ... 101
4.5.2 Interviews ... 102
4.5.3 Focus groups ... 104
4.5.4 Data collection and transcription process ... 105
4.6 Data analysis ... 107
4.6.1 Quantitative research ... 107
4.6.2 Qualitative research ... 108
4.6.3 Quantitative and qualitative research comparison ... 109
4.7 Data validation ... 110
4.7.1 Quantitative research ... 110
4.7.2 Qualitative research ... 110
4.8 Data reliability ... 112
4.8.1 Quantitative research ... 112
4.8.2 Qualitative research ... 112
viii
4.9 Bias and ethical considerations ... 113
4.10 Conclusion ... 113
CHAPTER FIVE: RESULTS ... 115
5.1 Introduction ... 115
5.2 Qualitative research: Interviews ... 119
5.2.1 Tag cloud ... 121
5.2.2 Themes ... 122
5.3 Qualitative research: Focus groups ... 168
5.3.1 Tag cloud ... 168
5.3.2 Themes ... 169
5.4 Quantitative research: Surveys ... 194
5.4.1 Response rate ... 194
5.4.2 Components ... 195
5.4.3 Collaboration with other components ... 196
5.4.4 Contribution to the green economy ... 198
5.4.5 Decisions made in a rational manner ... 199
5.4.6 Importance for the green economy ... 200
5.4.7 Size of the components ... 201
5.4.8 Interaction of components with the green economy... 202
5.4.9 Time lag in response to stimuli ... 203
5.4.10 Intensity of decisions on the economy ... 203
5.4.11 Random decision making ... 204
5.4.12 Indicators ... 209
5.5 Conclusion ... 210
CHAPTER SIX: DISCUSSION ... 212
6.1 Introduction ... 212
6.2 Response rate: Data collection ... 212
6.3 Existence of the eThekwini green economy ... 214
6.4 Components of the eThekwini green economy ... 216
6.5 Leverage points of the eThekwini green economy ... 224
6.6 Characteristics of the eThekwini green economy ... 230
6.7 Interaction ... 233
ix
6.8 Challenges of the eThekwini green economy ... 235
6.9 Indicators for the eThekwini green economy ... 237
6.10 Framework for understanding the eThekwini green economy ... 243
6.11 Conclusion ... 257
CHAPTER SEVEN: CONCLUSIONS AND RECOMMENDATIONS ... 259
7.1 Introduction ... 259
7.2 Context and background ... 259
7.3 Literature ... 263
7.3.1 Green economy ... 263
7.3.2 Theoretical foundation of this research ... 266
7.4 Research methodology ... 268
7.5 Key findings and results ... 270
7.5.1 Survey ... 270
7.5.2 Interviews ... 271
7.5.3 Focus group ... 272
7.6 Discussion and analysis ... 274
7.7 Key research questions ... 277
7.7.1 What are the components of the eThekwini green economy and their key characteristics that affect business growth and the reduction of greenhouse gas emissions? ... 277
7.7.2 How do the components interact with other components of the eThekwini green economy and what are the leverage points? ... 280
7.7.3 Can a framework be developed to depict and set the basis for simulating the components of the eThekwini green economy and the manner in which they interact? ... 283
7.8 Contribution of the research ... 284
7.9 Recommendations for the eThekwini green economy ... 285
7.10 Recommendations for future research ... 289
7.11 Conclusion ... 289
REFERENCES ... 291
ANNEXURE ONE: FORMAL REQUEST FOR SURVEY PARTICIPATION ... 341
ANNEXURE TWO: SURVEY ... 342
x
ANNEXURE THREE: REQUEST FOR INTERVIEW PARTICIPATION ... 348
ANNEXURE FOUR: INTERVIEW QUESTIONS ... 349
ANNEXURE FIVE: REQUEST FOR FOCUS GROUP PARTICIPATION ... 350
ANNEXURE SIX: PRE-FOCUS GROUP READING NOTE ... 351
ANNEXURE SEVEN: ETHICAL CLEARANCE APPROVAL LETTER ... 353
xi
LIST OF FIGURES
Figure 1.1: The greenhouse effect ... 8
Figure 1.2: Historic greenhouse gas emissions of the eThekwini Municipal Area ... 11
Figure 1.3: Decoupling of gross domestic product and greenhouse gas emissions ... 14
Figure 1.4: Location of eThekwini Municipality ... 17
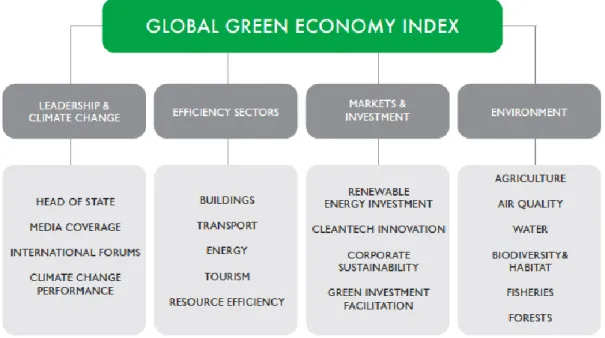
Figure 2.1: Global Green Economy Index Indicators ... 35
Figure 2.2: Green City Index: European Region ... 36
Figure 2.3: Sustainable Development Goals ... 38
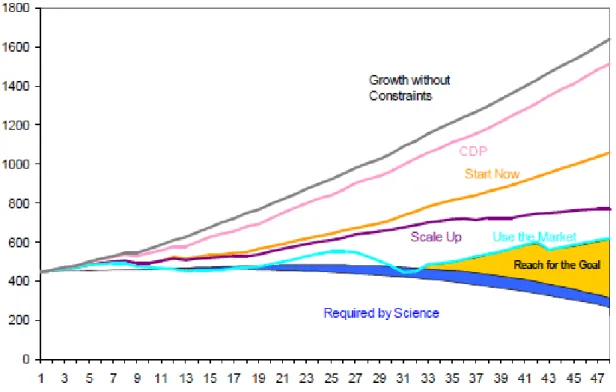
Figure 2.4: South African Long-Term Mitigation Scenarios... 45
Figure 3.1: Working of a classifier system ... 69
Figure 3.2: Interaction between agents of Aspen Model ... 78
Figure 3.3: Intelligent Agent-based Order Simulation System ... 84
Figure 4.1: Qualitative data analysis process ... 108
Figure 5.1: Mind map of themes: Interviews ... 116
Figure 5.2: Mind map of themes: Focus groups ... 117
Figure 5.3: Mind map of survey data ... 118
Figure 5.4: Tag cloud collated interview data ... 121
Figure 5.5: Tag cloud for focus groups ... 168
Figure 5.6: Survey response rate ... 194
Figure 5.7: Components of the eThekwini green economy identified through the survey... 195
Figure 5.8: Mean collaboration of components with other components ... 197
Figure 5.9: Mean contribution of components to the green economy ... 198
xii
Figure 5.10: Mean decisions of components made in a rational manner... 199
Figure 5.11: Mean importance of components for the green economy ... 200
Figure 5.12: Mean size of components within the green economy ... 201
Figure 5.13: Mean interaction of components with the green economy ... 202
Figure 5.14: Mean time lag of components response to stimuli ... 203
Figure 5.15: Mean intensity of components decisions on the green economy ... 204
Figure 5.16: Randomness of government decisions ... 205
Figure 5.17: Randomness of banks and finance decisions ... 205
Figure 5.18: Randomness of consumers’ decisions ... 206
Figure 5.19: Randomness of energy sector decisions ... 207
Figure 5.20: Randomness of waste and recycling sector decisions ... 207
Figure 5.21: Randomness of legal and regulatory sector decisions ... 208
Figure 5.22: Randomness of private sector decisions ... 208
Figure 5.23: Indicators for the eThekwini green economy ... 210
Figure 6.1: Components of the eThekwini green economy identified through the survey... 217
Figure 6.2: Components of the eThekwini green economy ... 219
Figure 6.3: Leverage points of the eThekwini green economy ... 229
Figure 7.1: Components of the eThekwini green economy ... 279
Figure 7.2: Leverage points of the eThekwini green economy ... 282
Figure 7.3: Components of the eThekwini green economy ... 283
xiii
LIST OF TABLES
Table 1.1: Energy per capita emissions of cities... 12
Table 1.2: Long term employment potential for select sub-sectors ... 15
Table 1.3: Average number of employees per green company in the eThekwini Municipal Area ... 16
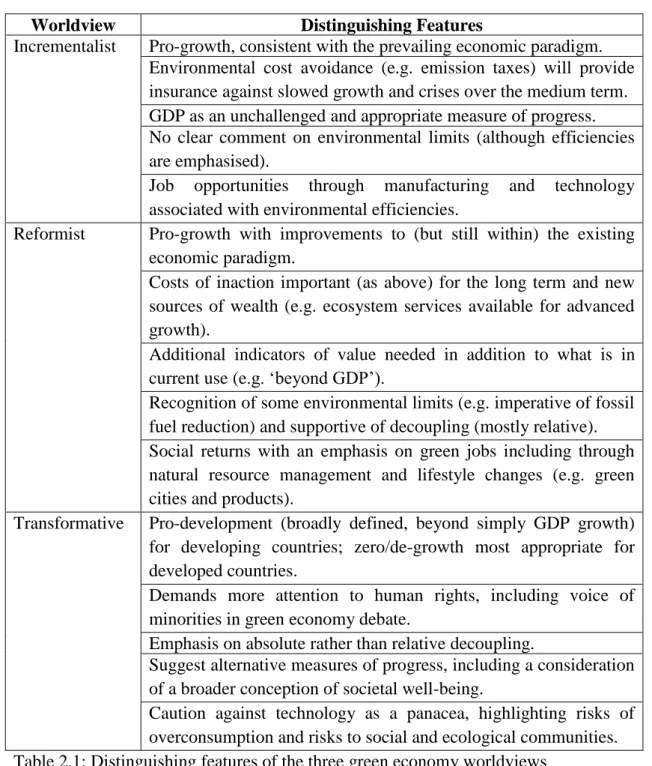
Table 2.1: Distinguishing features of the three green economy worldviews ... 29
Table 3.1: Parameters of manufacturers in the EURACE model ... 73
Table 4.1: Breakdown of identified business in the eThekwini green economy ... 97
Table 4.2: Final population and sample of the research ... 101
Table 4.3: Details of interviews conducted... 103
Table 4.4: Details of focus groups conducted ... 105
Table 5.1: Demographics of interview participants ... 120
Table 5.2: Overview of focus group participants ... 169
Table 5.3: Medium, mode and range of collaboration with other components ... 197
Table 5.4: Medium, mode and range of contribution of components to the green economy... 198
Table 5.5: Medium, mode and range of decisions of components made in a rational manner ... 199
Table 5.6: Medium, mode and range of importance of components for the green economy... 201
Table 5.7: Medium, mode and range of size of components within the green economy ... 202
1
CHAPTER ONE: INTRODUCTION
1.1 IntroductionThis research aims to dissect the eThekwini green economy to identify the components that make up the eThekwini green economy, the characteristics of the components and the manner in which components interact with other components.
Thereafter, Agent-based Computational Economics (ACE) will be utilised as a theoretical underpinning to develop a framework that will be based on primary and secondary data that emanates from this research, to illustrate the manner in which the eThekwini green economy operates. The framework will allow insight into the eThekwini green economy by all stakeholders who are not necessarily savvy with the use of modelling tools.
It is important to note that due to the nature of the research and identified methodologies, especially the complexity related theoretical aspects, this research will identify and discuss a multitude of different thematic areas. Those varying thematic areas are critical for a thorough analysis of the eThekwini green economy, which would then yield a clearer understanding of the eThekwini green economy. While there are a plethora of scientific, economic and social aspects in this thesis, it has been structured in a manner that begins with the root causes and then disaggregates the line of research from that point.
There is verifiable proof that climate change is occurring (Oppenheimer and Antila- Hughes, 2016; Riebeek, 2010; Ross et al., 2016; Myers et al., 2015). This is supported by the Intergovernmental Panel on Climate Change (2014) which states that not only is climate change occurring but it is as a result of anthropogenic causes. Salinger (2005) further adds that from 1000’s to the early 1900’s worldwide surface air temperature has varied by 0.5°C, however from the early 1900’s the average temperature has risen by 0.6°C. The increase in temperatures are supported by Intergovernmental Panel on Climate Change (2013) who states that a warming of between 0.65°C and 1.06°C from 1880 to 2012 has occurred for land and ocean surface temperatures. The National Aeronautics and Space Administration (2016) further supports the notion that temperatures have risen by 1°C from the late 1800’s.
2
According to the World Economic Forum (2016) the failure of climate change mitigation and adaptation is ranked as the highest risk in 2016, for the coming future, ahead of ‘weapons of mass destruction’ in second place and the ‘water crisis’ in third place. The notion that climate change is the biggest entrenched risk, which is currently being experienced, is supported by He (2016) and Frankhauser and Stern (2016) who also state that it could result in severe feedback loops. A critical failure of business leaders to acknowledge that climate change presents imminent challenges is further raised by the World Economic Forum (2016). However, Dietz et al. (2016) observes that businesses are becoming more cognisant of the potential impacts of climate change.
The 2017 Global Risks Report published by the World Economy Forum (2017) takes into account the alarming discontent in various countries, such as the United Kingdom and the United States of America, that have given rise to nationalist agendas and champions. It should be noted that according to the World Economy Forum (2017) climate change mitigation and adaptation has shifted from the highest impact risk to the fifth highest, in terms of impact; but with the vast majority of the highest risks having direct environmental linkages. A critical point highlighted by the World Economic Forum (2017) is that a systemic approach should also take into account risks that will emerge from the initiatives that seek to address environmental issues.
In an ever-increasingly complex world the linkages between climate change and business are growing stronger and more powerful. This is supported by Hoffman (2016) who states that businesses approach climate change as an evolving matter with demands from various sources such as government, consumers, financial institutions and suppliers, to name a few. Hoffman (2016) goes on to state that the implications of climate change on various businesses will be diverse, but businesses have a unique opportunity to drive climate change actions, as they are the producers of the bulk of the goods and services that humans consume. The position that businesses will be affected by climate change is supported by Gasbarro and Pinkse (2016) and Amran et al. (2015).
There is ultimately a perilous nexus between risks faced by the broader population and businesses. It should be acknowledged that consumers and employees, amongst other stakeholders, come from communities which would be impacted by climate
3
change, along with critical infrastructure, this will have a substantial effect on the ability of companies to continue their operations (United Nations Global Compact, 2011).
In addition to businesses, the Carbon Disclosure Project (2015) states that cities are critical for climate change mitigation initiatives. This is due to approximately 75% of greenhouse gas (GHG) emissions emanating from cities. The United Nations Habitat (2011) supports this by stating that cities can contribute up to 70% of GHG emissions.
However, Dodman (2009) states that cities are often accused of emitting the bulk of emissions, but the per capita emissions of cities can be lower than per capita national GHG emissions. Dodman (2009) also adds that cities have substantial potential for decreasing emissions. Satterthwaite (2008) supports the counter argument that cities should not be blamed for the bulk of emissions. However, it is not disputed that cities are still a substantial source of GHG emissions and have vast potential to decrease those emissions.
As can be gleaned from Hoffman (2016) and Carbon Disclosure Project (2015) there are a variety of stakeholders that are imperative for the successful implementation of climate change initiatives. It should be further noted that these stakeholders will have to work in tandem with each other and the relationships amongst them should be comprehensively understood, to allow for targeted stimulation initiatives.
While climate change has a myriad number of negative consequences, it also presents a number of opportunities such as South Africa’s vast resources of solar and wind (Montmasson-Clair, 2012). Montmasson-Clair (2012) further adds that the green economy has the potential of delivering economic growth, jobs and environmental and social benefits. This is supported by Cosbey (2011) and Barbier (2016). As a result there are a vast number of opportunities for businesses in the green economy.
The opportunities should not be viewed independently of further challenges; Kaggwa et al. (2013) states that South Africa is reliant on industries that have a high carbon intensity and measures taken to reduce emissions will negatively impact poverty levels, increase unemployment and inequality according to Montmasson-Clair (2012).
Kaggwa et al. (2013) further adds that South Africa will continue to be reliant on coal for energy. However, this is changing, the contribution of installed capacity of
4
renewable energy that has been contracted by Eskom, as of March 2016, is 3901MW from Independent Power Producers (Eskom, 2016).
Frankhauser and Stern (2016) state that economic development and climate change actions do not have to be mutually exclusive and pursuing low carbon economic objectives can be achieved while simultaneously reducing poverty. This is supported by Montmasson-Clair (2012).
A pertinent point for this research raised by Frankhauser and Stern (2016, pg. 23) is
“Standard growth theory, general equilibrium and marginal methods will, as ever, have much to contribute but they will be nowhere near sufficient. This is about immense risks and radical change were time is of the essence. We should seek a dynamic economics where we tackle directly issues involving pace and scale of change in the context of major and systemic risks”.
This is further supported by Chapman et al. (2016) who highlights the importance of understanding systemic features for policy development and in the process of a co- evolutionary approach being utilised to understand cities some fundamental knowledge could be refuted.
There has been numerous pieces of research that seek to explore aspects of a green economy. This has largely been undertaken in a disaggregated approach, where research questions focus on minute aspects of a green economy. It was observed in the literature that there has been few very research attempts that encompass the green economy in totality; even fewer research attempts exist that seek to understand the green economy through a complex systems lens. However, there has been economic research and models developed in Europe and America with a complex systems lens but for the broader economy, such as EURACE and the Aspen models which will be discussed later in the thesis. At a national level, system dynamics has been predominately utilised to research the green economy and largely in one province only of South Africa. No research was found where an African city’s green economy is scrutinised and researched through an ACE underpinning to understand the way in which the local green economy operates.
There is a need for ACE theory and models, and related complexity theories and models, to be utilised as a foundation for contributing to the understanding of green
5
economies, amongst other areas. This lies in the ability of ACE and complexity theory, at large, to incorporate a plethora of various components, or even thematic areas, from which unforeseen aspects can emerge (Gatti et al., 2010; Irwin, 2010).
This is often from different thematic areas, for example, in the case of a green economy it would include environmental, economic and social issues (United Nations Environment Programme, 2010; United Nations Economic Commission for Europe and United Nations Environment Programme, 2011). Often the ‘adapter’ to understand the different thematic areas and to get the thematic areas to link into each other in a coherent manner is sorely missed and deeper insight is missed. This can be solved by ACE and related complexity theories. This is not to say that there are no models that can assist, but rather complexity offers the ability for the unseen to become visible (Tesfatsion, 2003; Levy, 2009). This means the emergent qualities start to become apparent with simulations or framework assessments, and can then be traced to leverages points, which would have the ability to catalyse any effort or any system. The inherent complications when dealing with large and diverse datasets, components and feedback loops makes developing ACE and complexity models and frameworks are copious. It is the position of this research that developing such models and frameworks, in an African context, at a country level, will become too complex. To demonstrate as an example, South Africa is a very diverse country, there are eleven official languages and incorporating the nuances of each culture or region into a national ACE or complexity related framework and model will not reveal the unseen that we are searching for – as it is unlikely, at this point, that resources and technical abilities will be able to process the sheer complexities. The same can be said for provincial models and frameworks. The best level at which to pitch these models and frameworks is at a Municipal level, not a city level which is at a lower level. This will then allow the appropriate datasets and components to be taken into account, resulting in a complexity based model or framework that is not too complicated and situated at the right level for translation into implementation activities – as Municipalities are generally considered the ‘implementation arm’ of the three spheres of government in South Africa.
This chapter will provide background and context on climate change which will include the fundamentals of climate change and provide a comparison of GHG emissions against other cities. Thereafter, the Paris Agreement and the Deadline 2020
6
research will be discussed. The next sub-section will focus on providing an overview of the green economy, traditional sectors of the green economy and then hone in on the broader eThekwini economy. Thereafter, the problem statement of the research will be presented, along with the key research questions, research limitations, assumptions and significance of the research. The penultimate section of this chapter will then provide an overview of forthcoming chapters. A concluding section will round off the chapter.
1.2 Background
1.2.1 Climate change
1.2.1.1 Overview of climate change
According to the Australian Academy of Science (2015) the world has experienced climate change before, however, what makes the current bout of climate change so concerning is the rapid pace at which it is occurring. Oppenheimer and Antila-Hughes (2016) and Riebeek (2010) support the position that climate change has been previously experienced and that the current episode of climate change is being experienced within a shorter timeframe.
There are two approaches to address climate change: mitigation and adaption.
Climate change mitigation, according to the United Nations (2015), seeks to limit the future emissions of GHGs and promote interventions that will remove GHGs from the atmosphere that have already been emitted by anthropogenic activity.
The World Resources Institute et al. (2016) developed a standardised protocol for cities to account and report their GHG emissions. In that protocol the following GHGs are accounted for: carbon dioxide (CO2), methane (CH4), nitrous oxide (N20), sulphur hexafluoride (SF6), perfluorocarbons (PFCs) and hydrofluorocarbons (HFCs).
While CO2 is the most abundant of the GHGs, it has a global warming potential of one. CH4 is by far not as abundant but is twenty eight times more harmful than CO2
(Myhre et al., 2013; World Resources Institute et al., 2016). It should be noted that GHGs are emitted through natural phenomenon and anthropogenic activities (Tian et al., 2016; Sahely et al., 2006).
7
Carbon that is added to the natural carbon cycle by anthropogenic activities causes the carbon cycle to go off balance, this change in the natural cycle results in a contribution to the greenhouse effect (Riebeek, 2011; Malhi et al., 2002).
Anthropogenic activity that contributes to GHG emissions and as a result cause the carbon cycle to go off equilibrium, include forest degradation (Pearson et al., 2017), agricultural activities (Vetter et al., 2017; Bennetzen et al., 2016), fossil fuel derived electricity (De Gouw et al., 2014; Pfenninger and Keirstead, 2015), transportation (Pålsson and Kovács, 2014; Velazquez et al., 2015) and manufacturing (Yan and Fang, 2015; Ramli and Munisamy, 2015).
Anthropogenic emissions are effectively added to the carbon cycle and this increases the total amount of GHG emissions in the atmosphere, or cycle, which contributes to the ferocity of the greenhouse effect. According to Solomon et al. (2007) and Myhre et al. (2013), the greenhouse effect is a natural phenomenon, which sustains the Earth’s warmth. However, the emitting of GHGs, which accumulate in the atmosphere, leads to a greater degree of warming. This is depicted in Figure 1.1. The sun emits energy which is absorbed by the earth’s landmass, oceans and atmosphere, while reflecting some of the energy (heat) back into space. The GHGs that have accumulated in the atmosphere are responsible for containing some of the heat within Earth’s atmosphere. As the amount of GHGs increase so too will the amount of heat that is retained in the Earth’s atmosphere. According to Oppenheimer and Antila- Hughes (2016) and Demarée and Verheyden (2016), without the greenhouse effect life would not be possible on Earth as the temperate would be far below freezing, this is supported by Anderson et al. (2016).
8 Figure 1.1: The greenhouse effect
Source: Author.
According to Pachauri et al. (2014), there is an extremely high degree of certainty that anthropogenic activity, which leads to the emitting of GHGs and ultimately an increase in the greenhouse effect, results in global warming, this is supported by Cook et al. (2016).
According to Naqvi and Seijan (2011, pg. 20), “Global Warming defined as the increase of the average temperature of earth as the earth is getting hotter with disasters like frequent hurricanes, droughts and floods”. Anyona and Rop (2016, pg.
127) add “Global warming is a climate-related hazard that affects atmospheric and ocean processes in any given ecosystem”.
The Intergovernmental Panel on Climate Change (2007, pg. 30) defines climate change as“… a change in the state of the climate that can be identified (e.g. using statistical tests) by changes in the mean and/or the variability of its properties, and that persists for an extended period, typically decades or longer. It refers to any change in climate over time, whether due to natural variability or as a result of human activity”.
Earth’s Atmosphere
9
The Intergovernmental Panel on Climate Change (2013) go on to highlight that each region and locality will face different impacts as a result of climate change, which is confirmed by Arnell et al. (2016). The broad impacts that cities can anticipate are droughts (eThekwini Municipality, 2014a; Salinger, 2005), floods (eThekwini Municipality, 2014a; Douglas et al., 2008), increase in severe storms (eThekwini Municipality, 2014a; Roberts and O’Donoghue, 2013), sea-level rise (Oppenheimer and Antila-Hughes, 2016; eThekwini Municipality, 2014a; Yang et al., 2014) and negatively impacted food security (Wheeler and von Braun, 2013; Roberts and O’Donoghue, 2013).
According to the Intergovernmental Panel on Climate Change (2014), adaptation seeks to negate the negative impacts of climate change. This can be further supported by Noble et al. (2014, pg. 836) “Adaptation needs arise when the anticipated risks or experienced impacts of climate change require action to ensure the safety of populations and the security of assets, including ecosystems and their services”.
1.2.1.2 Climate change mitigation measures
As mentioned briefly in the previous section of this chapter, there are two methods of mitigating GHG emissions from anthropogenic activity. These are discussed below.
The first method is the reduction of GHGs emitted from anthropogenic activity. It should be noted that while a reduction in emissions is sought, the fundamental value that human’s derive from these activities should remain constant or must be enhanced while undertaking mitigation measures.
The most common mitigation interventions to reduce GHG emissions include the utilisation of renewable energy (Dechezleprêtre et al., 2011; Ludig et al., 2011;
Panwar et al., 2011), energy efficiency (Dechezleprêtre et al., 2011; Bauer et al., 2016; Fujimori et al., 2014), non-motorised transport (Gouldson et al., 2016;
Kusakabe et al., 2015; Ramachandra, 2016), retrofitting buildings (Santamouris, 2016; Gouldson et al., 2016) and recycling (Ali et al., 2013; Cadez and Czerny, 2016).
The second approach that is utilised for climate change mitigation interventions is sequestrating carbon from Earth’s atmosphere. Specific measures include engineering based solutions, such as carbon-capture and storage (Szulczewski et al., 2012; King
10
and Gutberlet, 2013) and low-technology solutions such as planting trees (Bäckstrand and Lövbrand, 2006).
1.2.1.3 EThekwini greenhouse gas emissions
There are various methodologies and protocols that guide the calculation of GHG emissions. According to eThekwini Municipality (2017a), the eThekwini Municipality has adopted the ‘Global Protocol for Community-Scale Greenhouse Gas Emissions Inventory’, developed by World Resources Institute et al. (2016), to guide the compilation of the eThekwini Municipal GHG emissions inventory.
Since 2010, the eThekwini Municipality has been updating its inventory on an annual basis (eThekwini Municipality, 2017a), however records date back to as early as 2002. Figure 1.2 indicates the GHG emissions for the eThekwini Municipality as an organisation, i.e. from the local government operations in dark blue and all other emissions that occur within the eThekwini Municipal Area (EMA), in light blue (eThekwini Municipality, 2017a). When the two categories are added, the total amount of GHGs emitted from within the EMA emerges. As can be seen in Figure 1.2, total emissions during the 2010 calendar year amounted to 27,066,285 tCO2e (tons of carbon dioxide equivalent) with a marginal increase in 2011 to 27,649,400 tCO2e (eThekwini Municipality, 2017a). However, there was a substantial increase in 2012 to 29,360,395 tCO2e, with the increase primarily attributable to the improved quality of data collection (eThekwini Municipality, 2017a). There was a slight decrease in total emissions in the 2013 calendar year, from 2012, to 28,741,558 tCO2e, a slight increase in 2014 to 29,092003 tCO2e and a substantial reduction in 2015 to 27,067,912CO2e (eThekwini Municipality, 2017a).
An important point to note is that since 2011, GHG emissions from local government operations only decreased from 1,551,420 tCO2e, to 1,526,431 tCO2e in 2012 and to 1,450,928 tCO2e in 2013 but increased to 1,586,674 tCO2e in 2014, and 1,715,259 tCO2e in 2015 (eThekwini Municipality, 2017a).
11
Figure 1.2: Historic greenhouse gas emissions of the eThekwini Municipal Area Source: eThekwini Municipality (2017a, pg. 11).
During the 2014 calendar year, total per capita emissions equated to 8.26 tCO2e (eThekwini Municipality, 2016), a slight decrease from 2013 per capita emission of 8.35 tCO2e (eThekwini Municipality, 2015a); this is for all activity within the EMA.
This has decreased further to 8.08 tCO2e in 2015 (eThekwini Municipality, 2017a). It is important to note that the updating of the GHG inventory is undertaken in retrospect. As a result the 2016 eThekwini GHG inventory will start in mid-2017 and will only be completed in mid-2018.
According to Sustainable Energy Africa (2015), the per capita energy emissions (not total emissions) of various cities through the world differ substantially, these figures are indicated in Table 1.1.
12
City Per capita tCO2e
Sao Paulo 1.4
Delhi 1.5
Barcelona 4.2
Tokyo 4.9
Nelson Mandela Bay 5.3
Johannesburg 6.4
EThekwini 7.7
Cape Town 7.8
London 9.6
New York 10.5
Shanghai 11.7
Table 1.1: Energy per capita emissions of cities Source: Sustainable Energy Africa (2015, pg. 32).
As can be seen from the Table 1.1, eThekwini Municipality’s per capita emissions is only slightly lower than some cities that are a lot more developed (Sustainable Energy Africa, 2015).
1.2.1.4 Paris Agreement
After years of futile negotiations on a global climate change agreement, a major milestone was achieved with the Paris Agreement in 2015 (Dimitrov, 2016; Rajamani, 2016). According to Clémençon (2016), the Paris Agreement was reached during the Conference of the Parties (COP) 21, but COP17 hosted in eThekwini Municipality (Durban) was a key catalyst for the Paris Agreement. Clémençon (2016) goes on to highlight that some countries have made voluntary pledges towards the Paris Agreement, which the countries will be responsible for achieving.
According to the United Nations (2015), the parties to the agreement are cognisant of a number of fundamentals on which the agreement rests. These include the linkages between climate change and sustainable development, common but differentiated roles amongst the different types of countries and development of jobs within relevant national objectives. The three key elements of the Paris Agreement are: limit temperature increase to within 1.5°C pre-industrial temperature levels, enhance adaptation and resilience in a manner that protects food security, and ensure that relevant finances allow for the implementation of responses which endeavour to limit temperature increases and enhance resilience.
13
The South African national government did submit an Intended Nationally Determined Contribution (INDC) in the lead up to COP21, but the INDC was very broad and implications for cities remained vague. The INDC became referred to as Nationally Determined Contribution (NDC) after the Paris Agreement came into effect. It is important to note that the Paris Agreement was agreed upon by national governments throughout the world. The translation of this agreement for specific impacts to cities remained unknown for quite some time.
1.2.1.5 Deadline 2020
Deadline 2020, developed by C40 Cities Climate Leadership Group (C40), sought to translate commitments by national governments to the Paris Agreement into implications for cities and what responses cities need to pursue (C40, 2016).
According to C40 (2016), major findings of the Deadline 2020 research included that average per capita emissions would need to decrease to 2.9tCO2e. The latest eThekwini Municipality per capita emissions for the 2015 calendar year stands at 8.08 tCO2e (eThekwini Municipality, 2017a). A total investment of over $ 1 trillion is needed for C40 member cities to meet the stated objectives of the Paris Agreement.
In addition, one of the main aspects developed through the Deadline 2020 research are four emission trajectories that different types of C40 cities should follow. These four trajectories are a function of GDP per capita and GHGs per capita. They are:
steep decline (high GDP, high GHGs), steady decline (high GDP, low GHGs), early peak (low GDP, high GHGs) and late peak (low GDP, low GHGs). EThekwini Municipality would fall into the early peak trajectory. The research identifies a few priority areas that cities should focus on. These are: urban planning, transportation, energy, buildings and waste (C40, 2016).
1.2.2 Green economy
The United Nations Environment Programme (2010, pg. 5) defines a green economy as that which culminates in “improved human well-being and social equity, while significantly reducing environmental risks and ecological scarcities”.
In terms of the physical environmental linkage with the economy, the green economy
‘principle’ essentially advocates for the decoupling of economic output and environmental impacts, usually measured in GHG emissions – in essence making the
14
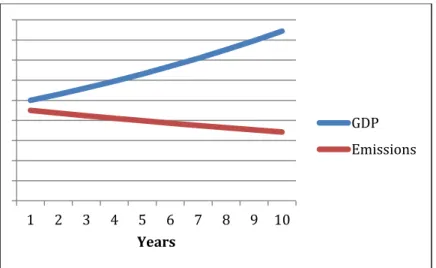
economy more efficient in its use of fossil fuels (Schandl et al., 2016; Lorek and Spangenberg, 2014). According to Green Growth Knowledge Platform (2013), the transition to a green economy is one that is complex in nature and involves a multitude of aspects. Figure 1.3 depicts what needs to be seen, with the blue line indicating continuous growth in GDP and the red line a consistent decrease in GHG emissions; or more broadly according to United Nations Environment Programme (2014, pg. 2) “The transition to a green economy can occur successfully by investing in areas that decouple economic growth from resource use and environmental impacts”.
Figure 1.3: Decoupling of gross domestic product and greenhouse gas emissions Source: Constructed by the author.
According to Burkart (2009), there are six main sectors which together form the green economy. These are: renewable energy, green buildings, sustainable transport, water management, waste management and land management (Burkart, 2009). However, it should be noted that the ‘services’ sector is notably absent. The services sector would include tourism – which for eThekwini Municipality is critical. In addition, Bailey and Caprotti (2014) identify the following domains of the green economy: financial, institutional, regulatory and green cultural economy.
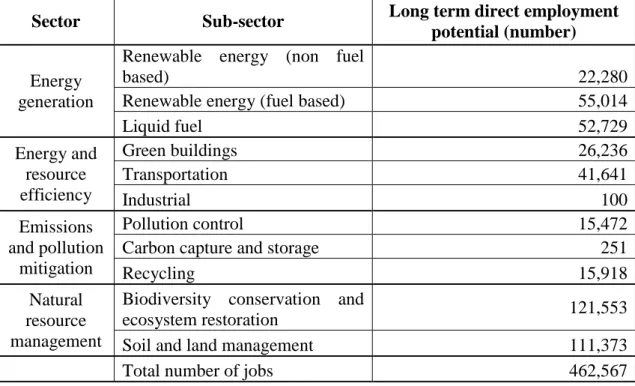
Maia et al. (2011) provide figures as to the South African national job creation potential in the green economy for various sectors and sub-sectors in the medium and long term, as can be seen in Table 1.2. There is vast growth potential for green job creation in South Africa. There was an unemployment level within the EMA of 20.2%
1 2 3 4 5 6 7 8 9 10
Years
GDP Emissions
15
in the third quarter of 2016 (Statistics South Africa, 2016). As a result, the development of the eThekwini green economy is critical for job creation.
Sector Sub-sector Long term direct employment potential (number)
Energy generation
Renewable energy (non fuel
based) 22,280
Renewable energy (fuel based) 55,014
Liquid fuel 52,729
Energy and resource efficiency
Green buildings 26,236
Transportation 41,641
Industrial 100
Emissions and pollution
mitigation
Pollution control 15,472
Carbon capture and storage 251
Recycling 15,918
Natural resource management
Biodiversity conservation and
ecosystem restoration 121,553
Soil and land management 111,373
Total number of jobs 462,567
Table 1.2: Long term employment potential for select sub-sectors Source: Maia et al. (2011, pg. 8).
Borel-Saladin and Turok (2013) cautions that the definition of a green job is not readily available and depending on the breadth of the definition utilised, it can lead to a very different appraisal on the current or potential number of green jobs. Borel- Saladin and Turok (2013) further cautions on the timeframe of green jobs, e.g.
construction related jobs are short-lived.
EThekwini Municipality (2013a) undertook a scoping study to determine the number of ‘green’ companies operating in the EMA. The study yielded a total of 359 companies (eThekwini Municipality, 2013a). Of those 359 companies, only 210 companies provided employment data of 6,107 employees. The average number of employees per company of sub-sectors are displayed in Table 1.3. There is a vast difference between national employment potential provided by Maia et al. (2011) and the actual employment figures provided by eThekwini Municipality (2013a), even if we use a crude 10% of the national potential figure, 46,256, to gauge the eThekwini job creation potential. As a result, we can see that there is still a lot more potential for the development of the eThekwini green economy.
16
Sector Sub-sector Average number of
employees
Energy
Energy efficiency products 34
Manufacturing 24
ESCO general 22
SWH supply and installation 13
Other energy related services 10
Waste management
Recycling 120
Waste management services 82
Products from waste 39
General services
Other environmental services 39
Environmental management 20
Legal services 16
Alternate technology advisors 1
Natural resources
Indigenous plant nurseries (retail) 23
Indigenous plant nurseries (bulk) 21
Bulk and landscapes 10
Landscaping (indigenous) 8
Retail/
wholesale
Specialist retail (plumbing) 14
Cleaning products 5
Retail market 5
Specialist retail (personal care) 3
Organic products 2
Property
Construction 12
Building materials 9
Professional services 5
Agriculture
Agricultural services 41
Organic retail/bulk 23
Input supplier 7
Organic farming 3
Water
Water management services 15
Water treatment equipment 10
Water treatment services 7
Water purification 3
Water conservation 1
Manufacturing Green products 3
Skills development
Solar system installation 50
Community 1
Table 1.3: Average number of employees per green company in the eThekwini Municipal Area
Source: eThekwini Municipality (2013a, pg. 10-11).
17
In order for an economy to be stimulated and the unemployment rate decreased, it is critical that a thorough understanding of an economy is first developed. A thorough understanding will come about not only by looking at aggregated information, but by understanding the interaction of the economic stakeholders, which will then point to strategic leverage points of an economy.
The green economy will be discussed in more detail in chapter two.
1.2.3 EThekwini Municipality
1.2.3.1 Overview of eThekwini Municipality
EThekwini Municipality is located within the South African province of KwaZulu- Natal, along the east coast of the country, as can be seen in Figure 1.4. The Metropolitan Municipality encompasses notable localities such as Durban and Umhlanga. Situated on the Indian Ocean, the Municipality covers an area of 2,555km2 and is home to approximately 3,700,000 people with the figure projected to increase to close to 3,900,000 by 2020 (eThekwini Municipality, 2017b).
Figure 1.4: Location of eThekwini Municipality Source: eThekwini Municipality (2017b).
18
The number of illiterate people in the Municipality has been steadily decreasing from 431,758 in 2003 to 287,138 in 2015 (eThekwini Municipality, 2017b). According to Statistics South Africa (2012), 4.2% of people have not attended school, 37.6% have completed Matric and 12.1% have attended a Higher Institution. Residents who took part in the latest Municipal Services and Living Conditions Survey raised unemployment as the most important issue of concern (eThekwini Municipality, 2017b).
Approximately 79% of eThekwini residents reside in formal dwellings, 15.6% in informal dwellings and 4.2% in traditional dwellings (Statistics South Africa, 2012).
However, eThekwini Municipality (2017b) indicates a larger percentage of the population residing in informal dwellings and a lower percentage residing in formal dwelling, with a total number of households at 945,910. As of the end of 2016, the backlog for basic services according to eThekwini Municipality (2017b) is: water – 54,721, sanitation – 153,257, electricity – 241,976, refuse – zero, with all backlogs anticipated to be eliminated within thirty years.
1.2.3.2 EThekwini economy
According to eThekwini Municipality (2017a), during the 2015 calendar year, the eThekwini GDP was calculated at R 289.3 billion. The main economic sectors included: the financial sector at 26% of GDP, the manufacturing sector at 25%, trade at 21% and transportation at 18% (eThekwini Municipality, 2017b). The latest GDP figure for the EMA is calculated at R 304.4 billion for the 2017 calendar year (eThekwini Municipality, 2018).
Unemployment during the third quarter of 2016 was calculated at 20.2%, which is substantially lower than the City of Johannesburg at 28.2% and the City of Cape Town at 23% (Statistics South Africa, 2016). The gini coefficient was 0.64 during 2014, a 0.01 change from the previous year (eThekwini Municipality, 2017b) and further decreased to 0.62 in 2017 (eThekwini Municipality, 2018). According to eThekwini Municipality (2017b), the per capita GDP for 2015 was R 61,419, substantially lower than that of Tshwane Municipality at R 83,626.
EThekwini Municipality is home to the busiest and biggest port in sub-Saharan Africa. According to eThekwini Municipality (2015b), the eThekwini port saw 87.7
19
million tons of cargo pass through it in the 2013/2014 financial year. As a result, transportation and warehousing are sizeable industries in the EMA.
Most of the electricity, 99.9%, that is consumed within the eThekwini boundary is sourced from Eskom and all liquid fuel (diesel and petrol) is imported. While there are oil refineries within the EMA, the crude oil is imported. It should be noted that the implication is that a large percentage of the eThekwini GDP will flow directly out of the eThekwini economy. According to eThekwini Municipality (2015a), a total of 11,402GWh (Gigawatt hours) of electricity was consumed within the EMA in the 2013 calendar year, 11,295GWh during 2014 (eThekwini Municipality, 2016) and 11,015GWh during 2015 (eThekwini Municipality, 2017a), a steadily decreasing trend.
The Department of Energy (2017) disclosed that a total of 1,330,700,505 litres of diesel was purchased within the EMA in the 2015 calendar year, 1,309,726,923 litres of diesel during 2014 (Department of Energy, 2016a) and 1,401,491,264 during 2013 (Department of Energy, 2015). In addition, the Department of Energy (2017) lists the sale of petrol during 2015 at 967,359,815 litres, 929,572,087 litres of petrol during 2014 (Department of Energy, 2016a) and 943,428,091 during 2013 (Department of Energy, 2015).
1.3 Problem statement
According to the United Nations Economic Commission for Africa (2012, pg. 11),
“The region should therefore have a process of using its own experts to examine the concept, and come up with recommendations that can be used in practical ways to make decisions and take action on the green economy”.
It is the position of this research that the functioning of the eThekwini green economy is not well understood in terms of its dynamic and complex nature. As a result, any initiative that is undertaken by business to capitalise on opportunities and safeguard against threats will be based on a relatively imperfect understanding of how the system works. In addition, the same basis will apply to government when it seeks to develop an enabling environment for business to benefit from the green economy and environmental justice and social equity to be promoted.
20
Nwaobi (2011) states that there is a dire need for development of the rules that govern ACE models in Africa. While not referring to ACE specifically, Frankhauser and Stern (2016) expresses the need to understand economies according to their complex nature. In addition, Chapman et al. (2016) articulates that there is a lack of understanding of cities from an evolutionary perspective, which he further adds could completely replace currently accepted knowledge.
The transitioning of an economy to a sustainable low carbon economy is critical, not just for the performance and sustainability of business, but also for the physical environment (United Nations Environment Programme, 2012; Stern, 2006). This transition to a low carbon economy will ensure that products and services from business, which are in instances exported, are not prejudiced against because of its origin from a carbon intensive area or economy (Cohen and Vandenbergh, 2012;
McAusland and Najjar, 2015). This research will assist in honing in on leverage points that can mitigate against the risk of eThekwini exports of services and goods being prejudiced, while stimulating the green economy.
In addition, according to Musvoto et al. (2015, pg. 6), “A green economy does not operate in isolation. The green economy is fundamentally about managing the interaction of humans with the biophysical environment, in a complex social ecological system. Human and biophysical factors must therefore be considered in an integrated manner, with particular attention given to the relationships between them”.
The simulation of certain systems, in this instance the eThekwini green economy, is out of reach for many people because such exercises normally require extensive computer programming experience and is often difficult to interpret. As a result, this research aimed to develop a framework that can be easily understood by practitioners and stakeholders of the eThekwini green economy and was based on ACE.
1.4 Study aim and research questions
The aim of this research was to develop a framework that would enable business and government to internalise the implications of their decisions on their objectives, the other components of the eThekwini green economy and on the eThekwini green economy at large. This aim was to be achieved by answering the following key research questions:
21
1. What are the components of the eThekwini green economy and their key characteristics that affect business growth and the reduction of GHG emissions?
2. How do the components interact with other components of the eThekwini green economy and what are the leverage points?
3. Can a framework be developed to depict and set the basis for simulating the components of the eThekwini green economy and the manner in which they interact?
1.5 Limitations of the research
Most types of research have intrinsic limitations. This research is no different. The following key limitations were identified.
During the period that this research was being undertaken there was an extremely small number of people that could be considered knowledgeable about the eThekwini green economy. Another limitation, somewhat linked to the previously mentioned limitation, is that the bulk of private sector stakeholders that, from a green economy definition perspective, operate in the eThekwini green economy are extremely focused on the provision of specific goods and services and do not realise that they are actually part of the green economy. This resulted in a severe case of unwillingness to participate in the survey by many respondents.
In addition, the organisations that make up the eThekwini green services industry were identified by previous research undertaken by the eThekwini Municipality. From the time that research was completed, and list compiled, to the time the list was utilised for respondents for this research, a large number of companies had closed or become uncontactable.
Large institutions such as banks do not have their headquarters in the EMA. This results in a lot of the expertise being located outside of KwaZulu-Natal which caused two key limitations: the first being that the banking sector stakeholders were reluctant to participate in the research and secondly the Banking Association of South African (BASA) indicated that this research’s focus was so niche that there will inherently be a small pool of people that could meaningfully contribute.
22
Some of the largest private organisations in the eThekwini sugar industry were unwilling to participate in the research, even though the South African Sugar Association (SASA) provided assistance to coordinate some interaction with industry stakeholders. The reason for the reluctance is unknown.
1.6 Assumptions of the research
Most, if not all, research is predicated on assumptions. Some assumptions are to make the research tractable. The key assumptions of this research were kept to a minimum.
The eThekwini green economy is still in its infancy and offers substantial opportunities for job creation and economic development. A thorough understanding of the eThekwini green economy, by stakeholders, does not exist due to the eThekwini green economy not being scrutinised through a theoretical framework that can better process the dynamic and complex nature of the eThekwini green economy.
1.7 Significance of the research
The theoretical contribution of this research will be input into developing the basis on which ‘rules’ can be developed for an ACE model, through a mixed method research design, for an African city’s green economy. This is in response to Nwaobi (2011), who advocates ACE for African economies, but also states that a critical aspect is to determine what rules to create for the components of the system. In addition, according to Musyoki (2012, pg. 13) “The paper shows that for the green economy to succeed, there is a need for regionally specific research…”.
The practical contribution of this research was the understanding of how the eThekwini green economy operates. This then allowed the leverage points of the green economy to be identified. In addition, a framework was developed that allows the key green economy stakeholders to identify the effects of their actions on other stakeholders and on the economy as a whole. This will contribute to more informed decisions being made. A framework is being opted for, instead of a simulation tool, as it is assumed that a simulation tool will not be utilised as widely due to the barriers of use, such as computing skills.
1.8 Overview of chapters
This research saw the convergence of three very different, but related, thematic areas.
These are: climate change, green economy and ACE. To keep the readability of this
23
research as easy as possible, the standard thesis, at doctoral level, format is adopted with modifications to accommodate the emergent complexity of combining the various thematic areas mentioned above.
Chapter one provided an introduction to climate change and some of its challenges and opportunities. Climate change mitigation measures were briefly discussed and the eThekwini GHG emissions were detailed. The Paris Agreement and Deadline 2020 were then presented. The concept of a green economy was introduced and covered job creation potential. An overview of eThekwini Municipality was provided, which included the eThekwini economy. Thereafter, the problem statement, key research questions, limitations, assumptions and significance of the research were presented.
Chapters two and three focus on the literature aspects of the research. Chapter two will first provide a definition of economics. Thereafter, the green economy will be defined and discussed according to the ways in which it can be framed. Sectors that make up the green economy will then be presented. International and local level indicators will be discussed, followed by the Sustainable Development Goals (SDGs).
South African national, provincial and local key green economy enabling laws and documents will be discussed, followed by business and climate change risks. Chapter three will include a discussion on various potential theoretical frameworks that could underpin this research, which will then be analysed for suitability. A detailed discussion of the most appropriate theoretical framework, ACE, will conclude chapter three.
Chapter four includes a discussion on the research methodology that guided this research. This will be followed by the findings from primary data collection, which will be contained in chapter five. The analysis of collected data and preparation of findings for input into the development of the framework and the actual framework is undertaken in chapter six. All elements of the thesis are rounded up and concluded in chapter seven.
1.9 Conclusion
Climate change is one of the largest challenges currently facing mankind and the planet, largely caused by mankind’s own actions. While climate change poses serious risks that can jeopardise life as we know it, it also presents some opportunities.
24
The green economy is one of these opportunities. It offers a way to balance economic growth, protection of the environment and stimulate social development. However, the eThekwini green economy is not, currently, well understood.
A thorough understanding of the green economy has to first emerge, before it is stimulated, to achieve maximum benefit. This research sought to discover some of the complex and dynamic ways in which the eThekwini green economy can and should function.
The next two chapters of this thesis provides a discussion of the key literature on which the research is founded on.