University
of Cape
Town
1
The copyright of this thesis vests in the author. No quotation from it or information derived from it is to be published without full acknowledgement of the source.
The thesis is to be used for private study or non- commercial research purposes only.
Published by the University of Cape Town (UCT) in terms of the non-exclusive license granted to UCT by the author.
University
of Cape
Town
University
of Cape
Town
I am truly'
I would 1.
2.
3.
4.
5.
6.
All persons from
was done
to them for
Johannesburg Mr
the of
2
University of
University of
Durban, for this study.
of assistance
University
of Cape
Town
A on 10 6 10
in children Cape
A total of 2 fatalities were were death cases and 1 were cases.
causes motor vehicle
to leading cause of Black population. causes
to mjuries, causes of peculiar to individual
number of due to train a L ' A U ' \ A
trauma J .ondon, abandonment in trauma in
medical pf()cem were
pedestrian, drowning, burn and revealed gender, seasonal,
University
of Cape
Town
AIM
·... 2 ... 3
1 : 2:
3:
4:
5:
MVA
... ... r-::>
6 ... 8
on ... 9
of unnatural deaths ... . City
39
64
81 Unnatural
95
6: ... .
CONCLUSION ... " ... .
98
101 104 110 121 122
1 : 2:
3:
4:
5:
6:
7:
. . .. . .. . ... .. . .. . .. ... . .. . .. . .. . .. . ... . 1 132 142 London ... 1
1 1 8 : companson ... 1
Form 10 : letter sen t to Mortuary
4
University
of Cape
Town
is based on that by National
to the' death.
by another or manner
personnel
word
death,
apparent manner
In not in
University
of Cape
Town
I.
II.
III.
IV.
V.
VI.
All To
the manner and causes of unnatural
most common causes
age 10 most common causes
most common causes of
to an
rates.
10 to
System) database in
The population consists 10 below 14 years.
to 2 cases 10
SiX cities were telephone
of
the
cases were
constraints.
a
were sent to of Medico-legal Laboratones in
to
as to or not In some cases, acknowledged in
not only
would be evaluated of
not
fGmberley were not' 10
14 years the city LUet . . . ,-;), was mortuaries or in to
6
10
to
was
University
of Cape
Town
the a A
to supply
of omission or
IS
from mortuaries in
an act a local or
"",,,,,,,,,... are from a solely natural disease Natural death cases do not warrant a
no obtained,
never consulted a medical to be brought to the state mortuary
a a natural deaths was not In
to n 1",1'''''1'"\
seasonal, ethnic
after review of circums tances circumstances of
performed. In this the causes
was nn,r,~,,,,
the most common
In each
to
rates ..
rates the size 10
was
May;
November.
outlying towns were eliminated from
population were as follows:
1. 0 to 1
II. 1 to 4
111. 5 to 9
IV. 10 to 13
were into seasons, as
to
were
March,
University
of Cape
Town
IS
America 13_
innate
homicide is
incidence
cause
to
are imposed on
only certain
102
1
In
opinIOn, the most
United States of environment
means
Africa,
to by the
injury and death throughout
accurate. It should that childhood injury, as are
mortality, are not account 15_
8
University
of Cape
Town
90%
motor
to be have Sweden.
most
of
19
I.e.
42 In
2
on hpr.,lP,'n 1981-1
occur in children
controlled successfully, .
(MVA's), kill over yearly 38. According to the annual
child mortality to four times higher and
of
sixteen countries had child mortality rate In
. child mortality rate more rapidly in
and pedestrian accoun ted for majority of deaths 1-4
Suffocation was found to
for England and in children and youth (0-
rn"t"I('-;! was found to have a to homicide in this
to
related mortality in the 40
compartsons can these countries.
are 1 0 f
than 6% In Australia and 27% in the
motor vehicle and
death rate. It the rate that
University
of Cape
Town
the motor rate.
rate England and was thought to be to
common 42
preventable deaths 43
numerous
"it IS a
In
and at
were
accidents drowning,
(c) 7%
causes (5%), tumors to consist
to this PtT1PrCH
falls, are not
15
41 n.ccor A d' 109 to
social factors, ,
, Accord 99, which involves conscience and economic rights are
a
causes .A
thought to
10
mortality rate in
13 It should be
IS 10
of injuries seen
in
have a higher
is not
and
,orn1"pn 1981 followed by
were more at risk for Coloured,
were more at boys were to be
of mjury, i.e. than 1 year and burns in children
was the
of fire services. 10 was
University
of Cape
Town
1-4 year
10
occurred in or near tbeir
A that (54<10),
found in significant
rivers.
Town over a 15
10
is in contrast to population.
variation for
10 cases It is important to distinguish
ttprpr,"t 81. The
but is used'
83
1-4 to have
trauma rate in
to
10 I.e.
rVlj-j-pf'n of drowning seen in Australia.
Black
population, 62% to drowning 10
to
were 10
period, i.e. 1
fatalities, followed by
10
of
was 4 years were most at
was no
was no ethnic and
trauma
trauma profile as
16,82
in trauma rates trauma rate.
9
15 The World
as
trauma in vanous
are
reason for the
was 2 tol, in contrast was 3 tol).
0-14
of as pedestrians (46.7%), while
contrast it was 10 1 only were as
University
of Cape
Town
39% were injured as to non
years sustained injury predominantly by falls
for 1 was
obscure trauma in children 5
of trauma IS 84
trauma was
to account for it
is not a random event; it results
85. He states of
trauma cannot In can
adequately be L~""~"_""U also states that primary IS the amongst children. It at a IS more ;D"""""'-"
87
vehicle dlA,1U'Cl are a major cause of morbidity and mortality in childhood.
per 100 000
1-15 (50%) in their series 29.
In rate was
an decreased 24.
volume had
In
reason for the
with an increase in car
A children
Studies
in the Perth area on childhood were most at
19:00 25.
A In
Into the causes death in
the
was thought to to to traffic as child pedestrian
37 reason that travelling
occurred
a of
child so to trauma at
12
University
of Cape
Town
different sites. The thorax of a child is compliant and its mediastinum is mobile. This means that after trauma is sustained, there may be significant damage to organ parenchyma.
Lower limb injuries are also commonly associated with child pedestrian accidents.
Byard et aI, in their study on pathological features of child pedestrian fatalities, found no age-related differences in injury pattern, so reflecting massive trauma sustained in these cases. The proportion of children injured by a moving vehicle in a home driveway in the study was found to be 6%. In some studies it was found to be 10%. A crushed head was the dominant feature seen in these cases - "slow speed injury" 27. Also seen in their study, was that the injuries children sustained as pedestrians tended to be massive, such that death occurred soon after the event. In some cases, the injuries were deemed so severe - in fact comparable to those seen in industrial accidents. Injuries sustained in industrial accidents are characterized by evisceration, crush injury and limb amputation 30.
A positive correlation was found to be between injury severity, impact speed, and the distances the child was thrown from the vehicle or carried by the vehicle 31.
A study undertaken to determine factors affecting prognosis in seriously head injured children, in Cape Town, demonstrated that in 83% of cases, it was due to pedestrian road traffic accidents. 11% were due to falls, and in 6% it was due to passenger motor vehicle accidents, bicycle accidents, and assaults 23. The image below depicts severe head injury caused by MVA's.
DR 531/02
!
DR. V/O HEYD
The aetiology of the head injury was found to be the most important prognostic factor, i.e.
acceleration/ deceleration/ rotational injury resulting in diffuse brain injury had a poorer prognosis than low linear acceleration, resulting in localized brain injury. In developed
13
University
of Cape
Town
in
during 1981 to to
there
incidence of
26, are other factors contribute to childhood
a
28
np,-.-n,p study done by I<nobcl 16 nor
to motor is in contrast to
caused 10.2% fatalities in 48,9%
in winter (April to significant monthly
over
road.
cars
driving was also motor demonstrated that'
20:00.
was a lower however, there was no
most
on the
study.
restrain t of children in
were also found to effects in
water.
be
86
as to submersion, or
IS
submersion, in a on numerous tract obstruction
occur in numerous I.e.
u, .... ,"-'o", or homicidal
as an occur in as
of drowning
a In cases
it should be
14
reason as 5 or 6cm
as
or not
as well as in
are no set
are in to
University
of Cape
Town
it. a water in an state
decomposition, it will multiply
means of diagnosing as it is
IJV",,"U'" to
90% In
the lung
11
most common cause drowning. In
on of
pools, rivers, ditches, seas, 12
This study
In were at
in toddlers who fell in to
(c) In fell into a of
are vulnerable to as movements are not
have cannot swim, are also
as
are to the event.
A
to autonomic
of Other natural
arteriovenous
- h ' 18
of t e coronary artenes .
HLlau,,''-'' In
pool. In
of cases, the In cases
where fatalities had
pool was
around pools the installation and maintenance a secure 97
University
of Cape
Town
A study In hpf'nTPf>n 1980 to 1 of
the summer and
to
the peninsula coastline - the Atlantic coastline 19
A on childhood a
sea was rare. were most at
near-drowning. This was in Accidental
In """rn,'YI In
for 18% of cases; was
the
bucket IS
",nt·,,,,,.,, communities 20.
outcome in flaccidity,
ventilation are also known to
hours. to diminished
that near-drowning, 5% develop
did, 21,22
It is water a recover
completely. water
In
waters in J ndian oceans pool +p~nnp ... "d-,
who were hypothermic a
outcome. was
at above is not dependent on
duration of it is known that
over a
to mOIst hot steam IS
16
University
of Cape
Town
known as scalding. There are short-comings in the classification of burns 44. Burns are often described in terms of the agents that have caused it, i.e. thermal, electrical or
chemical, rather than the pathology associated with the burns. According to lecture notes on Forensic Medicine 45, burns are classified as that caused by chemicals, electrically charged conductive, electromagnetic or particular rays, hot substances, dry or wet, solid, liquid or gas.
Scalding commonly occurs in the domestic environment. Children and the elderly are especially at risk. Scalding does not produce charring of the skin nor singeing of the hair, as does the application of dry heat to the skin. Charring may occur if the scald resulted from very hot oil. The scald resembles a 1st degree dry burn 46. Reddening, blistering and sloughing of the skin is present. However, compared to a dry burn, the shape of the scald wound is different. The scald has a sharply demarcated edge, corresponding to the range of contact of the liquid. The edge of the scald may be irregular, if splashing did occur.
Another distinguishing feature of a scald is the trickle pattern which may be seen when a hot liquid moves over the body under gravity. Death from scalding, when it is extensive, is due to shock and electrolyte disturbances. Septicaemia may also often occur in this setting.
The picture below depicts a scald.
Dry burns may be caused by high temperature applied to the body by conduction or radiation46• The appearances of dry burns are variable and are dependent on the severity of the burn. When the burn is less severe, there may be erythema, redness, swelling and blister formation.
17
University
of Cape
Town
With increased severity, there may be destruction of thickness of the skin, giving rise to a yellow Ibrown, leathery appearance. In the very severe setting, hair may be singed and charring (as seen in image below) may be present.
In developing countries, fire burns are the most common cause of burn injury, as opposed
to the developed countries, where scalds and contact burns are the two most common burn injury types. Coffee and tea are said to be the most frequent causative agents involved 47.
A study conducted in Denmark demonstrated that two-thirds of children who sustained scalds were under 2 years of age. Most of these injuries occurred in the dining, or living room (66%), whereas only 28% occurred in the kitchen. In this study, coffee was demonstrated to be the causative agent involved in 85% of the cases. Hot water burns amounted only to 11% 48. Another study done in Denmark showed that most incidents of burn injuries occurred in children under 2 years of age. However, in contrast to the aforementioned study, contact burns were found to be the most common burn type.
Scalds were found to be second to contact burns. In this study, burns were found to occur most often in the kitchen while cooking was taking place. Two cases of electrical burns were recorded. However, there was no record of fire burns in these children. They also found that the number of burn cases was highest in the winter, compared to the summer months. This was thought to be due to there being less indoor activity in summer, as opposed to winter. The incidence of burns in the 0 to 2 year age group was double that in the 3-6 year age group, and four times that in the 7-15 year age group. The study
demonstrated that in 37% of the cases, kitchen appliances and utensils were the causative agents involved. In this study, the girl to boy ratio was found to be 1 to 1.649•
18
University
of Cape
Town
this study scalds accounted for were severe.
80%
study
water
burns in childhood, that
In that
were
tap
than study done to n p j - p r , Y I on
(a) (b)
1970 to 2.4
According to an as
were
a rate In
In with
throughout the
to be varied from country to country. states further that'
tap water like
In
of to within 2 it will occur even In New u,-a.'Q,U over a 10 children
In ,-,\.-au .• "
or
In the case of tap water
as i.e. 5
involved in the' hot tap water,
in full-thickness
that wounds in adults
51
1 1987 on In
of childhood burn ' to
study also showed that of burn injury 50%
study highlights are
cigarettes to the I.e.
whkhdon~ 00
about when are 53
University
of Cape
Town
In
torso.98,107,I08
1990
so as to study
areas rr.1TltY:lt·P(1
of awareness as
one most
55
causes to
in winter
sources. It is
the
was not
was
were to
University
of Cape
Town
to must on -
(b) or not are
(c) socio-economic in a country
installation of smoke in low-cost to
resistant clothing was introduced,
from 7.9% of total
the risk of scalding 57.
on
teapots contents.
Mention was in 1
from
was to '
found to an
58
malO causes for
of the school and
.0 . . . . " " " . , , that education
a 10
so as not to rapidly on
was unable to the injury or
sleepwear for toddlers). The most effective "" .. ',,,"','"',
in education
60
who have burnt are at risk for emotional problems most at
to to IS
theIr
59
implemented
rates
VIew,
was
IS
mjury to the
University
of Cape
Town
body at an early
In a study in a state
suicidal
between 6
made of
of
In
cases
61
be
It is results in
to cause major morbidity 10
are treatment numerous problems to
mortality mJury
10 0-19
it was eXI:::e(~ae:a 10 causmg severe
cause
were found to occur in the 1 age
most common was
was found to be most prevalent in
10
urban population, area, was at
was to be 13 was no racial difference in
during 1
injury was sustained
from firearm
study done in Los
domestic conflict 5.
home
a was at hand 6.
22
study
being14.9 to 1 to
in children under
lOa violence. Mention was
was
was
to In
was likely to
University
of Cape
Town
At
was
(28%) 1.
mortality
is In an
were no accurate
accidental means or IS
a
children seen at hospitals in to the
most common
in
with 11% of
cases could the circumstances of the as innocent
were The
as to the proportion
record keeping by police and
most frequently sustained
life-long disability i.e.
Inlury was a 10%
were child
were in contrast to
study, abdominal most common, warranting
sectional area 5.
However
by
can
(b)
In
firearm injury was in
most common
has, in the rate is still
was
32 In
that -
are stored in homes
America, however, it was
34
lower
IS
America,
(17%) 6.4
In an cross-
of America, are homicidal
were found to
3.>
of
University
of Cape
Town
to a
found in
the indicate
account
even
in most
showed
by e a t 1 100 , 10 16
fatalities in the however, was to awareness as to firearm control and may
Hospital's Poisons two leading causes
to remain constant in
most common
36
88
89 It is most common cause accidental poisoning 10
to
within the community 90, strategy was by
containers for United Kingdom
60% 91.
to poisoning in of
care. An 84% decline was chemical
to occur in most
common substances' A study which evaluated
behaviour. All
not n
24
10
University
of Cape
Town
A In PT\lJPP'n 1 on
non-accidental head injury, that in 53% of cases, the was
used as a shield
of assault was mean age of who
were as to shield' In
was commonly seen in that certain '
up.
In IS by In 4
cases, child
as an or a An
that IS not fatal, probably as intention was or
slight. are not intent be a cry
there IS not absolute 62
15 IS
of to were In
(78.7%). Only
one 10 A
(1 Maori
The was to to the
rest mortality rate in 1 4
In Taero K& A et al, it was high buildings were the most common 64
In Increase was In rate 15 to 19
includ;::d poisoning as
10 1
to so into the 1 An
, ,
rate males 15 19 years was found in study
lflcrease lfl
University
of Cape
Town
This was to stresses in No
was " n T P y , p r found 65.
In Turkey, 19
is in contrast to
modes of were were found to
occur at to
~"r'nplr~ 66
In a
'-" .... '-,,'-'-. i.e. children than 15 years late adolescents (1 it was
one (43%).
one (35%).
In
cause of which remains
68
to Klonoff- et aI,
months In
1 month to 1
autopsy typical
more often in
to the
as the sudden
accounts for 50%
it was
ueT, it was
events were also less one . 67
an
In
or
2 most common cause
Sudden Infant Syndrome is to body. IS no
blood-stained froth may mouth and nose.
post-mortem by death 70.
be performed in cases of a as
it 71
A causes In
that in 80% of cases, was due to
was found to be by cardiovascular
causes 26
University
of Cape
Town
causes a
to be done by pathologist with
metabolic and t1r.~rr)p" which 10
were not
was found to proportionally higher a It was also
on 10
72
In to to 1 in 1
1000 awareness as to
for was
who 10 non-prone
of
care. It was
a position, and
73
shown to increase risk It is
more to
10
which could . 10 apnoea 10 , to be an mcrease in the
of of
10
of mast cells mechanism in 76
I, d 77 was app 1e .
Death Syndrome. demonstrated in
et al crr"rp,t1 an
rate IS maintained until 3 IT'Ir,nY-n 78 They also demonstrated that a rise in
79 would
10crease over-
positioning of 10fants are' risk factors
80
mattress on whICh an '
a In were
University
of Cape
Town
to
94
The causes of numerous. Perrot some
definition,
, be 95
They can more occur on a water
is 93
arcuate nucleus oblongata, it is hypothesized of 94. It is also in neonates is
remam are
means. They not be
unexpected of a healthy· in whom "a
a
circumstances to a manner
University
of Cape
Town
Chapter 3
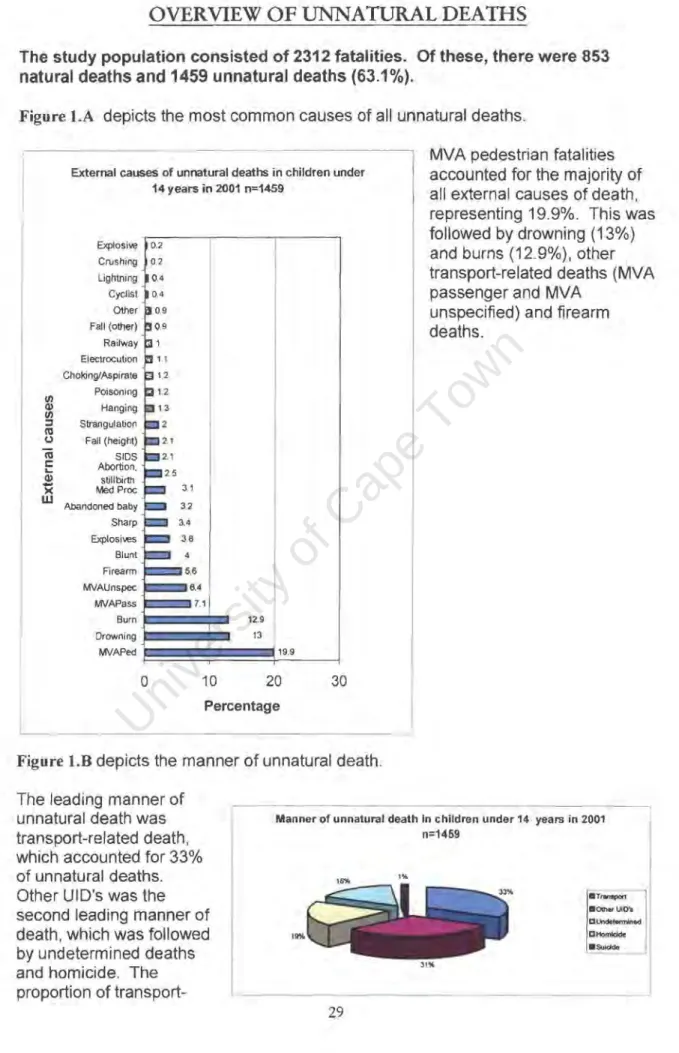
OVERVIEW OF UNNATURAL DEATHS
The study population consisted of 2312 fatalities. Of these, there were 853 natural deaths and 1459 unnatural deaths (63.1%).
Figure 1.A depicts the most common causes of all unnatural deaths.
VI Q) VI ::::J CIS Co.)
iii
...
c:Q)
)(
W
External causes of unnatural deaths in children under 14 years in 2001 n=1459
Explosive Crushing Lightning Cyclist Other Fall (other) Railway Electrocution Choking/Aspirate Poisoning Hanging Strangulation Fall (height) SIDS Abortion . stillbirth Med Proc Abandoned baby Sharp Explosives Blunt Firearm MVAUnspec MVAPass Bum Drowning MVAPed
0.2 0.2
o
6.4 7.1
12.9 13
19.9
10 20
Percentage
30
Figure 1.B depicts the manner of unnatural death.
MVA pedestrian fatalities accounted for the majority of all external causes of death, representing 19.9%. This was followed by drowning (13%) and burns (12.9%), other transport-related deaths (MVA passenger and MVA
unspecified) and firearm deaths.
The leading manner of unnatural death was transport-related death, which accounted for 33%
of unnatural deaths.
Manner of unnatural death In children under 14 years in 2001 n=1469
Other UIO's was the second leading manner of death, which was followed by undetermined deaths and homicide. The proportion of transport-
29
3'%
.Trampon
.00-
UlO's[1'-"<10""""'"
[ 1 - .Su;clde
University
of Cape
Town
exceeded the other UID's proportion. Likewise, the undetermined deaths proportion did not significantly exceed that of homicide. Suicide represented only a small proportion of all unnatural deaths.
1. External causes of death by manner:
1.1. Transport-related deaths [Figure I.e]
The external cause of death was recorded in all cases of death by this manner.
Transport related deaths n= 473
300 ~---~
MVA pedestrian fatalities accounted for the majority of the total number of deaths in this category (57.1 %). This was followed by MVA passenger deaths which represented, 20.5%, MVA unspecified deaths (18.4%), railway deaths (3%) and cyclist deaths (1.1 %) - see Annexure 1, Table 1.
250
III
~ GI 200
""C
-0
...
150.c GI
E 100
:::J Z
50
o
Ped Pass MIlA
Unspec
5 Railway Cyclist
ExtemalCauses of death
1.2.0ther UID's [Figure I.D]
Of the total number of 452 deaths by this manner, in only 448 cases (99.1 %), was the external cause of death recorded.
Drowning accounted for the majority of deaths by this manner, followed by burns and poisoning (ingestion).
Together these represented nearly three-quarters (74.1 %) of all deaths in this category.
Other external causes of death for which high numbers were recorded included falls from a height, electrocution and choking - see Annexure
1, Table 2.
.t:.
-
ca CD"C
-
0 tJl CDtJl j
ca ()
ca c:::
'-CD
-
><W
Crushing Hanging Sharp Firearm Ughlning Med.Proc Blunt Falls(other Strangulation Pais.gas Choking/Asp Electrocution Falls(height) Poi.lng Burns DrONning
Other UID's n=448
2 2 2
._
2234
0 50 100
142 156
150 Number of deaths
200
University
of Cape
Town
1.3. Undetermined deaths [Figure I.E]
Of the total number of 279 undetermined deaths, in only 194 cases was the external cause of death recorded (69.5%).
or.
-
I'll Q)-
'tJ 0 en Q) en::J I'll
u I'll
s:::
...
Q)-
><LU
Undetermined deaths n=194
Crushing Sharp Firearm Choking/Asp Hanging Pois.gas Falls(other) Blunt Stangulation FaU(height) Other Pois.lng Drowning SIOS Bums Abortion/Stillbirth Med Proc
1
11 13
~~_"'_"31
.,,_"'_"' 34
0 10 20 30 40
Number of deaths
1.4. Homicide [Figure I.F]
Medical procedures,
abortion/stillbirth, burns and SIOS, together represented 67% of all deaths in this category - see Annexure 1, Table 3.
Of the total number of 235 homicidal deaths, in only 232 cases was the external cause of death recorded (98.75).
With reference to Annexure 1, Table 5(a), firearm homicides accounted for nearly one-third (29%) of all causes of
homicidal deaths. Sharp object homicide and homicidal abandonment of babies each represented 19%, whilst blunt object homicide represented 17% - see Annexure 1, Table 4
Homicidal deaths n=232
Other Mva Ped Fall(height)
£i m Pois.lng
'1J
'0 Pois.Gas
1/1 ~ Burns
::J
~ Orov.ming
~ Strangulation
~ Blunt
w Abandoned Sharp Fireann
~ 1
;12 12 113
. 4
. 4
_ 6 14
41 44 44
a
20 40Number of deaths
67
60 80
University
of Cape
Town
4. Sex variation in manner of unnatural deaths [Figure 1.1]
.c CI)
-
C1I G)"C
....
0
..
G) Jl
E ::J Z
Sex variation in manner of unnatural deaths n=1427
Undetermined
Transport
Other UID's
Suicide
Homicide
1nn ?nn ~nn 41
Homicide Suicide Other UID's Transport Undelennin ed
I _Female
77 4 I 160 196 115'_Male
149 16 289 275 146Manner of death
I ·Ferna~
• MaleI
o
In all manners of death, male deaths outnumbered female deaths. Transport- related deaths accounted for the highest proportion of female deaths
(35.5%), whereas amongst the males, other UID's
accounted for the highest proportion (33%). Among males, transport related and other UID's combined accounted for nearly two thirds of their deaths. These manners of death represented 31 .4%
and 33%
respectively.
Homicide represented 17%, undetermined deaths 16.7% and suicide 1.8%. Among females, transport and other UID's represented 35.5% and 29%, whilst undetermined deaths represented 20.8% and homicide, 13.9%. Suicide among females
represented only 0.7% of deaths.
5. Seasonal variation in unnatural deaths [Figure 1.J]
Of the 1459 fatalities, in only 1444 cases was the month of death recorded (99%).
Most unnatural deaths occurred in the Spring, Summer and Winter. The number of deaths recorded in these seasons did not differ significantly. The least occurred in the Autumn - see Annexure 1, Table 7.
I/)
~
-
n:J QI"C
....
0 '-QI Sl E
::::I
z
380 375 370 365 360 355 350 345 340 335 330 325
33
Seasonal variation in unnatural deaths n=1444
Summer Autumn Winter
Season
Spring
University
of Cape
Town
6. Seasonal variation in manner of unnatural deaths [Figure l.K]
Seasonal variation in the manner unnatural deaths n=1444
140
120
- '"
-1/1 100 • Homicide
.c - - I--
- "
CD . Suicide"'C 80 - - - Cather UIO's
-
0...
CD 60 - r-- CTransport.0 E • Undetermined
:J 40 I-
Z
20 I-
0
.. •
Summer Autumn Winter Spring
Homicide 54 46 76 55
Suicide 5 4 5 6
Other UID's 118 104 96 131
Transport 130 119 116 107
Undetermined 60 69 69 74
Season
variation.
7. Variation in unnatural deaths by population group [Figure l.L]
Transport -rei ated deaths accounted for the majority of deaths in all seasons, except for Spring where it was exceeded marginally by other UID's.
There was no significant seasonal
variation noted in deaths by these manners .
Homicidal deaths peaked in Winter, whereas deaths due to suicide and
undetermined deaths showed no Significant seasonal
Of the 1459 fatalities, in only 1424 cases was the population group recorded (97.6%).
The highest number of unnatural deaths occurred in the Black population group (78.2%) and the next highest in the Coloured population group (13.4%), the White population group (6.4%), and Asian population group (2%) - see Annexure 1, Table 8.
.c I/)
....
CIS CI)
"C
-
0 '-CI)..Q
E ::J
:z 1200 1000 800 600 400 200 0
Variation in unnatural deaths by population group n= 1424
28
Asian Black Coloured White Population group
University
of Cape
Town
8. Variation in manner of unnatural death by population group [Figure 1.M]
Manner of unnatural death by population group n=1424
400 350
J: tn 300
-
co 4) .Homicide"C 250
.Suicide
....
0 200
o
Other U I D's'-4)
150 OTransport
.c
E
• Undetermined:::l 100
Z
50 0
.. IIL I .-lll.
Asian Black Coloured White
Homicide 6 174 34 8
Suicide 3 12 4 1
Other UIO's 7 372 36 36
Transport 9 368 66 29
Undetermined 3 188 51 17
Population group
The highest number of deaths by all manner,
occurred in the Black
population.
The Coloured population had the second highest number of deaths by all manner,
followed by the White and Asian population groups.
Among the Asian population, transport- related deaths accounted for 32.1 % of the total number of their deaths. A quarter, 25%, was due to other UIO's. Homicide represented 21.4%, whilst suicide and undetermined deaths each represented 10.7%.
Amongst the Black population, other UIO's and transport related deaths represented the highest proportion of their deaths i.e.33.4% and 33.0% respectively. This was followed by undetermined deaths (16.9%), and homicide (15.6%). A small proportion was due to suicide (1.1 %).
In the Coloured population, 34.6% of their deaths were transport-related, and 26.7%
were undetermined deaths. This is in contrast to that seen in the Black population, where only 16.9% of their deaths were undetermined. Deaths due to other UIO's and homicide represented 18.8% and 17.8% respectively. This is again in contrast to the proportions in the Black population.
In the White population, deaths due to other UID's represented 39.6% and transport related deaths, 31.9%, Homicide represented 8.8% and suicide, 1.1 %.
35
University
of Cape
Town
9. Age variation in unnatural deaths [Figure l.N]
In all 1459 cases, the age and the manner of death were recorded.
Age variation in unnatural deaths n=1459
The highest number of unnatural deaths occurred in the 1-4 year age group and the next highest in the 5-9 year age group and the less than 1 year age group. The least occurred in children 10- 13 years of age - see
Annexure 1, Table 9.
1/1 J::
- "'
IV"0
-
0...
IV..c E
z J
500 450 400 350 300 250 200 150 100 50
a
< 1 year
10. Age variation in manner of unnatural deaths 10.1. Homicide [Figure 1.0]
Age variation in homicidal deaths n=235
120 ,---.-,,....-- - - -- -- - - - ,
III
::: 100
"'
~ 80
'0
...
60~ 40
5
20Z 0
< 1 year 1-4 years 5-9 years 1(}'13 years Age
1-4 years 5-9 years 1 0-13 yea rs Age
Most homicidal deaths
occurred in the less than one year of age; its number decreased in the consecutive older age groups. There was nearly a 50% reduction in the number of homicidal deaths in the 1-4 year age group
compared to the former. Within homicide, deaths in the less than one year age group represented 44.3%, whilst that in the 1-4 year age group represented 24.2%. There was no significant difference in the number of homicidal deaths recorded in the 5-9 and 10-13 year age groups. These represented 16.6%
and 15% of homicidal deaths.
10.2. Suicide (n=20)
All suicides occurred in the 10-13 year age group.
University
of Cape
Town
10.3. Other UID's [Figure l.P]
The highest number of other UIO's occurred in the 1-4 year age group (52%), and the next highest in the 5-9 and 1 0-13 year age group (25%
and 12% respectively). The least number occurred in the less than 1 year age group (11.1 %), however, the number of deaths in this group did not differ
significantly from that in the 10-13 year age group.
Age variation in Other UIO's n=452
I/) 250 ,---~----==--~---,
..c.
1U 200 + - - - - -
OJ
"C 150 +--_ _ _ _
....
o; 100 + - - - -
.0
E 50
::::J
2 0
< 1 year 1-4 years 5-9 years 10-13 years Age
10.4. Transport-related deaths [Figure l.Q]
In all deaths by this manner the age was recorded.
Age variation in Transport related deaths n=473
250
I/)
;; 200 ns
196
"C OJ
....
1500 115
-
126L. 100
OJ -
I - - .0 E 50
::::J
2 0
36 I
I - -
n
< 1 year 1-4 years 5-9 years 10-13 years Age
1 0.5.Undetermined deaths [Figure l.R]
Most transport-related deaths occurred in the 5-9 year age group (41.4%). The next highest occurred in the 10-13 year age group (26.6%), and the 1-4 year age group (24.3%). The proportions represented by these groups did not differ significantly. The less than one year age group represented 11. 1 % of
transport-related deaths.
The highest number of these deaths undetermined
occurred in the less than 1 year age group (51.3%), whilst the next highest occurred in the 1-4 years (13.6%), and the 5-9 year age group (13.6%). The least occurred in the 10-13 year age group (10.4%).
Age variation in undetermined deaths n=279
en 160
..c: 140
-
ns OJ 120 r-- 14J"C 100
-
0...
OJ 80 60 r--r-- 69,Q 40
E ::J 20 z 0
r-- .---
r--
I
38 :ll:I
r
1-n-
H
I I< 1 year 1-4 years 5-9 years 10-13 years Age
37
University
of Cape
Town
11. Scene variation in unnatural deaths [Figure 1.S]
Of the 1459 fatalities, in only 1227 cases was the scene of death recorded.
(II c:
ell u
CI)
Scene of death N = 1227
In custody 3 8arShebeen 6 School 9 Fann 10 Countryside
Retail Amusement Industrial
area Res. Institute Country road Other Open land Infonnal Med.service
Sea,river,dam 82 House
_ _ _ _ _ 38
Urban road 487
0 200 400 600
Number of deaths
38
The majority of unnatural deaths occurred on urban roads (39.7%), country roads representing only 1.9%. This is in keeping with MVA pedestrian fatalities which
outnumbered all external causes of death. The next highest number of unnatural deaths occurred in a house (29.2%), a body of water, i.e.
sea, rivers, dams (6.7%) and medical service areas (5.2%) - see Annexure 1, Table 10.
University
of Cape
Town
Chapter 4
UNNATURAL DEATH PROFILES
CAPE TOWN
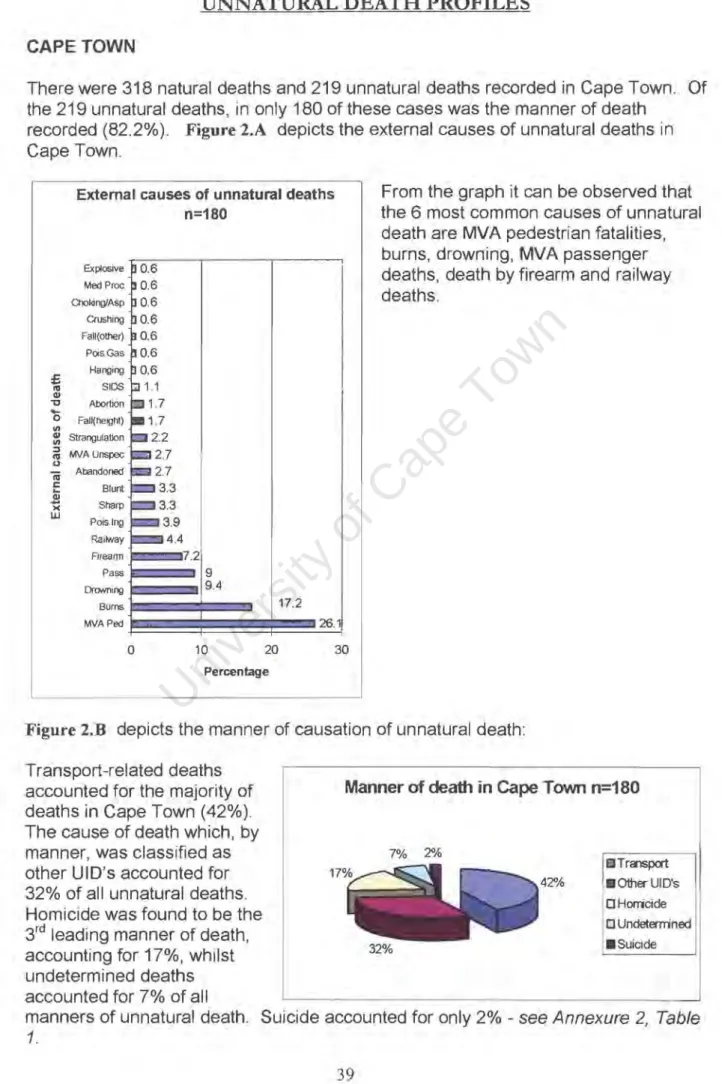
There were 318 natural deaths and 219 unnatural deaths recorded in Cape Town. Of the 219 unnatural deaths, in only 180 of these cases was the manner of death
recorded (82.2%). Figure 2.A depicts the external causes of unnatural deaths in Cape Town.
:S C'II GI
"'C
-
External causes of unnatural deaths n=180
Explosive Med Proc Choking/Asp Crushing Fall(other) Pois.Gas Hanging SIDS Abortion
o Fall(height)
'"
GI Strangulation
'"
::::I
MVA Unspec C'II
~
Cii Abandoned
c Blunt
...
GI.... Sharp
)(
W Pois.lng
Railway Firearm Pass DrONTling Bums
_ _ 4.4 7.2
~_. 9
1-_ _
9.417.2
From the graph it can be observed that the 6 most common causes of unnatural death are MVA pedestrian fatalities, burns, drowning, MVA passenger deaths, death by firearm and railway deaths.
MVA Ped 26.1
0 10 20 30
Percentage
Figure 2.B depicts the manner of causation of unnatural death:
Transport-related deaths accounted for the majority of deaths in Cape Town (42%).
The cause of death which, by manner, was classified as other UID's accounted for 32% of all unnatural deaths.
Homicide was found to be the 3rd leading manner of death, accounting for 17%, whilst undetermined deaths accounted for 7% of all
Manner of death in Cape Town n=180
7% 2%
Tra1SpOrt
42"16 • Other UfO's
o Horricide o Undetem"ined
32% • Suicide
manners of unnatural death. Suicide accounted for only 2% - see Annexure 2, Table 1.
39
University
of Cape
Town
1. External causes of death by manner 1.1. Transport-related deaths [Figure 2.C]
Transport related deaths in Cape Town n= 76
~ 50~--~---~
..c:::
1ij 40
Q)
~. 30 o
~ 20
..c E 10
:l
Z 0
Ped Pass Railway
External causes of death
1.2.0ther UIO's [Figure 2.D]
MVA Unspec
In the transport-related death category, pedestrian fatalities constituted 61.8%, followed by passenger deaths (21.1 %), and railway deaths (10.5%).
Other UID's in Cape Town n=57
35 31 30 25
Qj
E
c 20Qj
~ 15 a. Qj
10 5 0
Bums Drowning Pois. Ing FalJ(height) StrangulatiorChokinglAsp Crushing FalJ(other) External causes of death
In the other UIO's category, burns outnumbered all other deaths, accounting for 54.4% of deaths. This was followed by drowning (24.6%).
University
of Cape
Town
1.3.Homicide [Figure 2.E]
Homicidal deaths in Cape Town n=31
12 .-~~---~
III
~
10 iii Q.) 8
"'C
'0 6
~ E 4
::::J Z
2
o
Firearm Sharp Blunt Abandoned Strangulation DrO'Mling Pois. Gas External causes of death
Of all homicidal deaths in Cape Town, firearm homicides accounted for the majority (35.9%).
This was followed by sharp object homicides (19.4%).
Blunt object homicide and abandonment of babies each accounted for 16.1 %, while poisoning (gassing), and drowning each accounted for 3.2%.
1.4. Undetermined deaths [Figure 2.F]
In this category abortions accounted for the majority of deaths, followed by SIDS, drowning, and poisoning by
ingestion.
1.5.Suicide
III ..I::
-
ca Q)"'C
-
0 Qj.c E
::::J
z
3.5 3 2.5 2 1.5 1 0.5 0
Undetermined deaths n=12
3
Abortion SIOS OrO'Mling Pois. Ing Explosive Med. Blunt Proc
External causes of death
There were 4 suicidal deaths recorded in Cape Town. Two involved suicide by firearm, one by hanging and the other poisoning (ingestion).
41
University
of Cape
Town
2. Sex variation in all unnatural deaths
Of the total number of unnatural deaths in Cape Town (219), in only 179 of these cases was the sex recorded (81.7%) [Figure 2.G]
Sex variation of unnatural deaths in Cape Town n=179
Males accounted for the majority of unnatural deaths (65.9%).
In 140
J:: 120
-
cu Q) 100"C
....
800
"- 50
Q)
..c 40 E ::J 20
2 0
Males Females
Sex
3. Sex variation in the most common external causes of unnatural death [Figure 2.B]
Among the males, MVA pedestrian fatalities was the leading external cause of their deaths, accounting for 27.2%.
The 2nd leading causes of their death included both drowning and burns, each accounting for 12.7%.
Notably, in drowning, there were approximately 8 males for every female victim. In the railway deaths, males
outnumbered females 7 to 1;
in the sharp and blunt object categories, males
outnumbered females 5 to 1;
in strangulation 3 to 1; and in firearm and transport-related deaths (MVA pedestrian and MVA passenger) males
In J::
-
cu Q)"C
....
o"-
..c Q)
E ::J
2
TIle most common external causes of unnatural deaths in Cape Town by sex n= 179
40 . , - - - , 30
20
Sex
Ped
• Bums
o Drowning o Firearm
• Pass ClRailway
outnumbered females by approximately 2 to 1 - see Annexure 2 Table 2.
Among the females, MVA pedestrian fatalities alone did not outnumber other causes of their deaths. Burns and MVA pedestrian fatalities achieved equal percentages (24.7%) and were the leading causes of death amongst females. The 2nd and 3rd leading causes of their deaths were firearm deaths and MVA passenger deaths.
University
of Cape
Town
Notably, in drowning, there were approximately 8 males for every female victim. In the railway deaths, males outnumbered females 7 to 1; in the sharp and blunt object categories, males outnumbered females 5 to 1; in strangulation 3 to 1; and in firearm and transport-related deaths (MVA pedestrian and MVA passenger) males
outnumbered females by approximately 2 to 1.
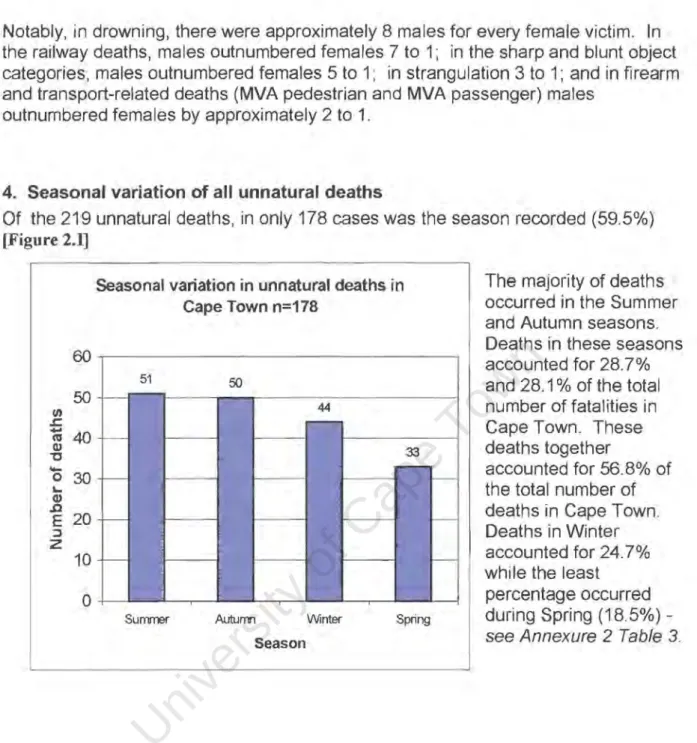
4. Seasonal variation of all unnatural deaths
Of the 219 unnatural deaths, in only 178 cases was the season recorded (59.5%) [Figure 2.1]
Seasonal variation in unnatural deaths in The majority of deaths
Cape Town n=178 occurred in the Summer
and Autumn seasons.
60 Deaths in these seasons
accounted for 28.7%
51 50 and 28.1% of the total
50 number of fatalities in
.s::. II) Cape Town. These
-
""C C'IJ QJ 40 deaths together....
0 accounted for 56.8% ofL.. 30 the total number of
Q)
.0 deaths in Cape Town .
E 20
~ Deaths in Winter
2 10 accounted for 24.7%
while the least
0 pe