The Parliament of South Africa passed the South African Academy of Sciences Act (Act 67 of 2001), which came into force on 15 May 2002. This made ASSAf the only Academy of Sciences in South Africa officially recognized by the government and representing the country in international community of scientific academies and elsewhere.
Message from the ASSAf President
IAP – The Global Network of Science Academies – has been promoting the role of women in science for years. IAP – The Global Network of Science Academies, is a network of 111 merit-based science academies and aims to strengthen the role of science academies in society.
Acknowledgements
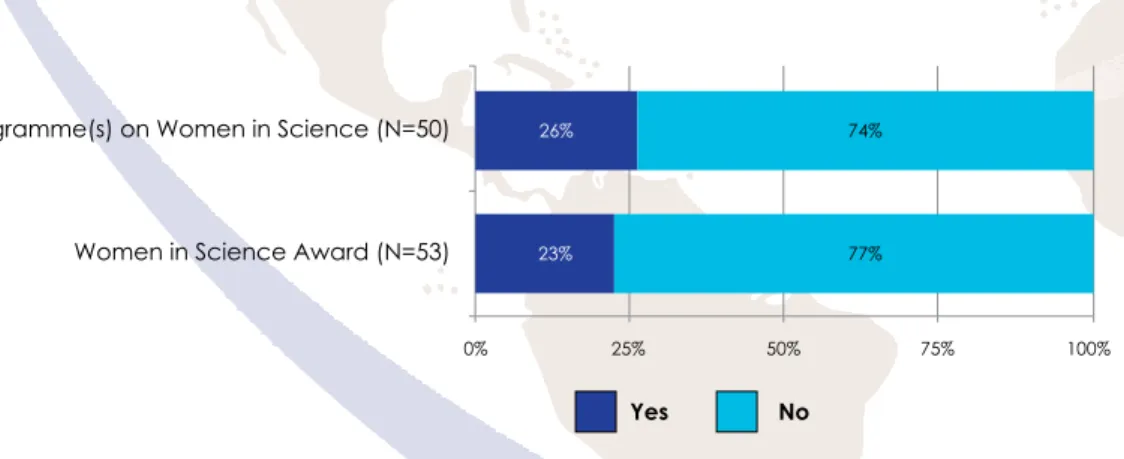
Twelve (23%) of the 53 national academies in the ASSAf survey stated that they host a Women in Science award. Thirty-one (or 61%) of the 51 science academies in the ASSAf survey had none of the above.
1 Introduction
2 Global overview of Women’s Participation in Science
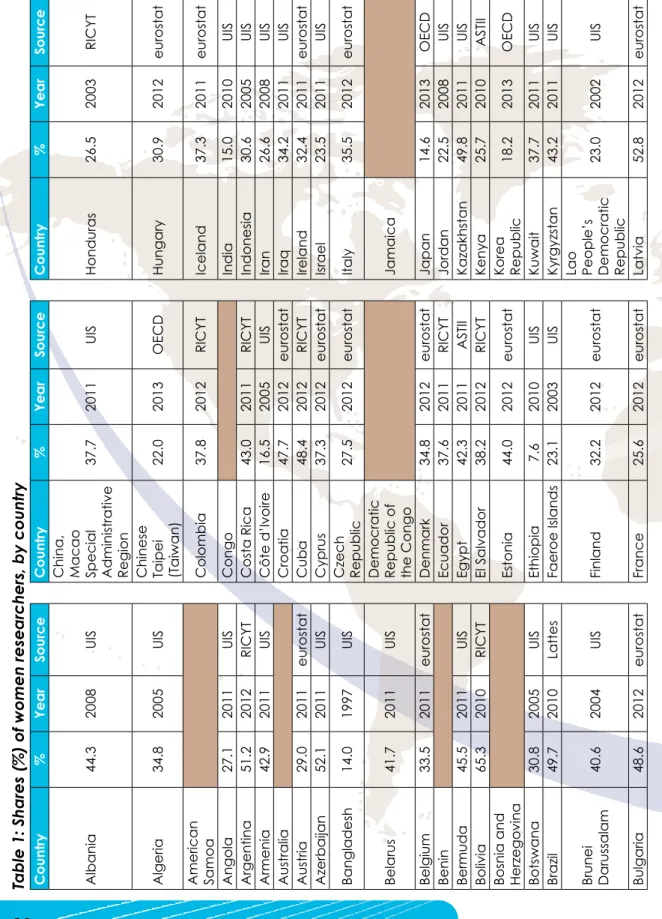
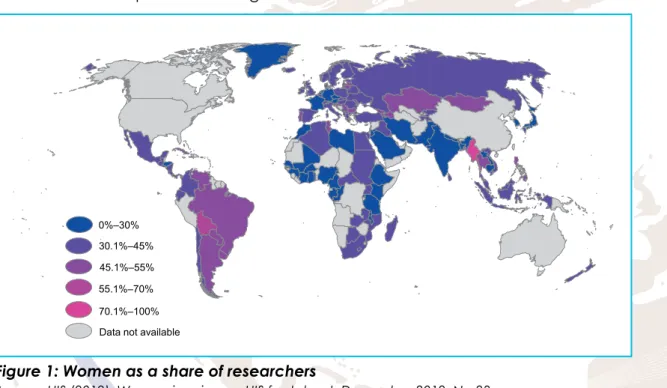
Given the limitations of UIS data, we also used other sources to obtain data on the proportion of female researchers. Shaded cells indicate that statistics on the proportion of female researchers could not be obtained for that country from any of the sources reviewed.
3 Survey Methodology
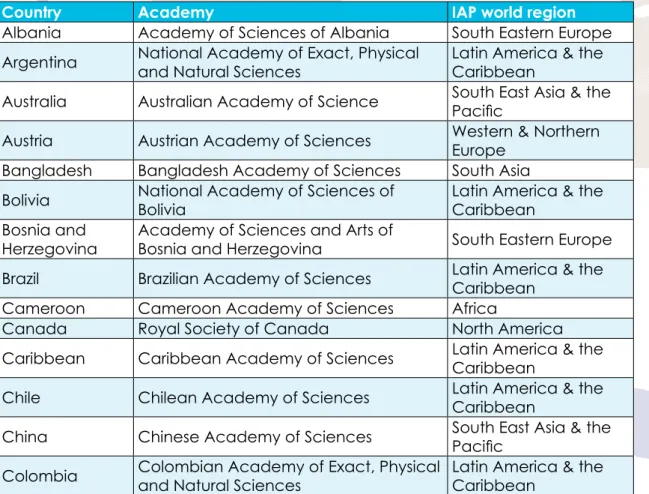
Albania Academy of Sciences of Albania Southeast Europe Argentina National Academy of Exact, Phys. Bosnia and Herzegovina Southeast Europe Brazil Brazilian Academy of Sciences Latin America & the.
4 results
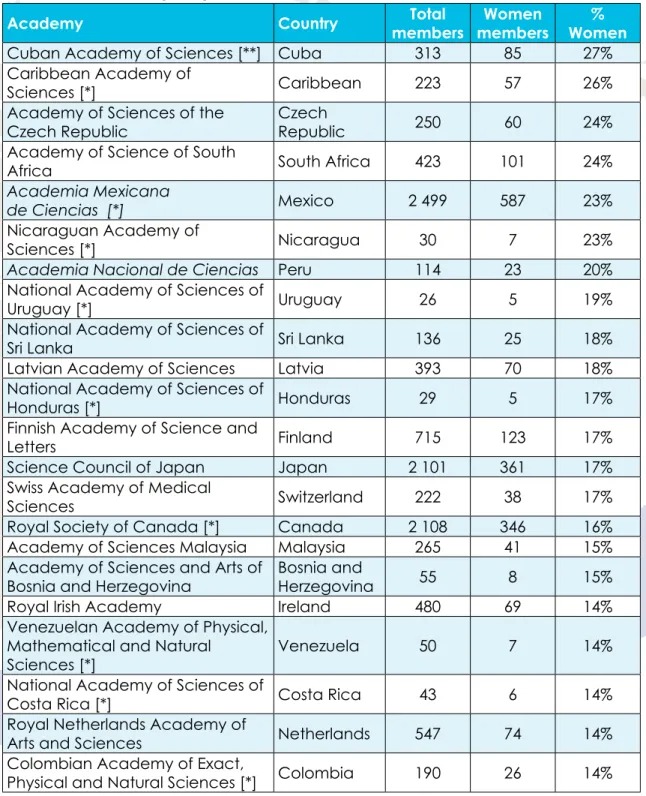
Academy Membership
These include the Egyptian Academy of Scientific Research and Technology, the Union of German Academies of Sciences and the Swiss Academies of Arts and Sciences and two of its four constituent members (the Swiss Academy of Humanities and Social Sciences [SAHS] and the Swiss Academy of Sciences [ SCNAT]). Although the National Academy of Sciences of Panama participated in the IANAS survey, statistics for this academy are not included in the table above. Both of these academies have unusually large membership figures, based on Table 4 above: the Royal Society of Canada (2,108, of which 16% are women) and the US National Academy of Sciences (2,252, of which 13%. are female members).
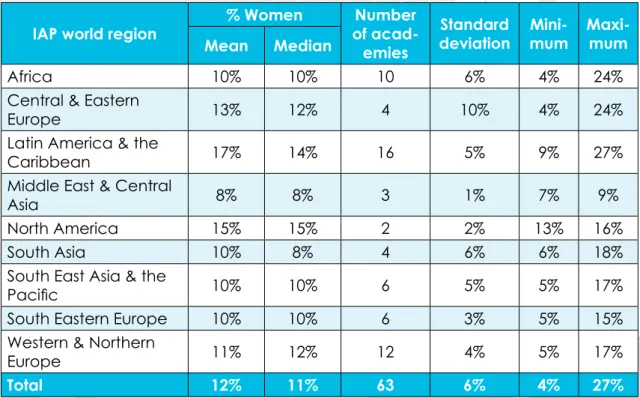
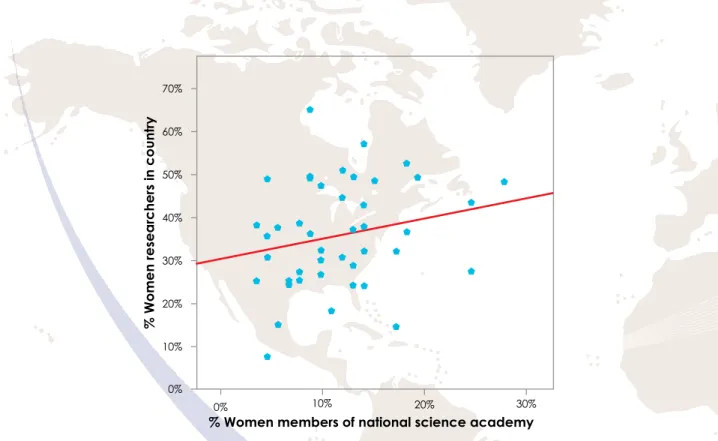
Note: The standard deviation refers to the change in the percentages of female members of individual academies. The latter means that only 5% of the variability in the percentages of female members of scientific academies can be accounted for by the percentages of female researchers at the national level.
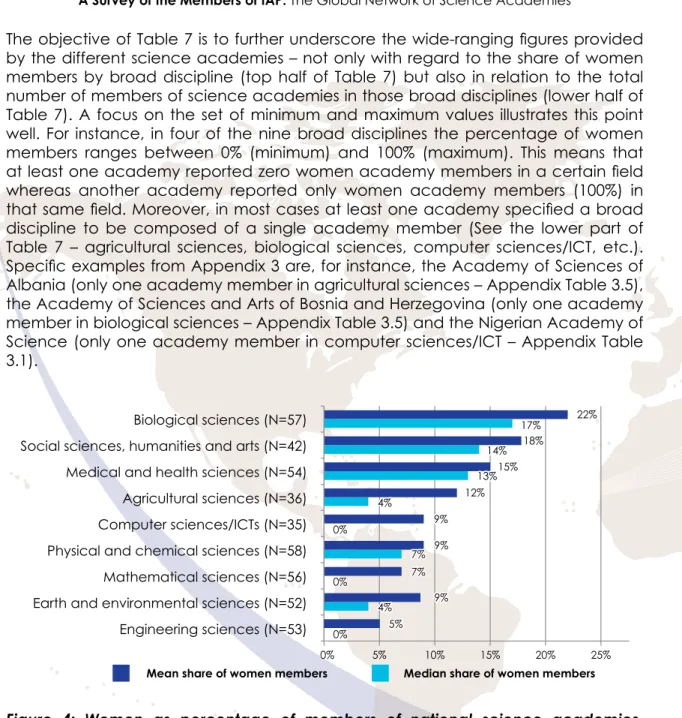
Academy Membership by Broad Discipline
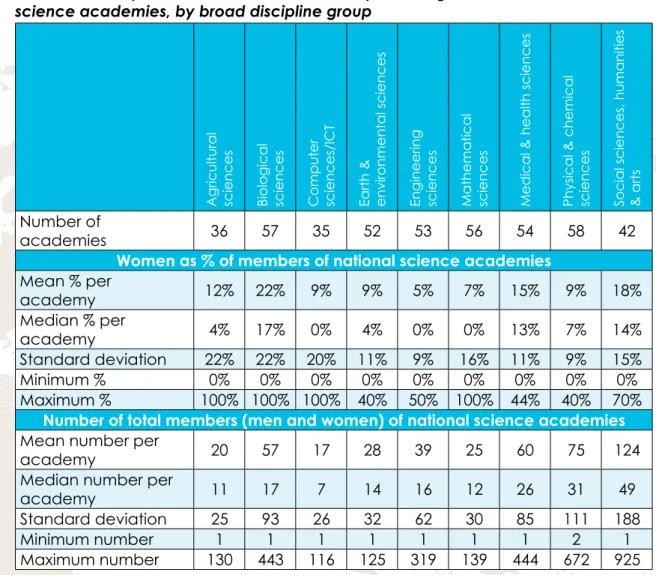
To illustrate: 35 academies reported having at least one member from the field of computer science/ICT. Of these 35 academies, 15 reported that at least 1% of members in the field were women; the remaining 20 academies reported 0% female representation. Note: The standard deviation refers to (1) the variation in the proportions of member members reported by individual academies in each broad discipline group and (2) the variation in the number of total members reported by individual academies in each broad discipline group.
For example, a country may have a significant number of female researchers in the social sciences, but the criteria for membership in that country's academy may not include the social sciences. Figures for the three global science academies (IAS, WAAS and TWAS) show a similar picture: women are 'best' represented among academy members in the social sciences and humanities (Table 9).
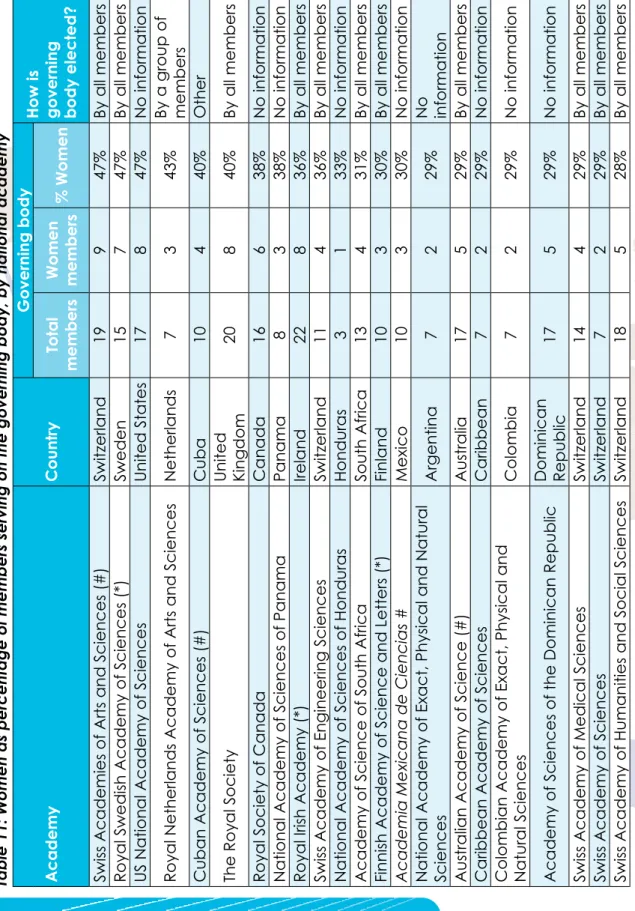
Academy Governance
Women Swiss Academies of Arts and Sciences (#)Switzerland19947%By all members Royal Swedish Academy of Sciences (*)Sweden15747%By all members US National Academy of Sciences United States17847%No information Royal Dutch Academy of SciencesNetherlands7343%. 20840%By all members Royal Society of CanadaCanada16638%No information National Academy of Sciences of PanamaPanama8338%No information Royal Irish Academy (*)Ireland22836%By all members Swiss Academy of Engineering Sciences Switzerland11436%By all members National Academy of Sciences of HondurasHonduras3133%No information Academy of Sciences of South Africa South Africa13431%By all members Finnish Academy of Sciences and Letters (*)Finland10330%By all members Academia Mexicana de Ciencias #Mexico10330%No information. Women Slovenian Academy of Sciences and ArtsSlovenia1300%By all members Turkish Academy of Sciences (*)Turkey1100%By all members.
Cuban Academy of Sciences: "The president is nominated by the Cuban government, by secret ballot". Hungarian Academy of Sciences: "The elected officials (6) (president, secretary-general, deputy secretary-general, 3 vice-presidents) and the 3 General Assembly delegates and 3 non-General Assembly delegates are appointed by the General Assembly elected (all members) and 200 selected members of the public body), the heads of scientific section (11) are elected by the sections, the delegates of the research institute network (3) are elected from among the heads of research institutions of the Academy, the delegate (1) of the Regional Academy Committees are elected by the heads of regional committees and there are invited external members (6)".
The second initiative asked in the ASSAf survey was whether the academy had any training(s) on "Women in Science". In the case of the three global academies, both IAS and TWAS reported having a program on "Women in Science". Secretariat) of Policies for Women, Third World Organization for Women in Science, Brazilian Chapter.
Of the three global academies of science, only TWAS reported having a "Women in Science" award presented annually. A recent report from CWSEM's recent report is titled Women in Science and Engineering Statistics.
5 Progress towards Inclusiveness?
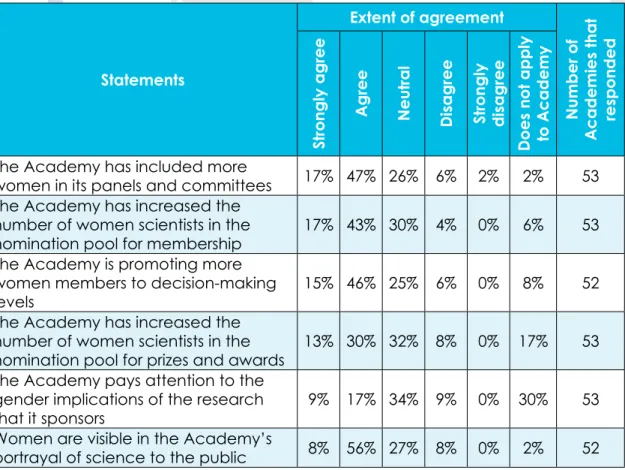
A statement to this effect (“The academy has increased the number of female scientists in the membership nomination pool”) was also presented to respondents in the survey that ASSAf coordinated. Accordingly, 64% of the 50 academies strongly agreed or agreed that their academy has increased the number of female scientists in the membership nomination pool. However, only just over half (52%) agree that the number of women in the nomination pool for awards and honors has increased.
Finally, some of the action steps originally advocated in the 2006 IAC report (see Table 17 below) may need to be modified or even replaced with more effective ones as circumstances change. The increased participation of women in management boards was mentioned several times.
6 concluding comments
Academia's awareness of the under-representation of women may be growing, but 60% of academies surveyed do not address gender/diversity issues at all, do not check whether the research they sponsor or evaluate (where appropriate), and the studies and activities they undertake and convene , can affect men and women differently. The report doesn't provide a complete picture of women's participation in the academies of science, but it does offer some pieces of a long-overdue narrative. At the same time, there are several aspects of women's participation in science that the current research did not explore.
Cultural effects that may influence women's selection into the scientific academies were also not addressed through the mainly quantitative results presented here. In summary, although the statistics provide a picture of the status of women's membership of and participation in academy structures, they do not reveal the underlying reasons.
7 recommendations
Survey of Women in the Academies of
R epoRt pRepaRed by FRANCES HENRY
THE INTER-AMERICA NETWORK OF ACADEMIES OR SCIENCES RESEARCH AMONG WOMEN IN THE ACADEMIES OF AMERICA.
F ocal P oint oF the W omen For S cience P rogram
M exIco
N IcaRagua
The final questionnaire was completed in December 2013 and sent to the presidents of the nineteen member academies in January 2014. After several reminders, seventeen were returned, although some newer academies that had just been organized could not answer all the questions. . Two were not returned.1 Most of the questionnaires were completed by the presidents of the academies, some by staff members assisted by the presidents, and some by IANAS contact points assisted by staff or their presidents.
A final report was presented to the Women for Science meetings in Ottawa, Canada in September. IANAS sent this version to the academies for approval, and two requested minor changes, which were incorporated and sent to IANAS on 21 January 2015.
Survey of Women in the Academies of the
For some time, the Inter-American Network of Academies of Science (IANAS) group Women in Science had wanted to conduct a census of its member Academies in order to determine their percentage of female members. There was a previous attempt to collect this data, but it now needed updating. A series of questions were developed and some were incorporated from a previous survey conducted by the South African Academy of Sciences.
Subsequently, two academies that had not responded to the initial questionnaire submitted data that is now included in this report, which was sent to the IANAS Secretariat at the end of December 2014. After some delay, two more changes were requested and this final version was sent to IANAS. on May 28, 2015.
Americas
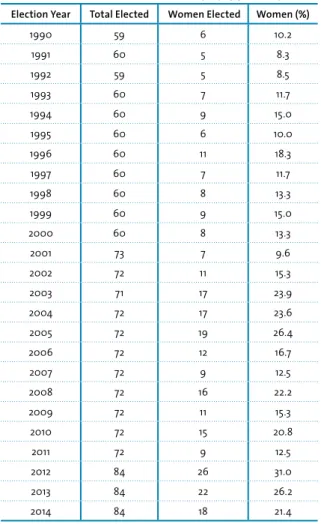
The application is reviewed with CHART 1A: PERCENTAGE OF WOMEN IN THE NATIONAL ACADEMY OF SCIENCES (US) BY YEAR. Another important dimension of women's participation in the work of academies of science is their role in management or administrative councils. Of the four countries with the highest proportion of women in the governing council, Cuba is the only one with a gender equality policy. GRAPH 1: PERCENTAGE OF FEMALE MEMBERS BY ACADEMY.
In fact, almost half of the reporting Academies, i.e. seven out of fifteen, have an all-female secretariat (see Chart 3 for an illustration). Looking at Chart 6, we can clearly see the high representation of women in the Secretariat compared to their representation on the Governing Council and/or as members of the Academy.
Questionnaire
How many FEMALE MEMBERS does your Academy have in the broad discipline groups listed below? Uganda's National Academy of Sciences included "law", "economics and banking" and "veterinary sciences" as part of "other disciplines". The Royal Netherlands Academy of Arts and Sciences included "earth and environmental sciences" as part of "agricultural sciences"; and "engineering sciences" as part of "computer sciences/ICT".
Academy of EngineeringLife/Health/MedicineMathematicsPhysics Other Social Sciences TW%WTW%WTW%WTW%WTW%WTW%W LATIN AMERICA AND THE CARIBBEAN. Academy EngineeringLife/Health/MedicineMathematicsPhysics Other Social Sciences TW%WTW%WTW%WTW%WTW%WTW%W NORTH AMERICA Royal Society of Canada.