FINAL ANNUAL BUDGET OF
UTHUKELA DISTRICT MUNICIPALITY
201 7/18TO 201 9/20
MEDIUM TERM REVENUE &
EXPENDITURE FORECASTS
Copies of this document can be viewed:
•At thereception area of the municipality
•At www.uthukeladm.co.za
MAY 2017 2
TABLE OF CONTENTS
PART 1 – DRAFT ANNUAL BUDGET
1.1 MAYOR’S REPORT 1.2 COUNCIL RESOLUTIONS 1.3 EXECUTIVE SUMMARY
1.4 OPERATING REVENUE FRAMEWORK 1.5 OPERATING EXPENDITURE FRAMEWORK 1.6 CAPITAL EXPENDITURE
1.7 ANNUAL BUDGET TABLES
PART 2 – SUPPORTING DOCUMENTATION
2.1 OVERVIEW OF THE ANNUAL BUDGET PROCESS
2.2 OVERVIEW OF ALIGNMENT OF ANNUAL BUDGET WITH IDP 2.3 OVER VIEW OF BUDGET RELATED POLICIES
2.4 OVER VIEW OF BUDGET ASSUMPTIONS 2.5 OVER VIEW OF BUDGET FUNDING
2.6 EXPENDITURE ON GRANTS AND RECONCILIATIONS OF UNSPENT FUNDS 2.7 COUNCILLOR AND EMPLOYEE BENEFITS
2.8 MONTHLY TARGETS FOR REVENUE, EXPENDITURE AND CASH FLOW 2.9 LEGISLATION COMPLIANCE STATUS
2.10 OTHER SUPPORTING DOCUMENTS
2.11 MUNICIPAL MANAGER’S QUALITY CERTIFICATE
ANNEXURE
Service level Standards Tariffs
ABBREVIATIONS & ACRONYMS
ℓ litre
LED Local Economic Development MEC Member of the Executive Committee MFMA Municipal Financial Management Act
Programme
MIG Municipal Infrastructure Grant MMC Member of Mayoral Committee MPRA Municipal Properties Rates Act
MSA Municipal Systems Act
MTEF Medium‐term Expenditure Framework MTREF Medium‐term Revenue and Expenditure
Framework
NERSA National Electricity Regulator South Africa NGO Non‐Governmental organisations NKPIs National Key Performance Indicators
OHS Occupational Health and Safety
OP Operational Plan
PBO Public Benefit Organisations PHC Provincial Health Care PMS Performance Management System PPE Property Plant and Equipment PPP Public Private Partnership PTIS Public Transport Infrastructure System
RG Restructuring Grant
RSC Regional Services Council SALGA South African Local Government
Association
SAPS South African Police Service SDBIP Service Delivery Budget Implementation
Plan
SMME Small Micro and Medium Enterprises
AMR Automated Meter Reading
ASGISA Accelerated and Shared Growth Initative
BPC Budget Planning Committee CBD Central Business District CFO Chief Financial Officer CM Municipality Manager CPI Consumer Price Index
CRRF Capital Replacement Reserve Fund DBSA Development Bank of South Africa DoRA Division of Revenue Act
DWA Department of Water Affairs EE Employment Equity
EEDSM Energy Efficiency Demand Side Management EM Executive Mayor
FBS Free basic services
GAMAP Generally Accepted Municipal Accounting
GDP Gross domestic product
GDS Gauteng Growth and Development Strategy GFS Government Financial Statistics
GRAP General Recognised Accounting Practice HR Human Resources
HSRC Human Science Research Council IDP Integrated Development Strategy IT Information Technology
kℓ kilolitre km kilometre
KPA Key Performance Area KPI Key Performance Indicator
kWh kilowatt
MAY 2017 4 PART 1- ANNUAL BUDGET
1.1 MAYORS REPORT
SPEECH BY THE MAYOR OF UTHUKELA DISTRICT MUNICIPALITY PRESENTED TO THE MUNICIPAL COUNCIL ON THE OCCASION OF TABLING OF THE 2017/2018 FINAL
BUDGET IN THE COUNCIL
BOARDROOM, LADYSMITH, ON 18 MAY 2017
VISION
Our vision is an economically sound municipality with effective infrastructure and a municipality that empowers people, protects the environment and demonstrates excellence in leadership.
In this tabled draft budget Council has endeavoured to achieve these calls and has tried to provide for this within its limited resources. Given the constraints on the revenue side, tough decisions have been made to ensure a sustainable budget.
JOB CREATION
Council has heeded the Government’s call for job creation and has partnered with the Department of Public Works to ensure that the EPWP is fully operational in this Municipality. The allocation for EPWP will increase for 2017/2018 financial year to R3.7 million financial year which will assist to ensure that service delivery is instigated accordingly. A further R3 million has been provided from internally generated fund to facilitate the job creation programme.
INFRASTRUCTURE DEVELOPMENT
The total capital grant allocations for 2017/18 financial year have increased from R 342 million to R367 million.
We will continue to upgrade our infrastructure and embark on new capital projects improve water distribution and reticulation. Various infrastructure projects that have been identified by the community during the needs analysis will be considered in this budget.
DEBT MANAGEMENT
Council has written off debts for qualifying indigent debtors, a concerted effort has been made to collect and reduce all outstanding debts. Council has also approved the implementation of the flat tariff in order to improve the collection rate. Debt collection and revenue enhancement will remain a priority in the upcoming financial year. The municipality is currently awaiting recommendations from COGTA on the issue of revenue enhancement.
ASSET MANAGEMENT
Asset management is prioritised and ensuring that councils assets are managed properly.
We have responsibility of reducing expenditure on non-essential assets and prioritising repairs and mantaince of municipal assets.
THE WAY FORWARD
The municipality will remain dedicated to its core business of providing high quality basic services to the community. All areas of non-performance affecting basic service delivery will be identified and remedial measures will be employed accordingly. The limited resources available will be prioritised strictly for basic service delivery.
With those few words I plead for your uncompromised support in the financial year ahead.
1.2 COUNCIL RESOLUTIONS:
On 18 May 2017 the Council of UThukela District Local Municipality met in the Council Boardroom of UThukela District Municipality to consider the draft annual budget of the municipality for the financial year 2017/18. The Council approved and adopted the following resolutions:
1. The UThukela District Local Municipality, acting in terms of section 24 of the Municipal Finance Management Act, (Act 56 of 2003) approves and adopts:
1.1. The annual budget of the municipality for the financial year 2017/18 and the multi-year and single-year capital appropriations as set out in the following tables:
1.1.1. Budgeted Financial Performance (revenue and expenditure by standard classification) as contained in Table A2
1.1.2. Budgeted Financial Performance (revenue and expenditure by municipal vote) as contained in Table A3
1.1.3. Budget Summary as contained in Table A1
1.1.4. Budgeted financial performance (revenue and expenditure) as contained in Table A4
1.2. The financial position, cash flow budget, cash-backed reserve/accumulated surplus, asset management and basic service delivery targets are approved as set out in the following tables:
1.2.1. Budgeted Financial Position as contained in Table A6 1.2.2. Budgeted Cash Flows as contained in Table A7
1.2.3. Cash backed reserves and accumulated surplus reconciliation as contained in Table A8
1.2.4. Asset management as contained in Table A9
1.2.5. Basic service delivery measurement as contained in Table A10
2. The Council of UThukela District Local Municipality, acting in terms of section 75A of the Local Government: Municipal Systems Act (Act 32 of 2000) approves and adopts with effect from 1 July 2017:
MAY 2017 6 2.1. That the salaries, wages and allowances of all employees be increased by 7.4%
in accordance with the multiyear SALGBC wage agreement with effect from 01 July 2017.
2.2. That the salaries, wages and allowances of all Section 56 employees and other employees by the same percentage with effect from 01 July 2017.
2.3. The tariffs for water services.
2.4. The tariffs for sanitation services.
2.5. The tariffs for other municipal services.
1.3 EXECUTIVE SUMMARY
The application of sound financial management principles for the compilation of the Municipality’s financial plan is essential and critical to ensure that the Municipality remains financially viable and that municipal services are provided sustainably, economically and equitably to all communities.
In the compilation of this budget the municipality has taken note of the Cabinet resolution by which all national and provincial departments, constitutional institutions and all public entities are required to implement cost containment measures. These cost containment measures must be implemented to eliminate waste, reprioritise spending and ensure savings on six focus arrears namely consultancy fees, no credit cards, travel and related costs, advertising, catering and events costs as well as accommodation.
The Municipality has embarked on implementing a range of revenue collection strategies to optimize the collection of debt owed by consumers. Most of which will benefit the municipality as well as consumers. Consultants have also been engaged in the revenue department to assist with the prior year’s qualifying matters
National Treasury’s MFMA Circular No.85 and 86 were used to guide the compilation of the 2017/18 MTREF.
The main challenges experienced during the compilation of the 2017/18 MTREF can be summarised as follows:
• The on-going difficulties in the national and local economy;
• Aging water infrastructure;
• The need to reprioritise projects and expenditure within the existing resource envelope given the cash flow realities and declining cash position of the municipality;
• The increased cost of bulk electricity (due to tariff increases from Eskom), which is placing upward pressure on service tariffs to residents. Continuous high tariff increases are not sustainable - as there will be point where services will no-longer be affordable;
• Escalating water losses
• Wage increases for municipal staff that continue to exceed consumer inflation, as well as the need to fill critical vacancies.
• Affordability of capital projects – R367 million will be received as capital grants
The following budget principles and guidelines directly informed the compilation of the 2017/18 MTREF:
• The 2016/17 Adjustments Budget priorities and targets, as well as the base line allocations contained in that Adjustments Budget were adopted as the upper limits for the new baselines for the 2017/18 annual budget;
• Intermediate service level standards were used to inform the measurable objectives, targets and backlog eradication goals;
• Tariff increases should be affordable and should generally not exceed inflation as measured by the CPI, except where there are price increases in the inputs of services that are beyond the control of the municipality, for instance the cost of bulk water and electricity. In addition, tariffs need to remain or move towards being cost reflective, and should take into account the need to address infrastructure backlogs;
• There will be no budget allocated to national and provincial funded projects unless the necessary grants to the municipality are reflected in the national and provincial budget and have been gazetted as required by the annual Division of Revenue Act;
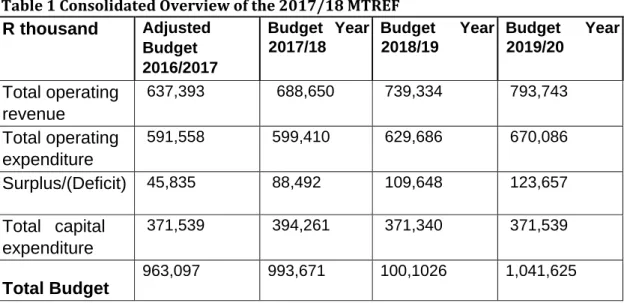
In view of the aforementioned, the following table is a consolidated overview of the proposed 2017/18 Medium-term Revenue and Expenditure Framework:
Table 1 Consolidated Overview of the 2017/18 MTREF R thousand Adjusted
Budget 2016/2017
Budget Year 2017/18
Budget Year 2018/19
Budget Year 2019/20
Total operating revenue
637,393 688,650 739,334 793,743 Total operating
expenditure
591,558 599,410 629,686 670,086 Surplus/(Deficit) 45,835 88,492 109,648 123,657 Total capital
expenditure
371,539 394,261 371,340 371,539
Total Budget
963,097 993,671 100,1026 1,041,625
Total operating revenue has increased by 8% or R50 million for the 2017/18 financial year when compared to the 2016/17 adjustments budget due to the general increase in the services charge and increases in the government grant allocations for the 2017/18 financial year. For the outer years, operational revenue will increase by 5.7 and 5.6% respectively.
Total operating expenditure for the 2017/18 financial year has been appropriated at R599 million and translates into a budget surplus of R88 million. When compared to the 2015/16 Adjustment Budget, operational expenditure has increased by R7 million the 2017/18 budget and increased by 5.7 and 5.6% for each of respective outer years of the MTREF.
MAY 2017 8 The capital budget of R371 million for 2017/18 is funded by National Government Grants to the extent of R 367 million. Council vehicles to the value of R4.2 million will be funded from internally generated funds.
1.4 OPERATING REVENUE FRAMEWORK
For UThukela District Municipality to continue improving the quality of services provided to its citizens it needs to generate the required revenue. In these tough economic times strong revenue management is fundamental to the financial sustainability of every municipality. The reality is that we are faced with development backlogs and poverty. The expenditure required to address these challenges will inevitably always exceed available funding; hence difficult choices have to be made in relation to tariff increases and balancing expenditures against realistically anticipated revenues.
The municipality’s revenue strategy is built around the following key components:
• National Treasury’s guidelines and macroeconomic policy;
• Growth in the Municipality and continued economic development;
• Efficient revenue management, which aims to achieve a 60% annual collection rate for key service charges;
• Achievement of full cost recovery of specific user charges especially in relation to trading services;
• Determining the tariff escalation rate by establishing/calculating the revenue requirement of each service;
• Increase ability to extend new services and recover costs;
• The municipality’s Indigent Policy and rendering of free basic services; and tariff policies of the Municipality.
The following table is a summary of the 2017/18 MTREF (classified by main revenue source):
Table 2 Summary of revenue classified by main revenue sourceA4
OTHER REVENUE:
Other revenue can be unbundled as follows:
Vehicle Trade in Assistance: R 748 000 Trade affluent income: R 1,270,259 Sewer Tanks & Pits: R 207,312 Clearance Certificate: R 162,508 Water Connection: R1, 133,749 Insurance Refund: R500 000 Building Plan: R71, 320
Tender Document Sales: R134 000
R thousand Audited
Outcome
Audited Outcome
Audited Outcome
Original Budget
Adjusted Budget
Full Year Forecast
Pre-audit outcome
Budget Year 2017/18
Budget Year +1 2018/19
Budget Year +2 2019/20 Revenue By Source
Service charges - water revenue 118,572 110,521 136,221 159,378 231,101 231,101 231,101 245,892 259,908 274,463 Service charges - sanitation revenue 14,199 15,920 16,900 17,551 17,551 17,551 17,551 18,674 19,738 20,844 Interest earned - external investments 44,045 9,073 11,991 10,671 7,671 7,671 7,671 11,539 12,197 12,887 Interest earned - outstanding debtors – 19,149 20,215 28,321 38,321 38,321 38,321 40,774 43,098 45,511 Transfers recognised - operational 274,934 301,291 322,989 338,198 339,353 339,353 339,353 367,387 400,550 435,980 Other revenue 1,919 9,561 3,567 1,914 3,395 3,395 3,395 4,384 3,843 4,059 Gains on disposal of PPE 935 – – –
Total Revenue (excluding capital transfers and contributions)
454,604
465,513 511,884 556,033 637,393 637,393 637,393 688,650 739,334 793,743
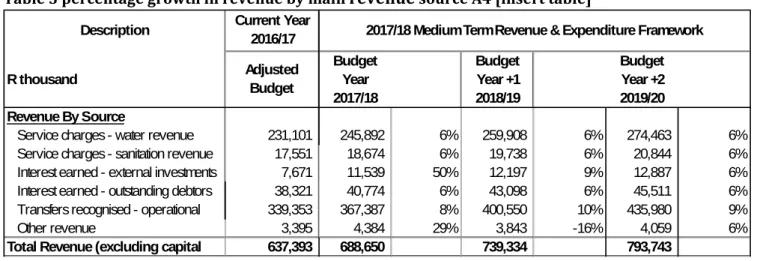
MAY 2017 10 Table 3 percentage growth in revenue by main revenue source A4 [insert table]
Table 4 Revenue mix by source A4
In line with the formats prescribed by the Municipal Budget and Reporting Regulations, capital transfers and contributions are excluded from the operating statement, as inclusion of these revenue sources would distort the calculation of the operating surplus/deficit.
Revenue generated from water and sanitation services charges forms a significant percentage of the revenue basket for the Municipality. Service charge revenues comprise 36% of the total revenue mix. In the 2017/18 financial year, services charges are expected to total R245 million.
Revenue generated increase to service charges is due to the increase in tariffs as well as new connections.
The water and sanitation tariffs have been increased by 6.4% across the board. Circular 86 of the MFMA stipulates that all tariffs should be cost reflective. These services are failing to break even currently which indicates that the current tariffs are not cost reflective. The Finance
Description
R thousand Adjusted
Budget
Budget Year 2017/18
Budget Year +1 2018/19
Budget Year +2 2019/20 Revenue By Source
Service charges - water revenue 231,101 245,892 6% 259,908 6% 274,463 6%
Service charges - sanitation revenue 17,551 18,674 6% 19,738 6% 20,844 6%
Interest earned - external investments 7,671 11,539 50% 12,197 9% 12,887 6%
Interest earned - outstanding debtors 38,321 40,774 6% 43,098 6% 45,511 6%
Transfers recognised - operational 339,353 367,387 8% 400,550 10% 435,980 9%
Other revenue 3,395 4,384 29% 3,843 -16% 4,059 6%
Total Revenue (excluding capital 637,393 688,650 739,334 793,743 Current Year
2016/17 2017/18 Medium Term Revenue & Expenditure Framework
Description
R thousand Original
Budget
Adjusted Budget
Budget Year 2017/18
Budget Year +1 2018/19
Budget Year +2 2019/20 Revenue By Source
Service charges - water revenue 159,378 231,101 36% 245,892 36% 259,908 35% 274,463 35%
Service charges - sanitation revenue 17,551 17,551 3% 18,674 3% 19,738 3% 20,844 3%
Interest earned - external investments 10,671 7,671 1% 11,539 2% 12,197 2% 12,887 2%
Interest earned - outstanding debtors 28,321 38,321 6% 40,774 6% 43,098 6% 45,511 6%
Transfers recognised - operational 338,198 339,353 53% 367,387 53% 400,550 54% 435,980 55%
Other revenue 1,914 3,395 1% 4,384 1% 3,843 1% 4,059 1%
Total Revenue (excluding capital 556,033 637,393 688,650 739,334 793,743 Current Year 2016/17 2017/18 Medium Term Revenue & Expenditure Framework
department will review these tariffs and gradually phase out the cost reflective tariffs in the next coming years.
Revenue increases by 5.7 and 5.6 %in the outer financial years of the MTREF.
Other revenue’ which consists of various items such as income received from the sale of tender documents and the issue of clearance certificates will total R3.8 million in the 2016/2017 financial year, the estimate is based on current trends and consist of R741 thousand of vehicle trade in value
Operating grants and transfers totals R367 million in the 2017/18. Below is a detailed split of the operating grants
Table 5 Operating Transfers and Grant Receipts
GRANTS 2017/2018 2018/2019 2019/2020
R'000 R'0010 R'000
EQUITABLE SHARE 361,568 398,405 433,175
EPWP 3,724
FINANACE MANAGEMENT GRANT 1,795 1,545 1,805 DEVELOPMENT PLANNING AND SHARED SERVICES 300
TOTAL 367,387 400,550 435,980
1.4.1 Water and Sanitation Tariffs
Tariff-setting is a pivotal and strategic part of the compilation of any budget. When rates, tariffs and other charges were revised, local economic conditions, input costs and the affordability of services were taken into account to ensure the financial sustainability of the Municipality.
National Treasury continues to encourage municipalities to keep increases in rates, tariffs and other charges as low as possible. Municipalities must justify in their budget documentation all increases in excess of the 6.4% upper boundary of the South African Reserve Bank’s inflation target. Excessive increases are likely to be counterproductive, resulting in higher levels of non- payment. The tariffs for the year 2017/18 have been increased by 6.4%
Discounting the impact of these price increases in lower consumer tariffs will erode the Municipality’s future financial position and viability. As mentioned earlier services are failing to break even.
It must also be appreciated that the consumer price index, as measured by CPI, is not a good measure of the cost increases of goods and services relevant to municipalities. The basket of goods and services utilized for the calculation of the CPI consist of items such as food, petrol
MAY 2017 12 the cost of remuneration, bulk purchases of electricity, petrol, diesel, chemicals etc. The current challenge facing the Municipality is managing the gap between cost drivers and tariffs levied, as any shortfall must be made up by either operational efficiency gains or service level reductions.
Within this framework the Municipality has undertaken the tariff setting process relating to service charges as follows
Tariff the cost of the provision of general services. Determining the effective tariff is therefore an integral part of the municipality’s budgeting process.
National Treasury’s MFMA Circular No. 85 and 86 deal, inter alia with the implementation of the Municipal Systems Act.
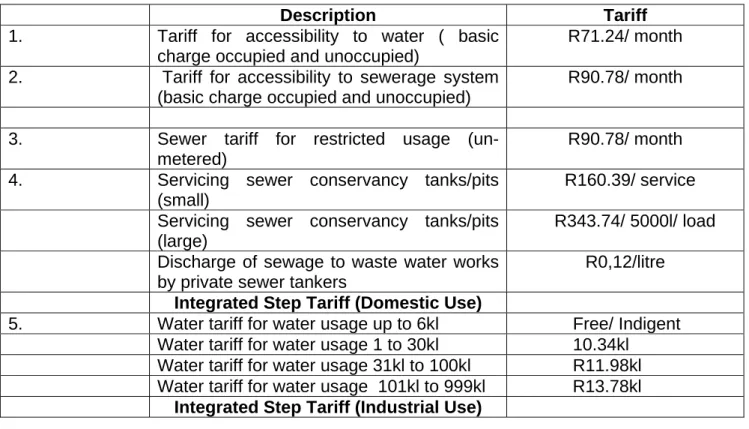
Below are the proposed water services tariff for the financial year 2017/2018 these tariffs exclude VAT.
DRAFT SERVICES TARIFF 2017/2018 FINANCIAL YEAR
Proposed water services tariff for the financial year 2017/2018 .
Table 6 Water and Sanitation Tariffs
Description Tariff 1. Tariff for accessibility to water ( basic
charge occupied and unoccupied)
R71.24/ month 2. Tariff for accessibility to sewerage system
(basic charge occupied and unoccupied)
R90.78/ month
3. Sewer tariff for restricted usage (un- metered)
R90.78/ month 4. Servicing sewer conservancy tanks/pits
(small)
R160.39/ service Servicing sewer conservancy tanks/pits
(large)
R343.74/ 5000l/ load Discharge of sewage to waste water works
by private sewer tankers
R0,12/litre Integrated Step Tariff (Domestic Use)
5. Water tariff for water usage up to 6kl Free/ Indigent Water tariff for water usage 1 to 30kl 10.34kl
Water tariff for water usage 31kl to 100kl R11.98kl Water tariff for water usage 101kl to 999kl R13.78kl
Integrated Step Tariff (Industrial Use)
6. Water tariff for water usage up to 1000kl R10.34kl Water tariff for water usage 1001kl and
above
R5.41kl
7. Bulk potable water supply to IDC Estate R5.41kl Bulk Raw water supply R3.30kl 8. Emergency Services Connection (excluding
emergency services)
R24.36kl 9. All connections, repairs and work required
from Council Domestic
Cost + 10%
10. All connections, repairs and work required from Council other services actual cost + 10
%
Cost + 10%
11. Trade Effluent Charge(c/kl)=
73.16c+([COD/1000] x 1.54c)
(COD-Chemical Oxygen Demand)
012. Account Deposits (Subject to credit
worthiness)
Every default adjustment of R164.14 to maximum as per following:
Residential Max
R2 463.94Business Max R 8209.11
New consumers:-
Residential = R 1 424.24 Business = R 3398.72 Connection Fees =R 164.65 13. Scrutiny of building plans R425.08/ plan 14. Clearing of grass overgrowth Actual cost + 12 % 15. Requested Water Tankering (funerals – if
not indigent)
5000l = R489.83 / load
16. Requested Water Tankering (other events) 5000l = R783.68/
load
17. Developer’s Capital Contribution - Water R 8905.74
18. Developer’s Capital Contribution -
Sanitation
R 9796.38
19. Disconnection Fee
Reconnection fee - Working hours
-After hours, Saturdays/Sundays/Public Holidays
R 117.54 R 119.33 R293.83
20. Clearance certificates R434.21
MAY 2017 14 21. Flat rate services (where applicable) R291.97 per
household Co-operatives:
Deposits to open water accounts=R669.29
1. R4.86@ 0-40kl 2. R5.55@ 41-80kl 3. R6.68@ 81- any usage Churches:
Deposits to open water accounts=R1 597.15 Admin fee is standard for all
1. R4.86@0-30kl 2. R5.63@31-70kl 3. R6.48@71- any usage Trusts:
Business operating Deposit to open the account R 3 194.29 Trusts not in business R1 338.58
Tariffs:
1. R9.72@0-30kl 2. R10.21@31-70kl 3. R11.95@71- any usage
Offences and penalties
1. Any person who fails or refuses to give access required by an officer of the authority or an authorized provider shall be guilty of an offence in terms of section 34 of the Water Services By-laws and liable on conviction to a fine not exceeding R 4 000,00 or in default on payment, to imprisonment for a period not exceeding 6 months and in the event of a continued offence to a further fine not exceeding R 2 000,00 for every day during the continuance of such offence after a written notice from the authority or an authorized provider has been issued and in the event of a second offence to a fine not exceeding R 6 000,00 or, in default on payment to imprisonment for a period not exceeding 12 months.
2. Any person who obstructs or hinders any officer of the authority in the exercise of his or her powers or performance of his or her functions or duties shall be guilty of an offence in terms of section 34 of the Water Services By-laws and liable on conviction to a fine not exceeding R50 000,00 or in default on payment, to imprisonment for a period not exceeding 6 months and in the event of a continued offence to a further fine not exceeding R10 000,00 for every day during the continuance of such offence after a written notice from the authority has been issued and in the event of a second offence to a fine not exceeding R75 000,00 or, in default on payment to imprisonment for a period not exceeding 12 months.
Water and Waste Water Analysis
Determinant Units Cost per sample
Alkalinity mg/l CaCO3 R56.71
Appearance Descriptive
Aluminium - soluble mg/l Al R49.09
Ammonia mg/l N R47.28
Chloride mg/l Cl R37.84
Chlorine – Free mg/l Cl2 R18.85
Colour Pt-Co R28.27
Conductivity mS/m R18.85
Fluoride mg/l F R47.28
Iron mg/l Fe R27.73
Manganese mg/l Mn R47.28
Nitrate mg/l N R28.27
Nitrite mg/l N R28.27
Odour Descriptive
pH pH Units R18.85
Phosphate - soluble mg/l P R28.27
Solids - Settle able ml/l R28.27
Sulphate mg/l SO4 R41.50
Sulphide mg/l H2S R47.28
Suspended Solids mg/l R41.76
Temperature 0C
Total Dissolved Solids mg/l R28.27
Turbidity NTU R18.85
Oxygen Absorbed mg/l O2 R56.71
Chemical Oxygen Demand mg/l O2 R66.12
Magnesium/Calcium mg/l Mg/Ca R65.98
Sample bottles can be collected at the Laboratory.
A volume of at least 1 litre is necessary for analysis.
MAY 2017 16 Microbiological Analysis
Faecal coliforms colonies per 100ml R52.01
Total coliforms colonies per 100ml R52.01
Standard plate count colonies per ml R43.37
Sample bottle can be collected at the Laboratory.
A volume of at least 1 litre is necessary for analysis.
THE ABOVE TARIFFS EXCLUDE VAT
• Sterile bottles provided by the Laboratory should be used.
• Samples must be delivered to the Laboratory within 6 hours of collection and should be kept cold.
• A volume of 500ml is sufficient for analysis.
1. Prices listed are for single samples.
2. Sterile bottles can be supplied free of charge. Bottles broken or not returned will be charged for at a rate of R17.23 per bottle.
FINES FOR ILLEGAL CONNECTIONS AND TEMPERING
First instance R 2 500 Second instance R 5 000 Third instance R 7 500 Forth instance R10 000 NB: Immediately if the consumer committed a fifth instance, complete disconnection of water supply will apply!
PENALTY FEES
1. Warning letter R 53.20 2. Final cut-off
• Additional deposit-business R 159.60
• Additional deposit-households R112.78
• Penalty fee R 87.22
RECONNECTION FEES:
1. Standard fee applies during working office hours R116.15 2. Standard rate applies after office hours R277.20
NEW CONNECTION (PLUMBING WORK) CHARGES NO SIZE (MM) UNIT COST R DEPOSIT
1 20 2 387.35 212.80
2 25 2 387.35 212.80
3 32 2 859.50 532.00
4 40 6 384.00 532.00
5 50 6 780.91 532.00
6 80 9 388.77 532.00
7 100 10 815.56 532.00
8 150 11 229.50 532.00
Other municipal services increase by 6.4% as per MFMA circular 86.
Tender documents Maps GIS
Clearance certificates
A3 PRINTER A0 PLOTTER
A4 A3 A2 A1 A0
MAY 2017 18 Full Colour 22.24 44.49 111.22 150.15 200.20
Grey Scale 22.24 44.49 111.22 144.59 200.20
Topo Maps 16.69 33.37 83.42 111.22 150.15
Line / Hatch 11.13 33.37 55.62 72.30 100.10 Maps GIS tariffs
1.4.1.1 Tender Documents Municipal Produced R177.50 Consultants produced depending
on the project
R355 and R414.20 respectively
• Clearance certificate R 404.70
Table 7 Comparison between current tariffs and increases 1.4.2 Overall impact of tariff increases on households
The table above reflects the overall expected impact of the tariff increases on a large and small household, as well as an indigent household receiving free basic services.
Description 2016/17 2017/18 % Incr.
1. Tariff for accessibility to water ( basic charge occupied and unoccupied)
R66.96/ month
R71.25 month
6 .4 2. Tariff for accessibility to
sewerage system (basic charge occupied and unoccupied)
R85.32./month R90.78./month 6 .4
3. Sewer tariff for restricted usage (un-metered)
R85.32/ month R90.78/ month 6 .4
4. Servicing sewer conservancy tanks/pits (small)
R150.75/service R160.40/service 6 .4 Servicing sewer conservancy
tanks/pits (large)
R323.07 / 5000l/ load
R343.75 / 5000l/ load
6 .4 Discharge of sewage to waste
water works by private sewer tankers
R0.12/litre R0.35/litre 191 Integrated Step Tariff
(Domestic Use)
5. Water tariff for water usage up to
6kl
Free/
Indigent
Free/
Indigent 6 .4 Water tariff for water usage 1 to
30kl
R9.72kl R10.34kl 6 .4 Water tariff for water usage 31kl
to 100kl
R11.26kl R11.98kl 6 .4 Water tariff for water usage
101kl to 999kl
R12.95kl R13.77kl 6 .4
1.5 OPERATING EXPENDITURE FRAMEWORK
The Municipality’s expenditure framework for the 2017/18 budget and MTREF is informed by the following:
• Balanced budget constraint (operating expenditure should not exceed operating revenue) unless there are existing uncommitted cash-backed reserves to fund any deficit,
• Funding of the budget over the medium-term as informed by Section 18 and 19 of the MFMA,
• The capital programmes aligned to the asset renewal strategy and backlog eradication plan,
• Operational gains and efficiencies will be directed to funding the capital budget and other core services, and
• Strict adherence to the principle of no project plan no budget. If there is no business plan no funding allocation can be made.
The following table is a high level summary of the2017/18 budget and MTREF (classified per main type of operating expenditure):
MAY 2017 20 Table 9 Summary of operating expenditure by standard classification item A4
Description 2013/14 2014/15 2015/16
R thousand Audited
Outcome
Audited Outcome
Audited Outcome
Original Budget
Adjusted Budget
Full Year Forecast
Pre-audit outcome
Budget Year 2017/18
Budget Year +1 2018/19
Budget Year +2 2019/20 Expenditure By Type
Employee related costs 124,823 152,520 198,647 195,150 224,481 224,481 224,481 241,092 254,834 269,110 Remuneration of councillors 4,775 5,842 6,381 6,552 6,552 6,552 6,552 6,454 6,841 7,252 Debt impairment 16,028 90,109 92,787 36,460 71,800 71,800 71,800 76,395 80,749 85,271 Depreciation & asset impairment 38,999 45,537 49,197 57,676 57,676 57,676 57,676 53,137 56,165 59,311 Finance charges 2,549 2,465 1,125 – 313 331 349 Bulk purchases 7,232 6,169 7,692 5,901 5,901 5,901 5,901 6,255 6,611 6,982 Other materials 23,758 34,497 28,822 44,506 47,974 47,974 47,974 40,322 42,622 45,010 Contracted services 48,715 39,499 65,268 37,412 46,775 46,775 46,775 40,611 41,681 44,043 Transfers and grants 83,732 – – 10,512 25,000 25,000 25,000 26,600 28,116 29,691 Other expenditure 101,783 188,477 231,660 154,188 105,400 105,400 105,400 108,232 111,735 123,067 Loss on disposal of PPE 5,421 2,464 1,232 –
Total Expenditure 457,814 567,581 682,812 548,356 591,558 591,558 591,558 599,410 629,686 670,086 Current Year 2016/17 2017/18 Medium Term Revenue &
Expenditure Framework
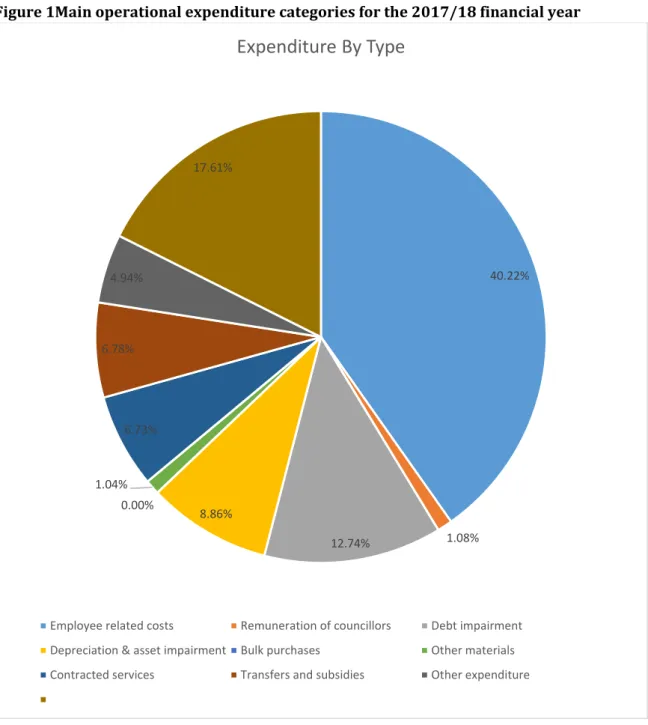
Figure 1Main operational expenditure categories for the 2017/18 financial year
The budgeted allocation for employee related costs for the 2017/18 financial year totals R241 million, which equals 40 % of the total operating expenditure. Based on the three year collective SALGBC agreement which took effect on the 1st of July 2015, salary increases have been factored into this budget at a percentage increase of 7.4% for the 2017/18 financial year.
Expenditure against overtime was significantly reduced as prescribed by treasury, with provisions against this budget item only being provided for emergency services and other critical functions. Further reductions will be necessary as the percentage of employee related costs is
40.22%
1.08%
12.74%
8.86%
0.00%
1.04%
6.73%
6.78%
4.94%
17.61%
Expenditure By Type
Employee related costs Remuneration of councillors Debt impairment Depreciation & asset impairment Bulk purchases Other materials Contracted services Transfers and subsidies Other expenditure
MAY 2017 22 now above the threshold of 38% this is due to the drastic reduction in total operating expenditure.
The cost associated with the remuneration of councillors is determined by the Minister of Cooperative Governance and Traditional Affairs in accordance with the Remuneration of Public Office Bearers Act, 1998 (Act 20 of 1998).The most recent proclamation in this regard has been taken into account in compiling the Municipality’s budget.
While debt impairment is considered to be a non-cash flow item, it informed the total cost associated with rendering the services of the municipality, as well as the municipality’s
realistically anticipated revenues. The municipality has thus provided for debt impairment to the value of R76.3 million.
Provision for depreciation and asset impairment has been informed by the Municipality’s Asset Management Policy. Depreciation is widely considered a proxy for the measurement of the rate asset consumption. Budget appropriations in this regard total R53 million for the 2017/18 financial and equates to 9% of the total operating expenditure.
Bulk purchases are directly informed by the purchase of water from DWA. The annual price increases have been factored into the budget appropriations and directly inform the revenue provisions. The expenditure includes distribution losses. Bulk purchases amount to 1% of the total operating budget.
Other materials comprise of amongst others the purchase of materials for maintenance, cleaning materials and chemicals. In line with the Municipality’s repairs and maintenance plan this group of expenditure has been prioritised to ensure sustainability of the Municipality’s infrastructure. For 2017/18 the appropriation against this group of expenditure has decreased R46 million due to budget constraints.
The process of identifying further cost efficiencies will continue in the 2017/18 financial year to identify alternative practices and procedures, including building in-house capacity for certain activities that are currently being contracted out. The outcome of this exercise will be factored into the next budget cycle and it is envisaged that additional cost savings will be implemented.
Other expenditure comprises of various line items relating to the daily operations of the municipality. This group of expenditure has also been identified as an area in which cost savings and efficiencies can be achieved. It can be noted that other expenditure has been significantly decreased.
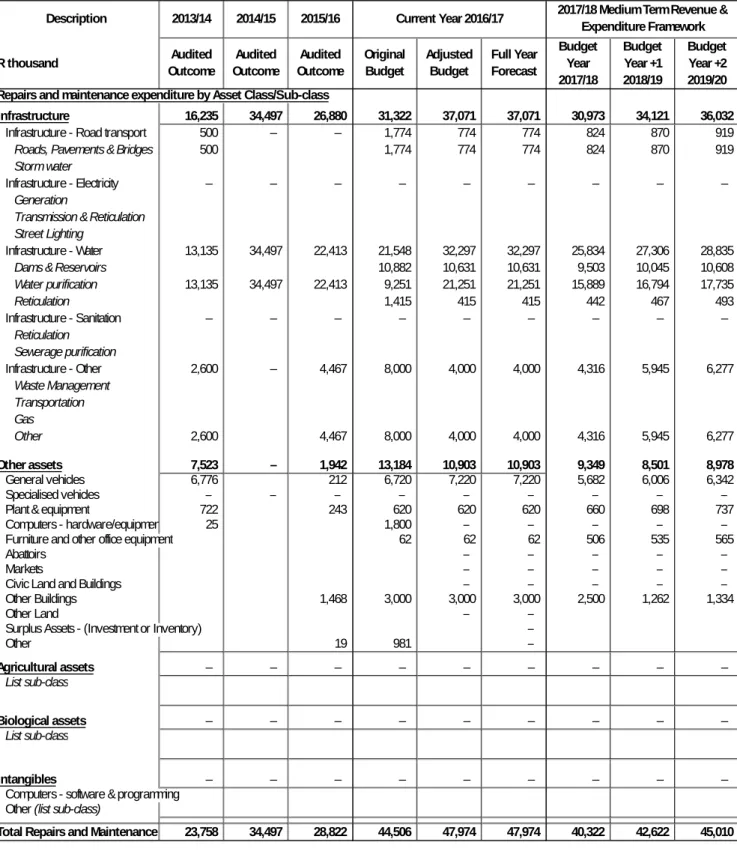
1.5.1 Priority given to repairs and maintenance
Aligned to the priority being given to preserving and maintaining the Municipality’s current infrastructure, the 2017/18 budget provides for in the area of asset maintenance, as informed by the asset renewal strategy and repairs and maintenance plan of the Municipality.
The following table lists the total anticipated cost for repairs and maintenance on infrastructure and assets for the year 2017/18 and the comparison years. It must be noted that the municipality has identified all the shortcomings associated with neglecting capital assets such as infrastructure thus the increased provision for repairing and maintenance of capital assets.
MAY 2017 24 Table 11 Repairs and maintenance per asset class SA34c
Table 12 Repairs and maintenance per asset class
Description 2013/14 2014/15 2015/16
R thousand Audited
Outcome
Audited Outcome
Audited Outcome
Original Budget
Adjusted Budget
Full Year Forecast
Budget Year 2017/18
Budget Year +1 2018/19
Budget Year +2 2019/20 Repairs and maintenance expenditure by Asset Class/Sub-class
Infrastructure 16,235 34,497 26,880 31,322 37,071 37,071 30,973 34,121 36,032 Infrastructure - Road transport 500 – – 1,774 774 774 824 870 919 Roads, Pavements & Bridges 500 1,774 774 774 824 870 919 Storm water
Infrastructure - Electricity – – – – – – – – – Generation
Transmission & Reticulation Street Lighting
Infrastructure - Water 13,135 34,497 22,413 21,548 32,297 32,297 25,834 27,306 28,835 Dams & Reservoirs 10,882 10,631 10,631 9,503 10,045 10,608 Water purification 13,135 34,497 22,413 9,251 21,251 21,251 15,889 16,794 17,735 Reticulation 1,415 415 415 442 467 493 Infrastructure - Sanitation – – – – – – – – –
Reticulation Sewerage purification
Infrastructure - Other 2,600 – 4,467 8,000 4,000 4,000 4,316 5,945 6,277 Waste Management
Transportation Gas
Other 2,600 4,467 8,000 4,000 4,000 4,316 5,945 6,277 Other assets 7,523 – 1,942 13,184 10,903 10,903 9,349 8,501 8,978 General vehicles 6,776 212 6,720 7,220 7,220 5,682 6,006 6,342 Specialised vehicles – – – – – – – – – Plant & equipment 722 243 620 620 620 660 698 737 Computers - hardware/equipmen 25 1,800 – – – – – Furniture and other office equipment 62 62 62 506 535 565
Abattoirs – – – – –
Markets – – – – –
Civic Land and Buildings – – – – –
Other Buildings 1,468 3,000 3,000 3,000 2,500 1,262 1,334
Other Land – –
Surplus Assets - (Investment or Inventory) –
Other 19 981 –
Agricultural assets – – – – – – – – – List sub-class
Biological assets – – – – – – – – – List sub-class
Intangibles – – – – – – – – – Computers - software & programming
Other (list sub-class)
Total Repairs and Maintenance 23,758 34,497 28,822 44,506 47,974 47,974 40,322 42,622 45,010 Current Year 2016/17 2017/18 Medium Term Revenue &
Expenditure Framework
Description
Building & Office Repairs 2,500,000
Maint Office Furniture & Equipment 506,365
Vehicle Repairs Outsourced 7,098,007
Repairs Specialised Equipment. 150,000
Blue Drop- Green Drop 4,000,000
Building/Plant 595,508
Pumps 15,000,000 Roads 280,232 Electrical 1,191,016
The table above highlights the focus areas of our repairs and maintenance budget
• R2.5 million of total repairs and maintenance will be spent on buildings.
• R15 million the municipality will be invested in the maintenance of water pumps.
• R7 million will be allocated for the mantaince of municipal vehicles. The increase is due to the increased number of vehicles acquired in the current year.
• R4 million for Blue Drop - Green Drop related expenses
• R150 thousand has also been allocated for the mantaince of other specialised office equipment such as the lift, PA system, telephones and air conditioners.
• R506 thousand for the maintenance of office furniture and equipment
MAY 2017 26 1.5.2 Free Basic Services: Basic Social Services Package
The social package assists households that are poor or face other circumstances that limit their ability to pay for services. To receive these free services the households are required to register in terms of the Municipality’s Indigent Policy. The target was to register more indigent households during the 2016/17 financial year. Tis target has been met for the 2017/2018 financial year the indigent budget has been increased to 3.8 million.
In the 2017/18 financial year it is anticipated that R26.6 million will be allocated towards the provision of free basic services.
The cost of the social package of the registered indigent households is largely financed by national government through the local government equitable share received in terms of the annual Division of Revenue Act.
Going forward it will be our priority to reduce the number of households on the indigent register through job creation and programs such as EPWP, ensuring that those that are hired are equipped with certain skills by the end of the program, for future employment.
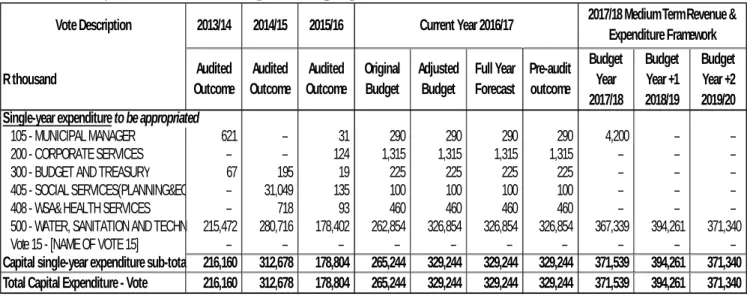
1.6 CAPITAL EXPENDITURE
The following table reflects a breakdown of budgeted capital expenditure by vote:
Table 13 2017/18 Medium‐term capital budget per vote
Due to financial constraints the capital budget is focused mainly on water infrastructure which is funded by national government grants. Council has only made a provision for the purchase of vehicles to the value of R4.2 million which will be funded from internally generated funds.
Vote Description 2013/14 2014/15 2015/16
R thousand Audited
Outcome
Audited Outcome
Audited Outcome
Original Budget
Adjusted Budget
Full Year Forecast
Pre-audit outcome
Budget Year 2017/18
Budget Year +1 2018/19
Budget Year +2 2019/20 Single-year expenditure to be appropriated
105 - MUNICIPAL MANAGER 621 – 31 290 290 290 290 4,200 – – 200 - CORPORATE SERVICES – – 124 1,315 1,315 1,315 1,315 – – – 300 - BUDGET AND TREASURY 67 195 19 225 225 225 225 – – – 405 - SOCIAL SERVICES(PLANNING&EC – 31,049 135 100 100 100 100 – – – 408 - WSA& HEALTH SERVICES – 718 93 460 460 460 460 – – – 500 - WATER, SANITATION AND TECHN 215,472 280,716 178,402 262,854 326,854 326,854 326,854 367,339 394,261 371,340 Vote 15 - [NAME OF VOTE 15] – – – – – – – – – – Capital single-year expenditure sub-tota 216,160 312,678 178,804 265,244 329,244 329,244 329,244 371,539 394,261 371,340 Total Capital Expenditure - Vote 216,160 312,678 178,804 265,244 329,244 329,244 329,244 371,539 394,261 371,340 Current Year 2016/17 2017/18 Medium Term Revenue &
Expenditure Framework
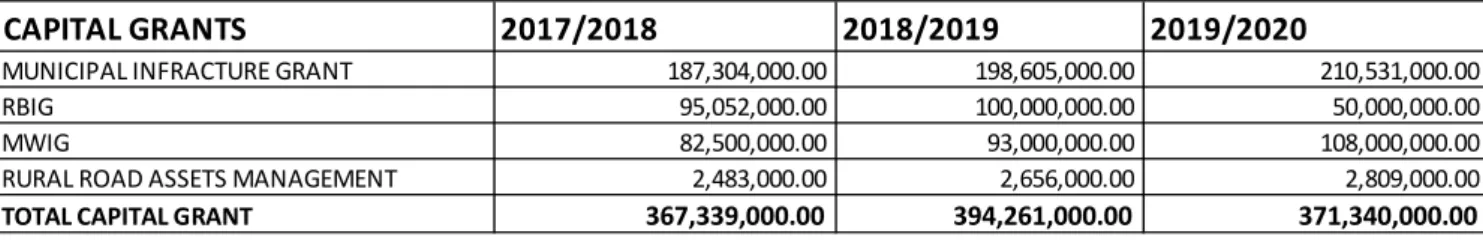
MAY 2017 28 A total of R367 million will be allocated towards water infrastructure as per the following grant allocations.
The following pie chart provides a breakdown of the capital budget to be spent on capital for the year 2017/2018.
Figure 2 Capital budget
CAPITAL GRANTS 2017/2018 2018/2019 2019/2020
MUNICIPAL INFRACTURE GRANT 187,304,000.00 198,605,000.00 210,531,000.00
RBIG 95,052,000.00 100,000,000.00 50,000,000.00
MWIG 82,500,000.00 93,000,000.00 108,000,000.00
RURAL ROAD ASSETS MANAGEMENT 2,483,000.00 2,656,000.00 2,809,000.00 TOTAL CAPITAL GRANT 367,339,000.00 394,261,000.00 371,340,000.00
CAPITAL ASSETS
water ‐ sanitation infrastructure other assets