This research is a 'case study' analysis on Flint Construction cc, which underwent a management buyout. Flint Construction cc specializes in the construction and restoration of surface and underground rail systems, the sale and purchase of track materials (rails, sleepers, etc.) and general civil engineering construction. The purpose of the study is to determine the value of Flint Construction cc using the relevant valuation techniques discussed in the literature.
Various valuation techniques are analyzed and used to determine the value of the company at the time of the acquisition. This study is a 'case study' and limited to Flint Construction cc, and therefore we cannot generalize. However, an interview was conducted to obtain data on Flint Construction cc's strengths, weaknesses, opportunities, threats, subjective risk adjustments and perceptions that were used in the valuation using PIEratios, estimation of future cash flows and the EVA method.
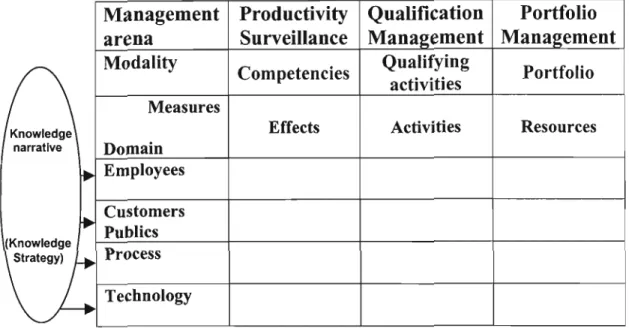
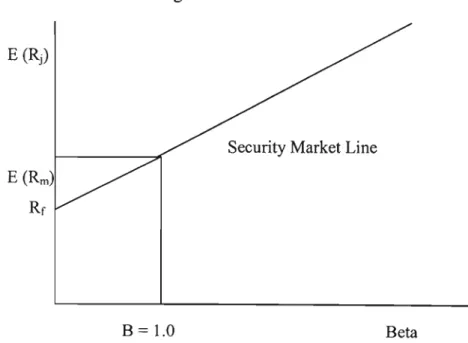
The range for Flint Construction cc obtained by different valuation methods excluding the net asset value method was R2,450,403 to R3,106,880.Source: Mouritsen et al. Figure 3: Representation of the CAPM and the Safety Market Line 59 Figure 4: Sensitivity of the value of Flint Construction cc with different 85 percentiles for risk adjustment, growth rate and valuation method.
INTRODUCTION
Objectives
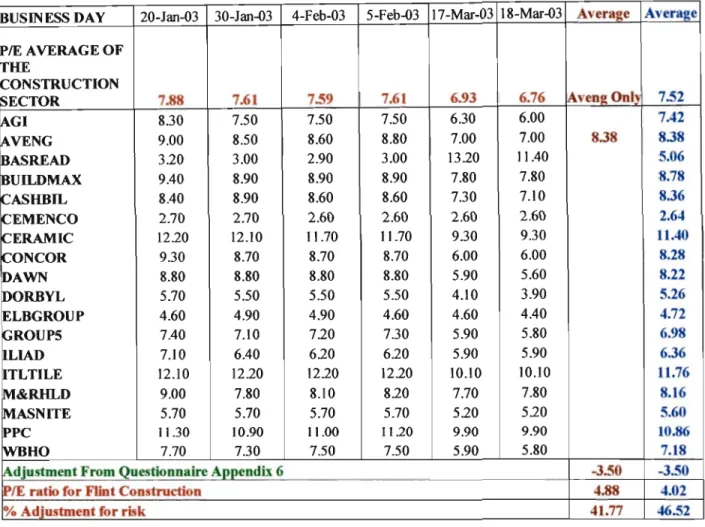
The price-to-earnings ratios will be looked at and compared to those of a listed company with similar operations, and to the average of the construction sector on the Johannesburg Stock Exchange (JSE). Economic Value-Added Model: The economic value-added model values a company by calculating the spread between the return on assets (ROA) and the opportunity cost of capital, multiplied by the capital invested in the company. This study is a case study based on Flint Construction cc and the valuation processes to determine the appropriate value of the company.
The study uses various valuation methods discussed in the literature to determine the value of the company. This chapter is an introduction to the topic and objectives, hypothesis and overall approach to the study. This chapter covers aspects of the population to be surveyed and the type and methods of data collection.
Chapter three covers a comprehensive review of management buyouts and the various valuation methods. Chapter four presents the results of the analysis of data in the form of tables, graphs, ratio analysis, the different valuation methods and comparisons with a listed company with similar activities.
Hypothesis
Benefits Of The Study
Further, the study was conducted in an unlisted company and it is difficult to obtain information, which is not publicly available. Furthermore, it would be a difficult task to find information on unlisted companies where a management buyout has occurred. A further limitation of the study is that there are difficulties in valuing the goodwill and intellectual capital of Flint Construction cc.
RESEARCH METHODOLOGY
Financial data will be collected for Flint Construction cc and a similar listed company called Aveng. Furthermore, data was collected from the annual financial statements of Flint Construction cc and Aveng and newspaper articles. Despite the theoretical literature based on perfect markets and perfect information, in the real world there are substantial differences in the valuation methods used when valuing Flint Construction cc.
The interviewer must ensure that answers given on the questionnaire are recorded accurately, especially in the case of a one-to-one interview. In Flint Construction cc we want to be able to predict future cash flows and the PIE ratio. Cooper & Schindler (2001) suggest that any measure should be assessed in terms of relevance, freedom from bias, reliability and availability.
To be reliable, the questionnaire should avoid factors that are highly likely to be variable. In this case study, the questionnaire meets these criteria because only one person, Mr. K.G.
LITERATURE REVIEW
Risk Free Rate (Rr)
34; In deriving the CAPM it is necessary to consider an asset whose returns have zero variance and zero covariance with any other asset - i.e. Because of this evidence and the fact that central bank activity precludes a free market rate, many practitioners suggest using a long-term government bond rate or a high-quality industrial bond rate as a proxy for the risk-free rate. . However, for the above reasons and because it is a capital market instrument, in this study a long-term government bond was used as a proxy for the risk-free rate (Rr).
Harrington (1983) noted that many studies assume that the past is an adequate reflection of the expected market premium by investors and that in order to find a way to estimate Rm, it is important to address the method of calculation, the length of the investment period. past used and representative used for. 34; For the South African user, perhaps the best rule of thumb that can be given is to use Treasury bills to estimate the risk-free rate (making an adjustment, where deemed appropriate, for expected changes in inflation) and a value of the order of 9% for the market risk premium" (Firer. The future cannot be predicted, so it is difficult to get an estimate of the possible co-movements of the returns of a stock and the market portfolio.
34;Since the development of modern portfolio theory and the consequent emergence of asset pricing models, much attention has been paid in the financial literature to accurately estimate the parameters underlying these models. Cadiz Stockbroking provides up-to-date risk measures and associated statistics of the sector indices and stocks listed on the Johannesburg Stock Exchange (JSE). The result of the sensitivity analysis is a range of values for the company or asset in question.
A sensitivity analysis will be performed using different risk-adjusted discount rates and different valuation methods, i.e. According to Krieger (1990), nowhere in business is there a greater need for buyer beware, or for that matter. on the seller's side, rather than when buying or selling a business. Buyers also out of ignorance may not (to their ultimate detriment) fully investigate vital areas of the business being acquired.
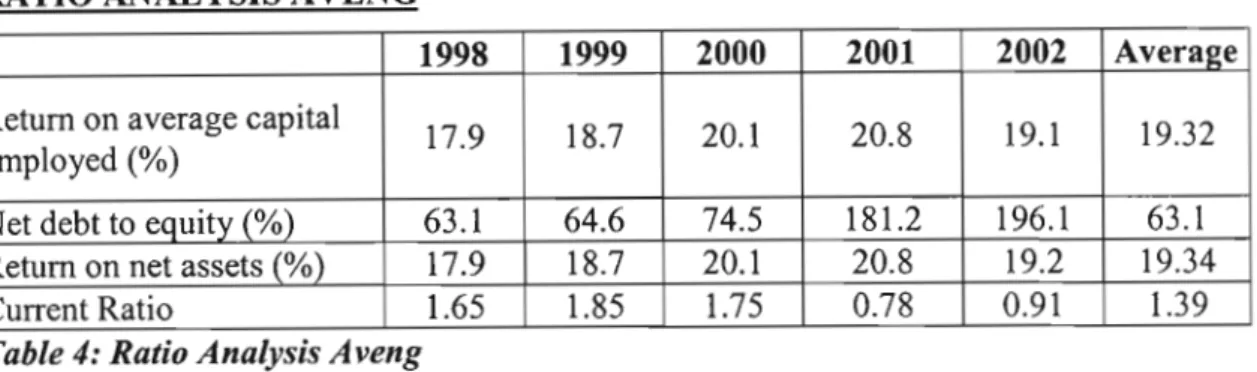
The average net debt-to-equity ratio for the past five years for Flint Construction cc was 875.23%. The current ratio tells us how well the assets of the company cover the liabilities of the firm. In the valuation of the NAV, the factors of goodwill and intellectual capital were not valued or added.
ACTUAL
Cost of Equity (CAPM)
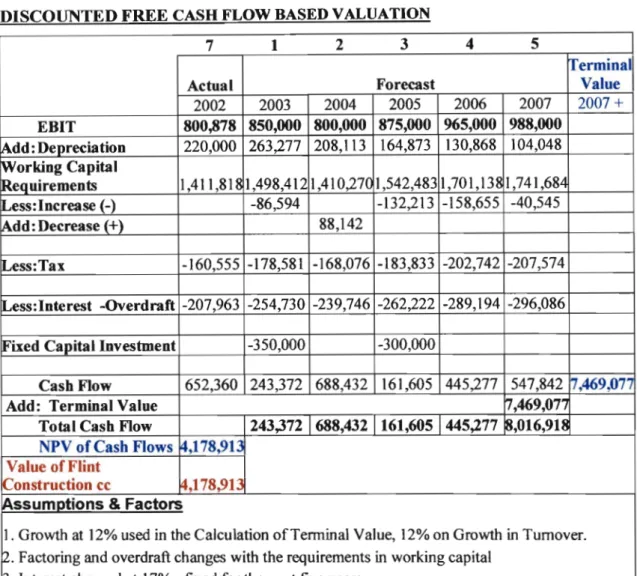
The CAPM derived cost of equity is shown in Table 15 and is calculated to be 20.21% for Flint Construction cc. Free cash flow discounting was used to determine the net present value of the company. On the other hand, inflation is expected to be 7.70% (CPIX) (http://resbank.co.za), so real growth for Flint Construction cc would be around 4.40%.
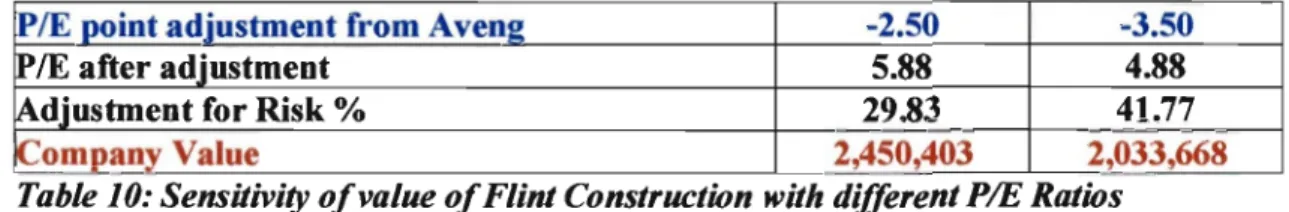
The reason for calculating historical EVA is to see if the business has delivered value to the owner in the past, before looking to the future. Table 17 shows that the WACC for Flint Construction cc was 5.84% lower than the return on capital. So for the year 2002, the company succeeded in creating value for the shareholder or owner. Table 20 shows that as the adjustment for risk increases, the value of the company decreases.
The effect of growth on the DFCF method of valuation can be seen in Figure 4 on the next page, where as the company's growth rate increases, so does the value of the company by the Keremaining constant. Construction cc based on the calculations and various methods presented herein, should be between R2, 450,403 and R3, 106,880. Figure 4: Sensitivity of the value of Flint Construction cc with the different percentages of risk adjustment, growth rates (in terminal value) and Keand Valuation.
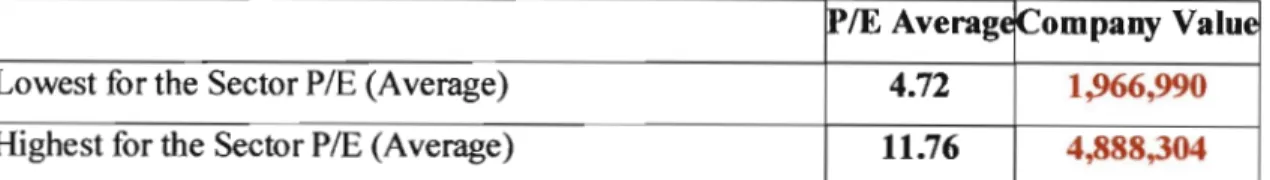
As the rent increases from 15% to 25%, assuming the adjustment for risk and constant growth rates for terminal value calculations, the value of the business decreases. The PIE ratio method uses the average PIE ratio for Aveng and the value of Flint Construction cc derived from this method is R2,450,403. By discounting (to a value of 29.83%) the value of Flint Construction cc obtained by the DFCF method with a constant growth rate of 12% in the calculation of the terminal value and to an aKe of 2021% (the cost of equity derived from the CAPM ) the value of Flint Construction cc is R2,932,220. shows a value of Flint Construction cc of R3, 106,880.
The range for Flint Construction cc obtained using different valuation methods without net asset value method was R to R. The average value of Flint Construction cc obtained using EVA, DFCF and PIE method was R2,829,835. Based on the theoretical literature based on perfect markets and perfect information, although there are imperfections in the real world, there is no significant difference in the valuation methods used in the valuation of Flint Construction cc.
We can conclude that Mr. K.G.Flint acquired fair value for Flint Construction cc. What do you expect the InTurnover growth rate to be for the company over the following time periods.
DEPRECIATION SCHEDULE OF FIXED ASSETS
Appendix 6: Depreciation Schedule for 2003 to 2007 for Flint Construction cc. Appendix 6-- Depreciation Schedule for 2003 to 2007 for Flint Construction cc /continued). Other income !Expect to increase at 5% of previous year's income Other expenses Costs increase at 9%. Work in progress is calculated on the expected work to be completed at the end of each financial year.
Appendix 9: Required listing costs on the JSE (Source: http://www.;se.co.za) Listing costs. Articles of Association for a new company listed on a subsidiary, minor revision fee changes. By agreement, depending on the size and complexity of the list and the amount of work required.
Loans, Basic Earnings per Share, Shareholder Distribution, Major Shareholders, Share Incentive Schemes, Profit Forecasts, Unlisted Securities, special resolutions, Cash Issues, Director's Interests and Remuneration and Code of Corporate Practice and Conduct.