Mormopterus, Mops, Sauromys and Chaerephon) are found in mainland Africa, Arabia and the islands of the western Indian Ocean, including Madagascar (Lamb et al. 2011). A new species of Chaerephon (Molossidae) from Madagascar with notes on other members of the family.
ABSTRACT
INTRODUCTION
Strong-flying bats such as the Molossidae are expected to be panmictic over large areas (Russell et al. 2005) and therefore to show low levels of genetic structure. High levels of population substructure in mammals are often associated with segregation due to vicariance created by barriers such as rivers and mountain ranges (Avise et al. 1987).
MATERIALS AND METHODS
Fixation indices were calculated using standard methods and a non-parametric permutation approach was used to test their significance (Excoffier et al.1992). DnaSP shows a graphical representation of the observed and expected values for growing and stable populations (Rozas et al. 2003).
RESULTS
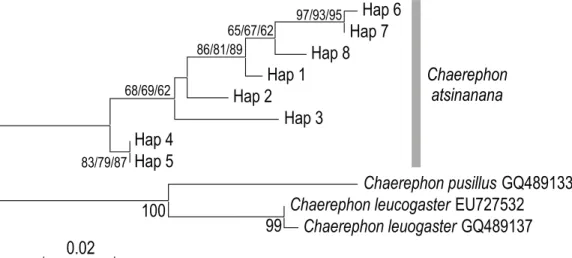
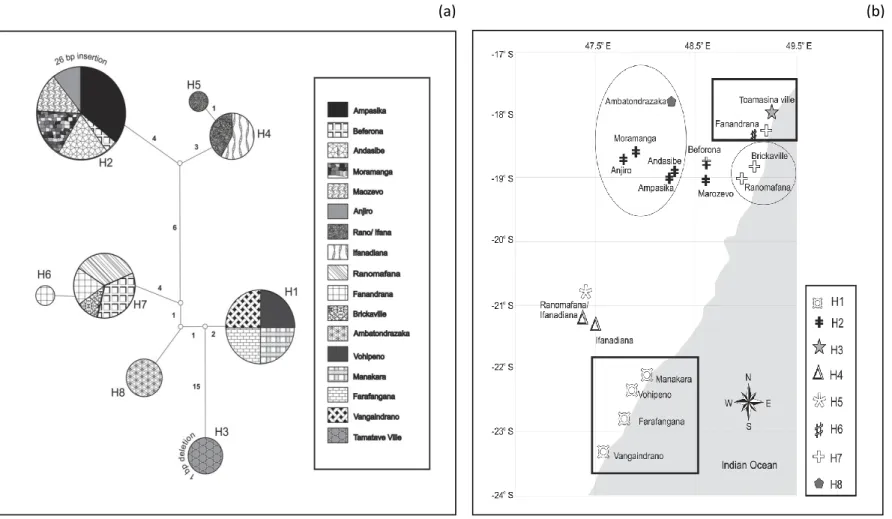
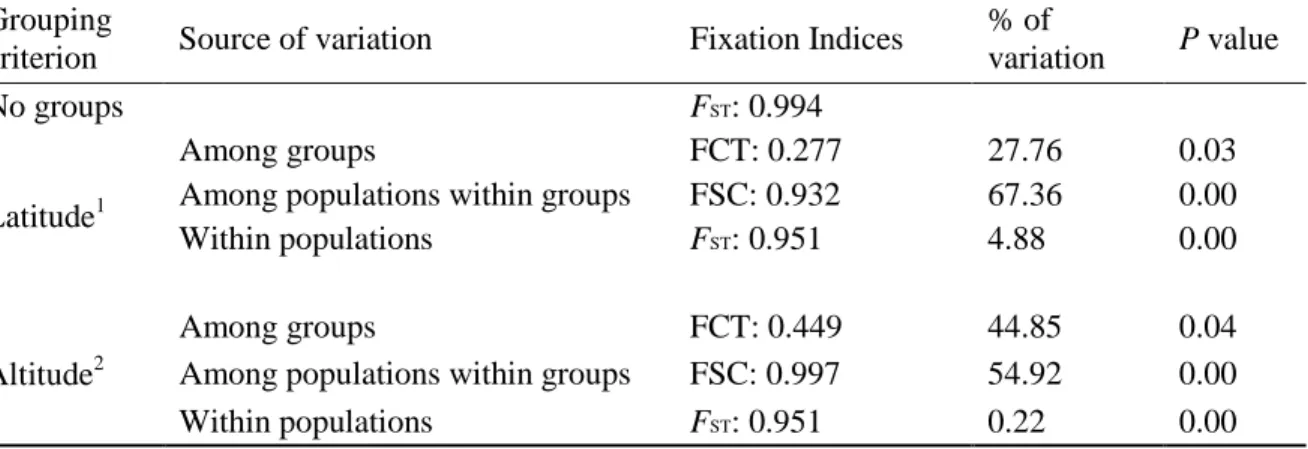
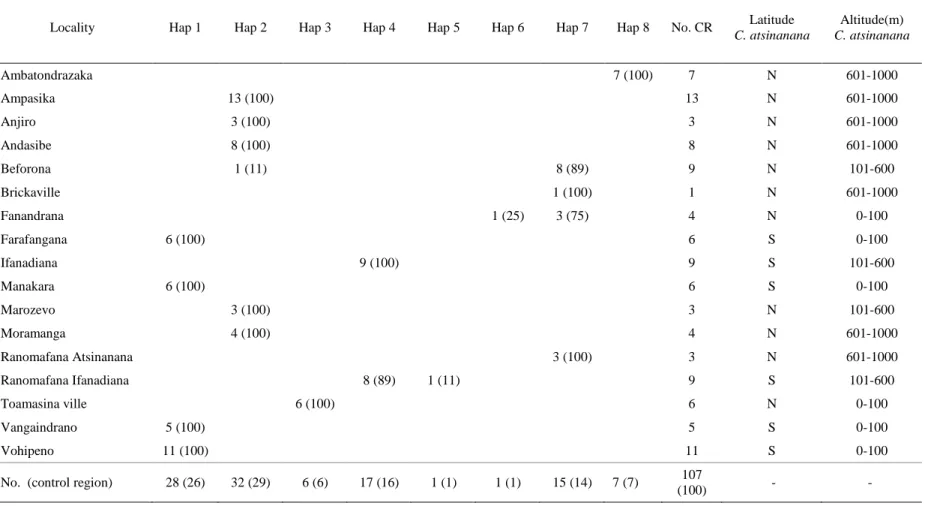
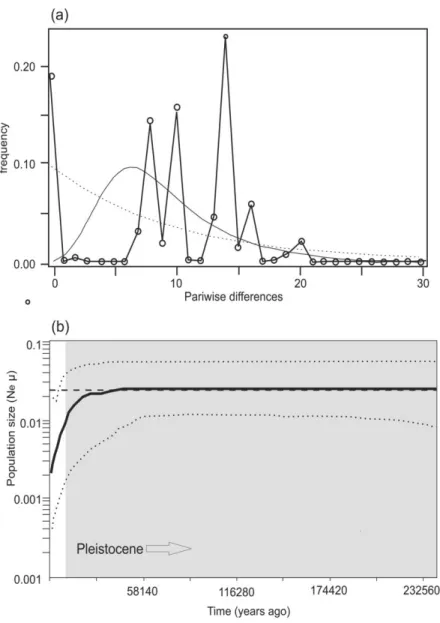
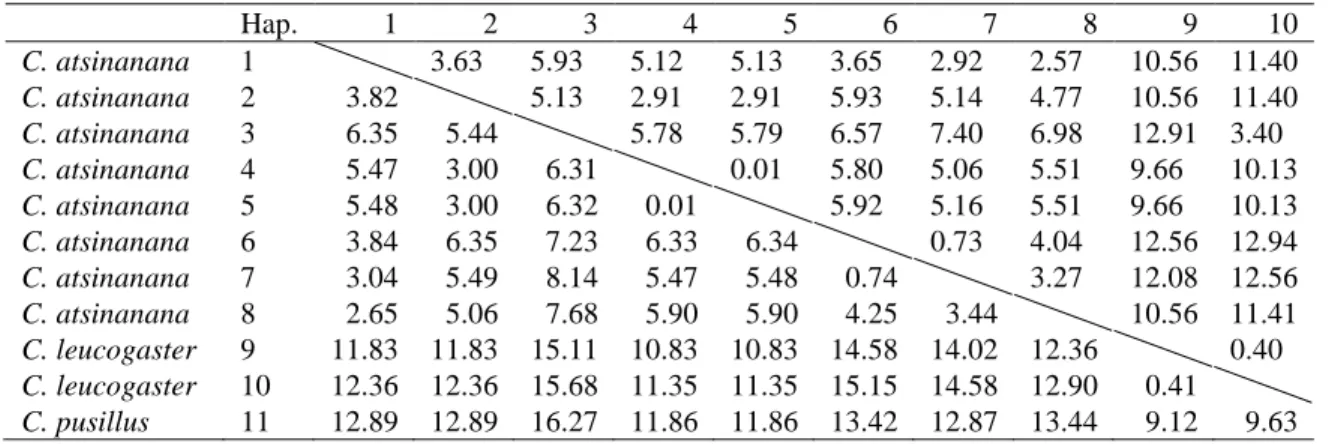
HKY+G genetic distances (below diagonal) and p-distances (above diagonal) between haplotypes of Chaerephon eastarina and outgroups, Chaerephon leucogaster and Chaerephon pusillus, based on analysis of 301 nucleotides of the mitochondrial control region. High and significant levels of structure were observed when populations were divided into latitude groups north and south of 20oS: in this case, 27.76% of the variance was between groups, 67.36% among populations within groups and 4.88% within populations (Table 2 and Fig. . 3b). There also appears to be a relatively recent decline in population size, from about 30,000 years ago to the present, although the confidence limits in this part of the plot are very wide.
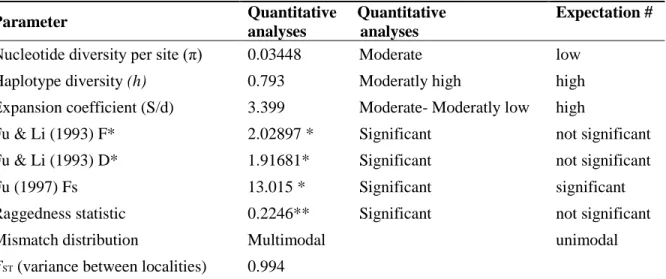
Statistics of diversity and neutrality based on analysis of the 301 nucleotides of the mitochondrial control region of Chaerephon estanirina. The dashed line is horizontal, giving an indication that population size was constant throughout most of the late Pleistocene.
DISCUSSION
Analysis of fossil pollen cores appears to indicate that greater levels of Pleistocene climate change may have occurred in the western part of Madagascar than in the east, which was relatively stable (Virah-Sawmy et al. 2009a, 2009b). Pleistocene climate cycles (Burney et al. 2004; Wilmé et al. 2006) have likely resulted in post-refugial expansion of C. In modern times, Madagascar has experienced high human population growth, and population pressure has resulted in large-scale deforestation to to create land for agricultural use and to generate timber for construction use (Harper et al. 2007).
Myotis goudoti, an endemic Malagasy bat species, shows similar genetic distances between populations (Weyeneth et al. 2011), as does the Australian ghost bat, Macroderma gigas Dobson, 1887, which showed up to 6% divergence in the control regions and 87% variance between the control regions to see. populations (Worthington-Wilmer et al. The relatively stable climate experienced by Madagascar during the Quaternary (Virah-Sawmy et al. 2009a) would have allowed the maintenance of phylogeographic structure, as this would not have been consistent with the creation of climate caused bottlenecks.
ACKNOWLEDGEMENTS
Furthermore, barriers to gene flow are unlikely to be caused by vicariance, as C. Studies on nuclear sequence markers that are biparentally inherited and also reflect a male contribution to gene flow are needed to determine the likelihood of the presence of male philopatry in C. In addition, the study of the inheritance of biparentally inherited nuclear microsatellite markers will be able to provide a more accurate picture of population structure and levels of gene flow and possible relatedness between populations.
Analysis of molecular variance inferred from metric distances between DNA haplotypes: Application to human mitochondrial DNA restriction data. Patterns of morphological and genetic variation in western Indian Ocean members of the Chaerephon 'pumilus' Chiroptera complex: Molossidae, with description of a new species from Madagascar. Morphological and molecular assessment of the specific status of Mops midas (Chiroptera: Molossidae) from Madagascar and Africa.
Estimation of historical demographic parameters from the distribution of pairwise divergences when mutation rates vary between sites: application to human mitochondrial DNA. American Society of Mammalogists Guidelines for the Use of Wild Mammals in Research.
ABSTRACT
INTRODUCTION
Rosevear (1965) proposed on morphological grounds that M. condylurus should be included in Chaerephon, in agreement with Peterson et al. 1995 ), who reported Chaerephon -like morphological traits in M. Chaerephon jobimena , differs from the well-supported Mops/Chaerephon clade proposed by Lamb et al. 2011) based on nuclear Rag 2 and Cyt b sequences, and included in a strongly supported clade with Tadarida aegyptiaca Geoffroy reports a moderate to weakly supported affinity between C. plicatus based on mitochondrial ND1 sequences. One of the initial aims of this study was to evaluate levels of population structure in C.
Of the five nuclear markers that were successfully optimized, none were sufficiently variable to study nuclear genetic structure in C . We aim to provide dates for major divergence within the Afro-Malagasian Molossidae, and to evaluate the levels of support provided by our analyzes of five nuclear gene regions for:. a) The monophyly of the Chaerephon taxa included in this study; (b) the generic status of C.
MATERIALS AND METHODS
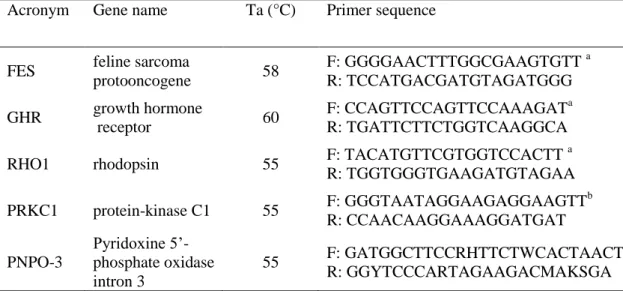
All amplified regions were introns; these include FES, GHR, RHO1 (Venta et al. 1996), PRKC1 (Matthee et al. Phylogenetic analyzes were performed separately on each of the five DNA regions and on Cyt b and Rag 2 data (retrieved from the NCBI GenBank ) The incongruence of phylogenetic signal between data sets was evaluated by determining whether there were nodes in one data set that were strongly supported (70% bootstrap support, ≥ 95% Bayesian posterior probability) that conflicted with strongly supported nodes in another (De Queiroz, 1993; Eick et al. 2005).
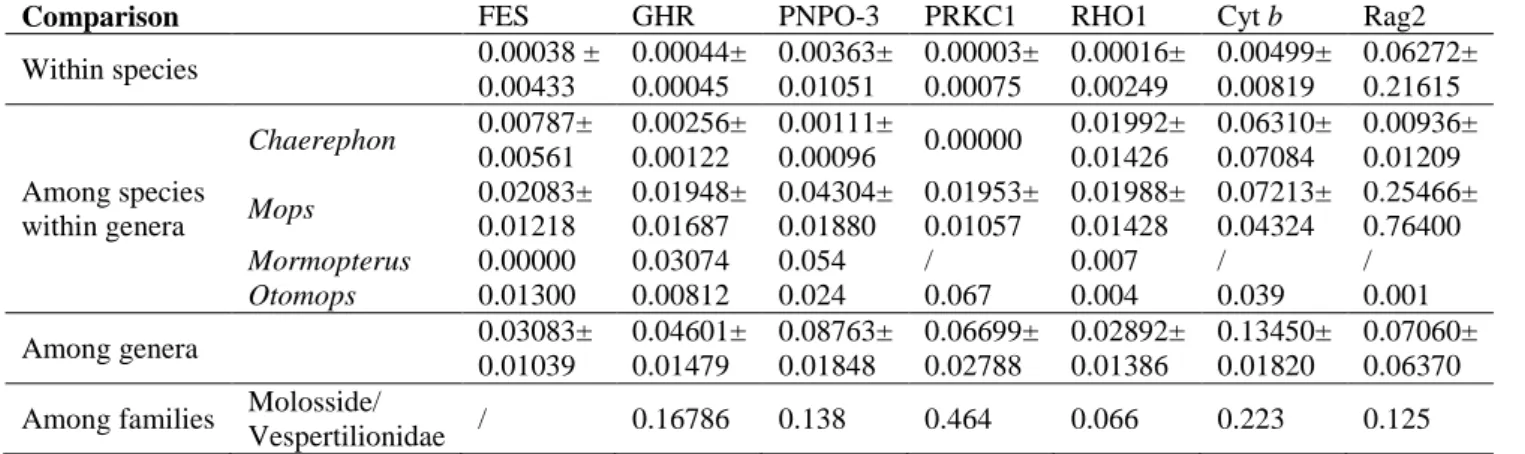
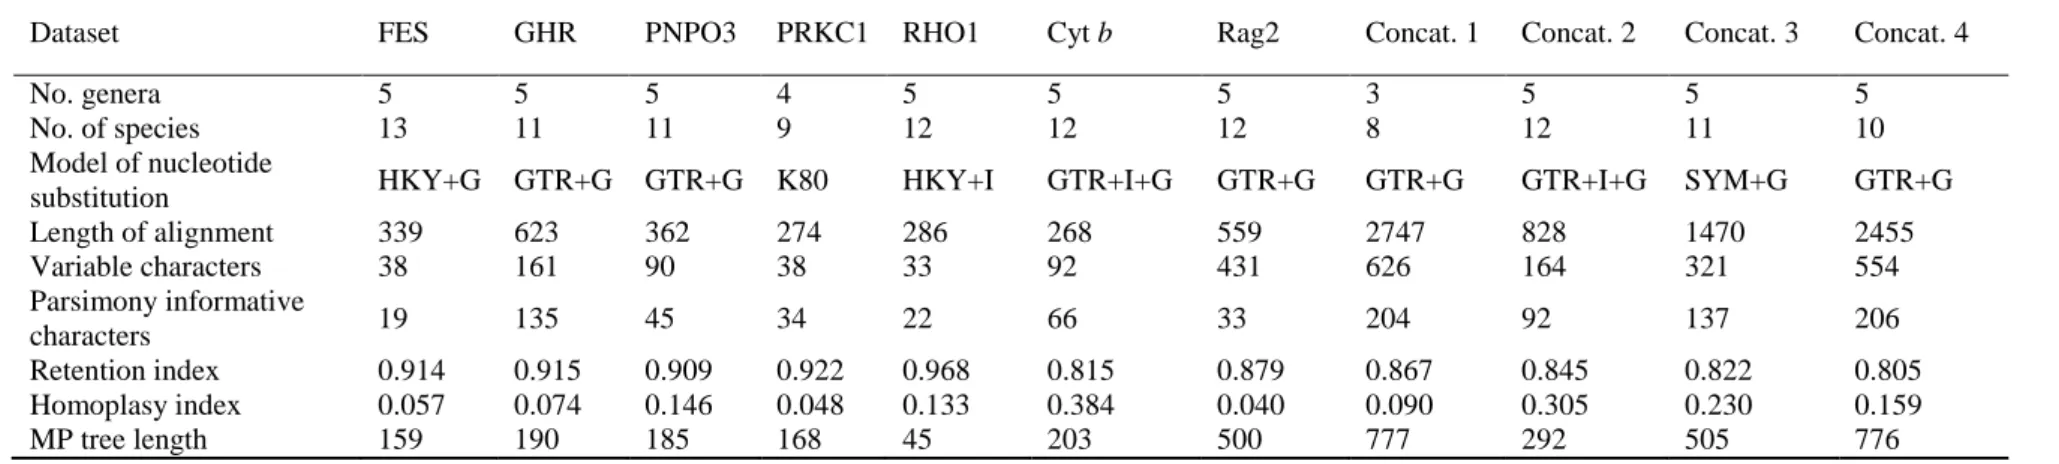
To compare the variability of the five nuclear markers used in this study, MEGA v. The data were calibrated on an estimate of 35–38 MYA for the crown divergence of the Molossidae (Jones et al. 2005).
RESULTS
Bayesian inference tree derived from the analysis of 339 nucleotides of the core FES gene region showing evolutionary relationships among Afro-Malagasy molossid bats. Bayesian inference tree inferred from analysis of 623 nucleotides of the core GHR gene region showing evolutionary relationships among Afro-Malagasy molossid bats. Bayesian inference tree derived from the analysis of 274 nucleotides of the nuclear PRKC1 gene region showing evolutionary relationships among Afro-Malagasy molossid bats.
Bayesian inference tree derived from the analysis of 286 nucleotides of the nuclear RHO1 gene showing evolutionary relationships among Afro-Malagasy molossid bats. Bayesian inference tree derived from the analysis of 2747 nucleotides of the concatenation of all 7 genes (Concatenation 1), showing evolutionary relationships among Afro-Malagasi molossid bats. Bayesian inference tree based on the analysis of 828 nucleotides of the concatenated mitochondrial Cyt b and nuclear RAG2 genes (Concatenation 2), showing evolutionary relationships among Afro-Malagasi molossid bats.
Bayesian inference tree based on the analysis of 1470 nucleotides of the concatenated Cyt b, RAG2, FES and RHO1 genes (Concatenation 3) showing evolutionary relationships among Afro-Malagasy molossid bats.
DISCUSSION
This study agrees with the results of previously published studies (Lamb et al. 2011, Ammerman et al. 2012) in finding that neither genera Mops nor Chaerephon are monophyletic and valid as currently described, whereas Mops and Chaerephon are that. Within this clade, Mops taxa tend to be basal (M. midas, M. condylurus, M. leucostigma and M. bakarii) (Lamb et al. 2011) and Chaerephon taxa (excl. C. jobimena) derived (C. estasirina, C) lecuogaster, C. pumilus s. l. and C. . pusillus). This is consistent with Lamb et al. 2011), who recovered a clade with Sauromys basal to Tadarida fulminans, and Freeman (1981) and.
The results of this study are equivocal in support for the proposed Molossid tribe, Mormopterini (Ammerman et al. 2012). Mormopterus as the basis of the Old World genera Chaerephon, Mops, Otomops, and Sauromys, consistent with its belonging to a separate tribe, the Mormopterini.
CONCLUSIONS
This indicates the need to describe a new species of Otomops from Northeast Africa and Yemen (in preparation), since the southern and western African clade includes the type locality O. PHYLOGENETIC POSITION OF Sauromys. Analysis of individual gene regions, however, weakly supports an Otomops-Sauromys-Mormopterus clade, or indicates Mormopterus either nested within or sister to the Old World molosid genus, consistent with its membership in the Old World tribe, Tadarini. There is very weak support for a relationship between S. petrophilus, Mormopterus and Otomops, although the balance of evidence suggests that Sauromys is an independent taxonomic unit within our data.
This is not inconsistent with the proposal of Ammerman et al. 2012) that Sauromys is included in Tadarida. Our analyzes suggest, but do not support, a basal position for Mormopterus relative to the Molossidae represented in this study (Chaerephon, Mops, Otomops, Sauromys), consistent with the proposal by Ammerman et al. 2012) that Mormopterus is designated as a separate tribe, Mormopterini, within the Molossidae.
ACKNOWLEDGEMENTS
We propose that Mops and Chaerephon be merged into a single genus and that membership in the genus C. On this basis, we propose that the spike from southern and western Africa retain the name O.
A review of the flat-headed bats of the family Molossidae from South America and Africa. A second aim was to complement the study of population genetic structure based on maternally inherited mitochondrial DNA by assessing relationships between C. The five nuclear markers were used in combination with already published mitochondrial Cyt b data and nuclear Rag2 ( Lamb et al. 2011) to further investigate the phylogenetic relationships among the molossid species of the Western Indian Ocean region and Southeast Africa.
This study has increased our limited knowledge of phylogenetic relationships among Afro-Malagasian members of the Molossidae by providing additional insights based on data from five nuclear sequences, one of which, PNPO-3, had not previously been used in phylogenetic studies of bats. Future research should involve examining the inheritance of biparentally inherited nuclear microsatellite markers to provide a finer picture of population structure and levels.