A STUDY OF VARIOUS PUBLIC LIGHTING
MAINTENANCE PRACTICES AND THE DEVELOPMENT ^ OF A LOCALLY APPLICABLE MAINTENANCE MODEL
IN LINE WITH INTERNATIONAL TRENDS
A Research Dissertation Presented to:
The Graduate School of Business University of Kwazulu Natal
Submitted in partial fulfilment of the requirements of the degree of:
MASTER OF BUSINESS ADMINISTRATION UNIVERSITY OF KWAZULU NATAL
Submitted by: Colin Parfitt Student Number: 201509456 Date: June 2004
Supervisor: Dr Dennis Laxton
Abstract
Public lighting is seen as a non-core function by many municipalities and therefore does not always receive the necessary management attention. As a result the provision of public lighting maintenance differs substantially between Local Authorities; in some instances public lighting is in a state of disrepair and in other instances the service delivery is excellent.
One of the major problems identified is the lack of information with regard to the number and types of fittings installed and also the number of failures that occur.
As a consequence many municipalities cannot provide accurate costs to enable comparison with other Local Authorities. There is also a general lack of consensus as to what constitutes appropriate service delivery in terms of system availability and failure response times. This results in large differences in terms of costs, which range from R11.50 to R26.60 per fitting per month and system availability, which ranges from less than 70% to better than 99%.
To establish appropriate service levels responses were obtained from the general public and two groups more directly involved with streetlight maintenance namely, public officials and street lighting experts. This data together with the evaluation of historical data collected over the last 16 months on the Benoni network allows the formulation of appropriate cycle times in order to achieve the expected service delivery in terms of system availability and response times.
A holistic literature survey is presented covering the major aspects which impact on service delivery such as the restructuring of the electricity distribution industry and local authority transformation. The aspects of energy efficiency and equipment life expectancy are covered in detail and recommendations are made as to the appropriate replacement cycles. The different lamp replacement policies are also discussed and cost comparisons made.
Recommendations made are that a system availability of 98% is both acceptable and achievable with a moderate budget. Response times of less than 24 hours would be ideal but this does not optimise the utilisation of resources, budget constraints may dictate a longer response time. Response times of more than 5 days would generally be unacceptable. Optimal fitting replacement age is between 19 and 23 years. Under normal circumstances the introduction of energy efficient luminaires is the most cost effective when inefficient fittings have reached their optimal replacement age. Changes in energy costs, tax concessions or cost subsidisation will however impact on the appropriate replacement strategy.
MBA Dissertation CWParfitt-201509456
Page I
Table of Contents
1 INTRODUCTION 1
1.1 PROBLEM STATEMENT 1
1.2 BACKGROUND INFORMATION 2 1.3 RESEARCH OBJECTIVES 5 1.4 IMPORTANCE AND BENEFITS OF THE STUDY 6
1.4.1 Intangible benefits 6 1.4.2 Cost Benefits 6 1.4.3 Environmental Benefits 7
1.5 RESEARCH METHODOLOGY 7
1.5.1 Samples and Sample Technique 8 1.5.2 Current and Expected levels of service delivery 8
1.5.2.1 Physical Audit 8 1.5.2.2 Questionnaires 9
1.6 DATA ANALYSIS 10 1.7 QUALIFICATIONS OF RESEARCHER 10
2 BACKGROUND INFORMATION AND LITERATURE REVIEW 11
2.1 INTRODUCTION 11 2.2 THE BENEFITS OF GOOD STREET AND AREA LIGHTING 11
2.2.1 Accident prevention 11 2.2.2 Crime and Vandalism 12 2.2.3 Provision of lighting by Local Authorities 16
2.3 STREET LIGHTING DESIGN CONSIDERATIONS 17
2.3.1 Components of a streetlight installation 17 2.3.1.1 Types of Faults associated with Street lighting 19
2.3.2 Ideal Design and Practical Reality 20 2.3.3 The Issue of Efficiency and the Environment 23
2.3.3.1 Efficiency an International Perspective 23
2.3.3.2 SA Perspective 26 2.3.3.3 Lamp Efficiency 29 2.3.4 Mercury and the Environment 33
MBA Dissertation C.WParfitt-201509456
Page i
2.3.5 Cost Drivers in a Streetlight Installation 35 2.3.5.1 Lamp Life and Lamp Lumen Depreciation 36
2.4 STATUS OF THE EXISTING NETWORKS 41
2.4.1 Standard of Maintenance Personnel and Safety Aspects 44
2.5 INDUSTRY INSTABILITY 46
2.5.1 Municipal Restructuring 46 2.5.2 The Restructuring of the Electricity Distribution Industry 49
2.6 OUTSOURCING AND PUBLIC-PRIVATE PARTNERSHIPS 52
2.7 SUMMARY 55
3 RESEARCH METHODOLOGY 57
3.1 INTRODUCTION 57 3.2 SAMPLES AND SAMPLE TECHNIQUE 58
3.2.1 Current and Expected levels of service delivery 58
3.2.1.1 Physical Audit 58 3.2.1.2 Questionnaires 59
3.3 DATA ANALYSIS 61
3.3.1 Hypotheses 62 3.3.1.1 Hypothesis 1 - H0] 62
3.3.1.2 Hypothesis 2 - H02 62 3.3.1.3 Hypothesis 3 - H03 63 3.3.1.4 Hypothesis 4 - H04 63 3.3.1.5 Hypothesis 5 - H05 64 3.3.1.6 Hypothesis 6 - H06 64
3.4 SUMMARY 65
4 RESULTS AND FINDINGS 66
4.1 INTRODUCTION 66 4.2 AWARENESS AND FAULT REPORTING 67
4.3 EXPECTATIONS OF SERVICE LEVELS 71 4.4 PHYSICAL SURVEY RESULTS 75
4.4.1 Tshwane 76 4.4.2 Johannesburg 77 4.4.3 Ekurhuleni 78
MBA Dissertation C.WParfitt- 201509456
Page ii
4.4.4 Other Areas 79
4.5 COMPARISON OF PHYSICAL SURVEY WITH PERCEIVED DELIVERY 80
4.6 MAINTENANCE PRACTICES 81
4.6.1 Network Information 81 4.6.1.1 Number of Phoned in complaints received 81
4.6.1.2 Total number of faults attended 82 4.6.1.3 Quantity of different types of faults 82 4.6.1.4 Reconciliation of faults and Materials 83
4.6.1.5 Quantities of Fittings 83 4.6.2 Determination of Budgets for Streetlight maintenance 84
4.6.3 Maintenance Practices 85 4.6.4 Rating of Performance 87 4.6.5 Performance Limiting Factors 89
4.7 REGIONAL ELECTRICITY DISTRIBUTORS 90 4.8 BULK REPLACEMENT STRATEGY 92
4.9 OUTSOURCING 92 4.10 COMPARATIVE COSTS 93 4.11 ADDITIONAL PRIMARY DATA 95
4.11.1 Monthly Failures 96 4.11.2 Comparison of Failures between Network Types 97
4.11.3 Comparison of Faults attended by Type 99 4.11.4 The Problem of Repeat Failures 100
5 APPLICATION OF INFORMATION 102
5.1 THE REPLACEMENT OF FITTINGS 102
5.1.1 Maintenance cost and Equipment Age 102
5.1.2 Energy Savings 106 5.1.3 Other Considerations 108
5.2 RE-LAMPING POLICY 109
5.2.1 Lumen Depreciation 112
6 CONCLUSIONS AND RECOMMENDATIONS 113
6.1 INTRODUCTION 113 6.2 THE FUTURE OF STREETLIGHT MAINTENANCE 113
MBA Dissertation C.WParfitt-201509456
Page iii
6.3 NETWORK INFORMATION 114
6.3.1 Budgeting and Benchmarking 114 6.3.2 On Going Record Keeping 115 6.3.3 Requirements for Corrective Work 115
6.4 BASIC POLICY FOR STREETLIGHT MAINTENANCE 116
6.4.1 System Availability 116 6.4.1.1 Public Complaints 117 6.4.2 Acceptable Response Times 117
6.4.3 Capital Upgrading 118 6.4.3.1 Regular Capital Replacement 118
6.4.3.2 Introduction of energy efficient luminaires 119
6.4.4 Re-lamping Policy 119 6.4.4.1 Mercury Vapour 119 6.4.4.2 HPS Lamps 120
6.5 ADDITIONAL GOOD PRACTICE RECOMMENDATIONS 120
7 REFERENCES 123
7.1 GENERAL REFERENCES 123 7.2 SPECIFIC REFERENCES 123
Annexures
Annexure A: Reponses to Public Questionnaire Annexure B: Questionnaire for General Public Annexure C: Questionnaire for Expert Group Annexure D: Questionnaire for Public Officials
Annexure E: Annual Equivalent Annuity Calculations for Fitting Replacement Annexure F: Life Cycle Costs and Replacement Cycle for Energy Efficient Fittings Annexure G: Bulk versus Spot Replacement Cost Comparison
Annexure H: Chi-Square Calculations for Hypothesis Testing
MBA Dissertation C.WParfitt-201509456
Page iv
List of T a b l e s
Table 2-1: Comparison of GLS and CFL efficiency 30 Table 2-2: Efficiency of Different Lamp Technologies 32
Table 4-1: Questionnaires Returned 66 Table 4-2: Public Survey Returns by Region 66
Table 4-3: Physical Survey Results for Tshwane Metropolitan Area 76 Table 4-4: Physical Survey Results for Johannesburg Metropolitan Area 77 Table 4-5: Physical Survey Results for Ekurhuleni Metropolitan Area 78 Table 4-6: Physical Survey Results for Krugersdorp and Nelson Mandela Metro Areas 79
Table 4-7: Quantities of Fault Occurrences 82 Table 4-8: Fault Quantities by Major Category 83 Table 4-9: Responses Regarding Material Reconciliation 83
Table 4-10: Fitting Quantities by Area 83 Table 4-11: Responses Regarding Budget Determination 84
Table4-12: Response regarding- Cost Comparison between areas 85
Table 4-13: Pro Activeness of Maintenance strategies 86
Table 4-14: Survey and Repair Cycles 86 Table 4-15: Operational Structure of Streetlight Maintenance 86
Table 4-16: Replacement policies for old Lamps 87 Table 4-17: Response Times to Complaints from Public 88 Table 4-18: Rating of Own Maintenance Service 89 Table 4-19: Rating of Own System Availability 89 Table 4-20: Performance Limiting Factors to effective Maintenance 89
Table 4-21: Ranking of Limiting Factors 90 Table 4-22: Streetlight Maintenance as a Core Function 91
Table 4-23: Responses to Where SLM will find itself after RED's establishment 91
Table 4-24: Responses to the use of Bulk Replacement Strategy 92 Table 4-25: Responses as to Why Bulk Replacement Policy not utilised 92
Table 4-26: Table of Costs versus System Availability 94 Table 4-27: Comparison of Underground versus Overhead Network Faults 97
Table 4-28: Analysis Network Type Faults for 70W HPS and 125W MV fittings 98
Table 4-29: Number of Faults by Major Category for Benoni 99 Table 4-30: Number of Faults by Sub-Category for Benoni 99 Table 4-31: Quantification of Total Repeat Faults - Benoni 100 Table 4-32: Quantification of Repeat Lamp Faults - Benoni 101 Table 4-33: Quantification of unnecessary Lamp Replacements 101
Table 5-1: Quantification of Faults vs. Fitting Age 103 Table 5-2: Contribution by Subcategory of Faults to Fittings of Differing Age 103
Table 5-3: Maintenance Cost by Fitting Age 104
MBA Dissertation C.WParfitt-201509456
Page v
Table 5-4: Calculation of Optimum Fitting Replacement Cycle - Age Related costs 105
Table 5-5: Life Cycle Costs of 125W MV vs. 70W HPS 107 Table 5-6: Optimum Replacement Cycle for conversion to Energy Efficient Luminaire 108
Table 5-7: Strengths and Weaknesses of Major Re-lamping Policies 110
Table 5-8: Cost Comparison of Re-lamping Policies 111
List of Figures
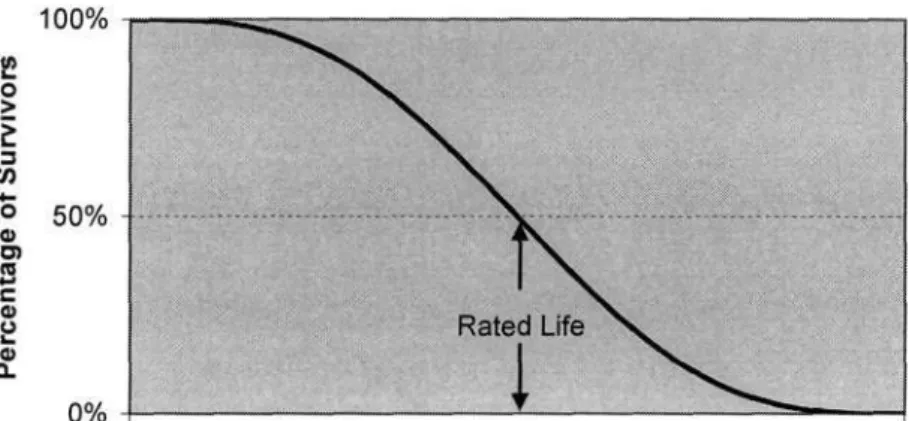
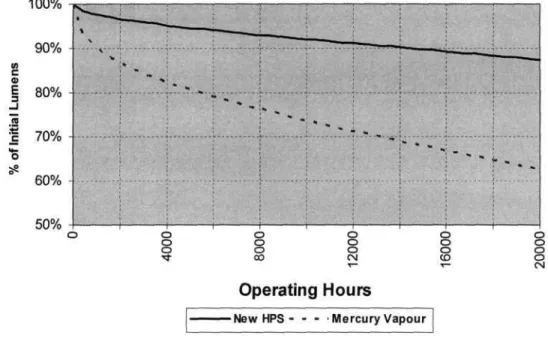
Figure 2-1: Luminaire Components 18 Figure 2-2: Typical Lamp Survival Curve 36 Figure 2-3: Typical Lumen Depreciation Curve 38 Figure 4-1: Public Awareness of Streetlights not working 67
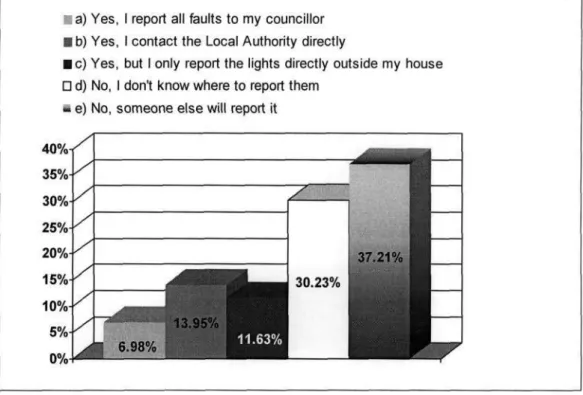
Figure 4-2: Publics Willingness to Report Failures 68 Figure 4-3: Failures Reported by Public Respondents 69
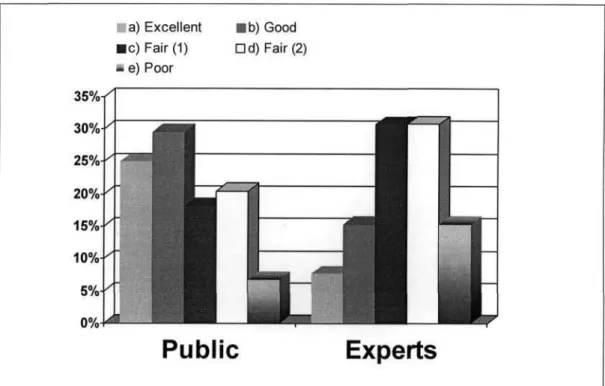
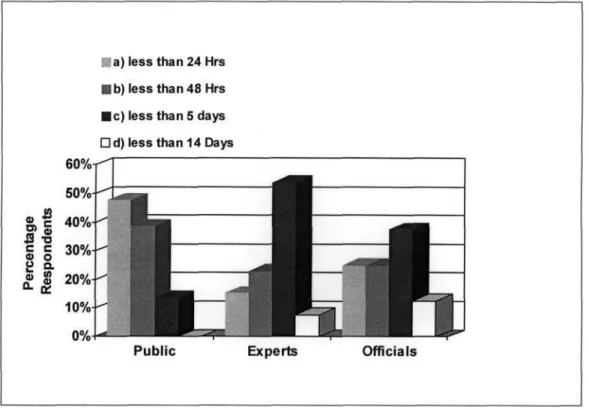
Figure 4-4: Perception of Service Provided 70 Figure 4-5: Perceived System Availability 71 Figure 4-6: Expectations of Response Times for Complaints by Public 72
Figure 4-7: Response Expectations 73 Figure 4-8: Expectations Regarding System Availability 73
Figure 4-9: Comparison of Expectations and Perceptions 75
Figure 4-10: Benoni Response times to faults 88 Figure 4-11: Costs versus System Availability 95 Figure 4-12: Number of Faults by Month - Benoni Network 97
Figure 5-1: Average Maintenance Cost vs. A g e - Benoni 104 Figure 5-2: Life Cycle Cost of 125W MV vs. 70W HPS Fitting 107
MBA Dissertation C.WParfitt-201509456
Page vi
1 Introduction
The provision of public lighting maintenance differs substantially between Local Authorities; in some instances public lighting is in a state of disrepair with as many as 30% of the fittings out of service; in other instances the service delivery is excellent with less than 1% of the fittings being out.
A major reason cited for this is that public lighting has been identified as a non- core function in many Local Authorities. As a result it has suffered under the transformation process in Local Authorities, in that it has received very little management attention. Not only are the Local Authorities (LA's) undergoing change but also the electricity distribution industry is being restructured, this has brought about major uncertainty to the industry and for a long time the 'fate' of street lighting was uncertain. It now appears to be more certain that street lighting will remain with the LA's, while the rest of the Electricity departments will be incorporated into the Regional Electricity Distributors (RED's), this will leave the LA's with no in house means to maintain their lighting networks.
Public lighting is however a social responsibility and globally it is recognised to significantly reduce vehicle accidents and also to play an important role in the reduction of crime and vandalism. Although public lighting is seen as a non-core function by many municipalities with proper management it can be provided for inexpensively and efficiently.
1.1 Problem Statement
There is a basic lack of information with regards to current levels of service, the number and type of different light fittings and material usage. Very few municipalities know how many faults are attended on a daily basis let alone how quickly complaints from the public were handled. Very few LA's have even a basic management system in place for the maintenance of public lighting.
Budgeting is problematic in these situations where no facts or figures are available to substantiate staff, equipment and stock levels. No accurate benchmarking can be accomplished without this information with the result that many LA's budgets for streetlight maintenance are inappropriate.
MBA Dissertation
CW Parfitt - 201509456 Page 1
Skills levels of maintenance staff are poor resulting in ineffective work being carried out and many tasks need to be repeated before the problem is resolved.
Public opinion which is important in establishing acceptable levels of service is in most cases not considered when planning streetlight maintenance policies.
In South Africa the majority of fittings installed utilise Mercury Vapour technology, which is not only inefficient but can easily lead to Mercury contamination if incorrectly disposed of. As South Africa is a willing participant in the field of sustainable resource utilisation, Local Authorities will be forced to review their existing policies on the use of inefficient street lighting technology.
1.2 Background information
Due to its non-core status and the moratorium on new employees, public lighting maintenance staff have been drawn into vacant positions in core areas such as network maintenance, leaving most public lighting maintenance divisions operating on a skeleton staff, this results in poor service delivery and long delays are experienced in the rectification of faults. This has further been exacerbated by the failure of most Local Authorities to finalise their organisational structures and officially appoint staff into the new structures. It is now nearly four years since the December 2000 municipal elections, and in some organisations many senior positions are still defined as 'acting'. Failure to finalise staff appointments has had very demoralising effect and has adversely affected service delivery in all sectors.
In Principal, three methods (or a combination thereof) are being utilised by Local Authorities to maintain public lighting.
• Internal resources are used
• The maintenance is outsourced to contractors, but management and quality control is still performed by the Local Authority
• The maintenance is outsourced to contractors with an independent external management structure controlling the maintenance programme
MBA Dissertation
CWParfitt-201509456 Page 2
These different methods have various levels of efficiency with vastly different cost structures.
A major problem facing many authorities is the lack of information regarding the number and type of luminaires installed, without this crucial information it is very difficult to find a suitable basis on which to compare the costs of the different methods employed. This also impacts on maintenance planning and the provision of optimum levels of stock.
Added to this, Government is committed to the restructuring of the electricity distribution industry. This will be accomplished by the formation of six Regional Electricity Distributors (Red's). To achieve this Eskom's distribution division is to be divided into six regions and combined with the Electricity Departments of all the Local Authorities (municipalities) within these regions. This effectively means that all the electrical staff and infrastructure would no longer be part of the Local Authorities, and LA's will be left with no in-house means of maintaining the public lighting network.
A number of publications are available on the establishment of the Regional Electricity Distributors, which has received a fair amount of public exposure.
The available literature includes the Price Waterhouse Coopers investigation on the restructuring of the electricity supply industry. This study was conducted in response to a call for proposals by the Department of Mines and Energy (DME) in 1998. This study has resulted in the issue of a white paper by the Government and the putting into place the interim structures to oversee the transformation.
A number of setbacks have delayed the implementation of the white paper. The majority of these obstacles have now been overcome and real progress is now being made towards the establishment of the RED's. The original programme to have the RED's in place in 2001/2002 has however been significantly revised to 2009. The amalgamation of over 300 electricity departments and Eskom's distribution division into the proposed six Regional Distributors is however a huge task and requires the commitment of several resources from already understaffed electricity departments.
MBA Dissertation
CWParfitt-201509456 Page 3
Various other articles on the Red's have been published in journals such as the, Elektron (the official magazine of the SA institute of Electrical Engineers, SAIEE) and the AMEU news (the quarterly newsletter of the Association of Municipal Electrical Undertakings), Very little literature is available however on the issue of Public Lighting in the framework of the RED's.
There are few local publications on public lighting maintenance these are however mostly by individuals or companies operating in the facilities management environment and can be seen as 'sales pitches' by these companies and are often intentionally misleading or inappropriate. Typically cost savings benefits are overstated, particularly when it comes to energy savings and bulk replacement of lamps.
There are numerous National (SABS or NRS) and International (CIE and ISO) specifications with regard to public lighting, these revolve mostly around lighting design, equipment and material standards and recommended lighting levels.
It is widely accepted that as the output of many lamps diminish drastically with time (by more than 30%), maintenance should not merely focus on defective fittings but also on keeping acceptable lighting levels. The International Commission on Illumination (CIE) publication no 33-1977, titled, "Depreciation of Installations and their Maintenance" deals with this topic but does not focus on effective maintenance practices.
There are also a number of companies and institutes such as the NEC (International Institute for Energy Conservation), the EELA (Energy Efficient Lighting Association) and in South Africa, BONESA (an Eskom initiative) which have been established to promote the use of efficient lighting sources to reduce greenhouse and other harmful gas emissions which are by-products of electricity generation. These however focus mainly on residential, industrial and office lighting, with no guidelines for cash-strapped Local Authorities on how to move towards energy efficient public lighting installations in a sustainable and financially viable manner.
MBA Dissertation
CWParfitt-201509456 Page 4
In a number of countries such as the United Kingdom tax incentives are provided to companies to promote the transition to more efficient light sources.
In SA Eskom is making some funding available for implementation of energy saving installations through its demand side management programme, however the focus is on projects that can shift load from peak consumption periods.
Public lighting although not insignificant, accounts for less than 2% of the countries power consumption and therefore has not been regarded as a priority target by Eskom's DSM division.
Extensive disagreement around the financial viability of replacing Mercury Vapour (MV) fittings with more efficient High Pressure Sodium (HPS) fittings exists in the industry, this issue will be explored in detail in the study.
Further research into secondary sources conducted as part of this study is targeted at the host of available information on the expected operating life of lamps and fittings, this will aid in the analysis of the cost effectiveness of planned maintenance (bulk replacement policy) versus fault repair (breakdown or Burn-to-Extinction policy). Evaluation of secondary data will also establish whether a capital replacement strategy will be more cost effective in the long run than maintaining older and obsolete technology.
1.3 Research Objectives
The objectives of this study are:
a) To evaluate the current levels of service in the major metropolitan areas in Gauteng.
b) To determine what levels of service will be acceptable to the public, and whether these levels can be practically achieved at reasonable cost.
c) To determine what different methods are currently being utilised by the Local Authorities to maintain public lighting and to evaluate the different methods in terms of service delivery and cost efficiency.
d) To evaluate current international trends in streetlight maintenance and to discuss the applicability of issues such as energy efficiency, global warming and hazardous materials in the South African context.
MBA Dissertation
CW Parfitt- 201509456 Page 5
e) Provide recommendations on how to achieve the service levels required through the use of historical data. These recommendations will include replacement cycles for lamps and equipment based on historical data and the use appropriate financial evaluation techniques.
1.4 Importance and benefits of the Study
The benefits of a sustainable maintenance programme for street lighting can be divided into three categories, namely: - Intangible, cost effectiveness and environmental.
1.4.1 Intangible benefits
Preliminary investigations have shown that the maintenance of public lighting is receiving less and less attention, this has led to an increasing number of irate phone calls to senior officials of Local Authorities about poor service. As public lighting is such a noticeable area of municipal services, better service delivery, will relieve the administrative burden of senior officials and allow them to concentrate on core functions, in some instances as much as 30% of phone calls to top level management concern street lighting issues. An Effective maintenance strategy can reduce these complaints by more than 65%.
Research has shown that crime and vandalism levels are reduced with the introduction of public lighting. Improved lighting has also been shown to be instrumental in the social upliftment of communities through perceived improvement of their living conditions. Improved service delivery will therefore impact directly on the general community.
1.4.2 Cost Benefits
An effective maintenance programme will reduce the overall costs of maintenance and enable the better utilisation of resources.
Where energy efficient fittings are used to replace obsolete technology operating costs will be reduced.
MBA Dissertation
CWParfitt-201509456 Page 6
1.4.3 Environmental Benefits
The use of energy efficient fittings will also reduce the emission of greenhouse gases and the consumption of natural resources. This issue was high on the agenda at the recent World Summit on Sustainable Development.
Not only will the reduction of greenhouse gases can also bring about improved environmental conditions, there are also financial benefits to LA's through the sale of Carbon Credits. These benefits are difficult to quantify in rand terms as the necessary markets for the sale of Carbon Credits must still come into full operation, these are however expected to come online during 2005.
A large percentage of lamps installed contain Mercury vapour (MV), which can contaminate the environment when incorrectly disposed of, these lamps are also inefficient when compared to other light sources. A sustainable programme of replacement of MV fittings will assist both in the reduction of Mercury contamination and green house gas emissions.
1.5 Research Methodology
Due to time and cost constraints the primary population for this study is the three major metropolitan municipalities in Gauteng (Ekurhuleni, Tshwane and Johannesburg). The study will focus in particular on the Ekurhuleni area as this area is made up of nine former cities and towns each still operating largely independently and utilising a variety of maintenance strategies. Information from the other areas has however been included where available.
Only areas with more than 5000 fittings, which have dedicated public lighting maintenance structures, were considered, as areas smaller than this are most likely to have mixed maintenance teams.
The study is a formal, ex post facto, cross-sectional study using both monitoring and interrogation/ communication methods for data collection as discussed below. The purpose of the study is mainly causal with descriptive elements and the environment is a field setting. Due to the scarcity of primary data a single source has been utilised, namely that of Benoni, the study can therefore be likened to a case study.
MBA Dissertation
CW Partitt - 201509456 Page 7
1.5.1 Samples and Sample Technique
Different samples and techniques are required to meet the objectives of the study. Secondary data sources have been used mainly to gather technical information such as lamp life and lamp efficacy, which will be used to establish optimum replacement cycles in conjunction with 'practical' service levels, determined from primary data collected.
A valuable source of primary data came from the database of a management company responsible for the maintenance of the public lighting in greater Benoni. This company has kept a detailed database of the number of different types of faults attended to with the associated costs over the last 16 months.
This information will be extracted and compared to published information from manufacturers to try and quantify the difference between laboratory generated and practical results.
1.5.2 Current and Expected levels of service delivery
A dual approach was followed to gauge the actual service levels and to compare these with public perception. This was achieved by means of a physical audit of the areas and various questionnaires. Three questionnaires were formulated one was issued to the general public, one to industry experts and one to council officials.
1.5.2.1 Physical Audit
Due to the physical size of the areas involved routes were selected which would traverse a number of different areas within the local authority. Route selections included city centres, low-income residential areas, high-income residential, industrial areas and major access routes. As the population along these routes was not known the actual sample size (number of Luminaires) could not be determined with any accuracy prior to the actual physical audit.
The purpose of the physical audit was not to determine the levels of service with any statistical accuracy but rather to gain a general impression of what the quality of maintenance was in the different regions surveyed.
MBA Dissertation
CWParfitt-201509456 Page 8
The physical survey produced ordinal data in the form of fitting 'on' or 'off' and some qualitative information such as lighting levels and general appearance to allow for categorisation of the areas.
1.5.2.2 Questionnaires
Different levels of information were gathered from the public, lighting experts and officials involved with public lighting.
a) Public Survey A convenience sample was chosen for cost and time reasons.
An original sample size of 100 was chosen with an assumed response of 50%
to provide 50 returned questionnaires. The method of distribution was mostly electronic (e-mail) but a number were personally distributed to colleagues and their friends and family. There are obvious statistical weaknesses in this approach, not least the representativeness of the sample but these were deemed to non-critical as stringent statistical evaluation is not required to meet the objectives of this study.
b) Expert Survey There are a limited number of streetlight maintenance experts in South Africa 29 questionnaires were sent electronically or by fax to the major lamp and luminaire manufacturers as well as to people who's names were obtained from the various lighting institutions (ILESA, SANCI and SALA). To supplement these questionnaires some relevant questions were posted on international websites, which had a technical lighting forum (Philips, ILE). The intention was to obtain expert opinion on the aspects posed to the general public so that a comparison could be made between the responses.
c) Public Official Survey Here again the population is limited to very specific individuals, in depth information was required on street lighting maintenance including maintenance budgets and this required access to the right person.
The questionnaire also included questions with regard to actual service delivery and whether they thought the service they were providing was sufficient. The questionnaire was sent to 15 Local Authorities predominantly in Gauteng but included Nelson Mandela Metro and Buffalo City.
MBA Dissertation
CWParfitt-201509456 Page 9
Informal discussions were also held with senior management of Ekurhuleni and Tshwane Metros in order to supplement the information received.
1.6 Data Analysis
Data analysis is mostly qualitative. Evaluation of service levels with the type of maintenance is done using visual techniques such as a bar-charts and tables. A scattergram of service level [%fittings out]) vs. cost will highlight the cost effectiveness of the various regions.
A number of hypotheses are tested using predominantly the Chi-square test.
With level of significance of 95% (a = 0.05).
Financial evaluation of the different maintenance policies is done through the use of project evaluation techniques such as Net Present Value (NPV) and Annual Equivalent Annuity (AEA).
1.7 Qualifications of Researcher
The researcher is a qualified electrical engineer with over 15 years practical experience, a substantial portion of which being in a management role. He is a registered professional engineer whose company is a member of the South African Association of Consulting Engineers (SAACE). In his capacity as director he has consulted on numerous public lighting issues ranging from appropriate technology to optimum design levels and equipment specifications.
MBA Dissertation
C.WParfitt- 201509456 Page 10
2 Background Information and Literature Review
2.1 Introduction
This research dissertation covers a number of different aspects ranging from technical lighting aspects and maintenance practices to financial issues and evaluation of these practices.
For completeness this chapter presents the major aspects that influence street lighting and the maintenance thereof in South Africa. New literature is presented to support/dispute existing practices where available. Technical terms are presented in lay-mans terms to aid the comprehension of non-technical readers.
The effectiveness of public lighting maintenance is primarily dependant on the technology utilised and the application of business management principles.
However as public lighting is a 'social' infrastructure, provided by local government, it is often the broader political and economic conditions that dictate the resources that are made available for provision and maintenance thereof.
The information presented in this section is therefore very broad in nature in an effort to provide a full overview of the industry.
2.2 The Benefits of Good Street and Area lighting
The SABS Recommended Practice ARP 035:2002, Guidelines for the installation of maintenance of street lighting, opens with the following statement;
"Because of the ever-increasing density of traffic on our roads and the resultant rise in traffic hazards, the lighting of our streets plays a vital role in road safety. It promotes better traffic flow, it improves the appearance of city centres and residential areas and it is a major deterrent to crime and vandalism."
2.2.1 Accident prevention
"Statistics obtained from extensive research overseas over the period 1970 to 1990 show that road accidents at night are disproportionately high in number and severity compared with road accidents during daylight According to research, if street lighting to national standards (i.e. SABS 098) is
MBA Dissertation
C W Parfitt - 201509456 Page 11
installed, the following benefits can be expected for urban areas:
• Fatal accidents reduced by : 48%
• Casualty accidents reduced by : 34%
• All accidents reduced by : 43%
• Pedestrian accidents reduced by : 42%
Because of the ever-increasing costs of accidents, the reductions that can be achieved by the installation of correctly designed lighting are of immense benefit throughout the country." 1 (SABS ARP 035:2002)
A recent article in the Benoni City Times 25th September 2003 reads as follows.
" Recently yet another fatal accident, this time a head on collision on Main Reef Road leaving three dead on the scene and a fourth three days later, highlighted the dangers of the roads between Benoni and Brakpan. AI travel the road between Benoni and Brakpan every day and on the last count there were 15 streetlights either hit by cars or totally damaged and removed' Poor and in many cases absent street lighting combined with the absence of road marking and dangerous curves are commonplace on the stretches of road combining the two towns."
This article highlights the importance of street lighting and also the proper maintenance thereof. In this case there are streetlights but those that have been damaged have not been repaired.
2.2.2 Crime and Vandalism
Much research has been done on the benefits of street lighting in combating crime and vandalism and there is a substantial amount of information available on the subject. Some extracts from more recent publications are presented here.
" Street lighting is generally accepted as a major deterrent to crime and vandalism. It also creates a feeling of security among the public
Unfortunately there are no accurate statistics available in South Africa to determine the exact effect that lighting has on crime reduction, but overseas research shows that it has a very significant effect Generally the following effects were noted:
• Burglary of dwellings and outside theft decreased by 29%
MBA Dissertation
CW Parfitt - 201509456 Page 12
• Vandalism, bike theft and vehicle crime decreased by 27%
• Street robbery, bag snatching, physical and sexual assault decreased by 61%
• Threats, insults and women sexually pestered decreased by 37%" i (SABS ARP 035:2002).
British Home Office Research Study 251- Effects of improved street lighting on crime is summarised as follows:
"Eight American evaluation studies met the criteria for inclusion in the review Their results were mixed. Four studies found that improved street
lighting was effective in reducing crime, while the other four found that it was not effective. A meta- analysis found that the eight studies, taken together, showed that improved street lighting reduced crime by 7 per cent. Why the studies produced different results was not obvious, although there was a tendency for
"effective" studies to measure both day-time and night-time crimes and for "ineffective" studies to measure only night-time crimes. However, all except one of these American evaluations date from the 1970s.
Five more recent British evaluation studies met the criteria for inclusion in the review. Key features of these studies showed that improved lighting led to decreases in crime. A meta-analysis found that these five studies showed that improved lighting reduced crime by 30 per cent. The weighted effect size in all thirteen studies was substantial: a 20 per cent decrease in experimental areas compared with control areas. Furthermore, in two studies, the financial savings from reduced crimes greatly exceeded the financial costs of the improved lighting. Since these studies did not find that night-time crimes decreased more than day-time crimes, a theory of street lighting focusing on its role in increasing community pride and informal social control may be more plausible than a theory focusing on increased surveillance and increased deterrence. The results did not contradict the theory that improved lighting was most effective in reducing crime in stable homogeneous communities.
(Home Office Research Study 251; Effects of improved street lighting on crime: a systematic review, David P. Farrington and Brandon C. Welsh Home Office Research, Development and Statistics Directorate August 2002) "
MBA Dissertation
CW Parfitt- 201509456 Page 13
The following is an extract from the British Lighting Industries Federation's annual report for 2002:
"The new Department for Transport recognises that lighting plays a very important role in preventing and deterring crime. John Spellar MP, speaking at the ASLEC luncheon in October, stated that ^improved
street lighting unquestionably plays an important role in making our local highways safer. Safer in terms of traffic usage and equally importantly, all the evidence suggests, safer through a reduction in street crime' . This has led to allocations of funding for replacement street lighting, through the PFI credit system. The effects of lighting on crime and the fear of crime are intrinsic to the Public Lighting Campaign being run by LIF's Public Lighting Section into 2003.
Up to 85% of local authority crime prevention budgets are spent on CCTV under the endorsement of government - it has become apparent that changes are needed on both a local and national level to see that lighting is appreciated for all its facets." (Lighting Industries Federation: Annual Report 2002)ii:L
The following is an extract from an article on the Institute of Lighting Engineers UK website - Better Street lighting Reduces Crime.
"Commenting on Research Studies published by the Home Office on the crime prevention effects of CCTV and lighting, the Institution of Lighting Engineers (ILE) has long argued that better lighting reduces crime.
The ILE believes that street lighting alone cannot solve the problems - but that it is a vital tool in the Government's drive to tackle crime and should be used in conjunction with other measures. This partnership approach should include CCTV, policing, neighbourhood watch schemes and other anti-crime initiatives.
The Home Office studies add impetus to the ILE argument that more funding for new and better street lighting is vital and will benefit UK citizens not only by providing them with safer lighting and better road safety but will also reduce crime.
Whilst recent crime reduction initiatives have focussed on CCTV, the ILE believes that greater investment in street lighting is imperative. This will enable the partnership approach to successfully
MBA Dissertation
C.W Parfitt - 201509456 Page 14
address crime while simultaneously providing all the other benefits that good lighting brings to our streets. These include less road traffic accidents and an improved night time environment where the public enjoy the 'feel safe - feel good factor' leading to our economy benefiting from increased night time activity.
An ILE spokesperson said 'These reports show that now, more than ever, funding for street lighting should be prioritised. Street lighting is key to preventing
crime. Whether it be by itself or in conjunction with CCTV and other measures, street lighting is the one ingredient we can't afford to ignore.'
(http://www.ile.org,uk -Institute of Lighting Engineers UK - Better Street lighting Reduces Crime)1 V
What is apparent in some recent articles is the effect due to the colour of the lighting and not only the 'quantity' of lighting. (The most energy efficient lighting technology i.e. low-pressure sodium lamps produce a very orange light which affects the way in which colours are perceived by the human eye. A tremendous amount of research is currently being conducted in the area of energy efficiency together with the improvement of colour output.)
"A new study by Urbis lighting shows that the perceived risk of crime can be reduced through the introduction of white light ... And an overwhelming 100%
of respondents preferred the whiter light to the orange light When asked if the new street lighting made it easier or harder to recognize facial features 70% thought it was easier and made pedestrians feel more comfortable when out at night "(Philips Lighting - Lamps & Gear Magazine - White light Reduces Fears)v
The latest research contained in an article by Ken Pease OBE, Professor of Criminology, Huddersfield University entitled Lighting and Crime, August 1998VI
shows that improved street lighting leads to the reduction of daylight crime as well as at night.
"Street lighting improvements, where successful, are associated with crime reductions in daytime as well as during the hours of darkness. This result is of fundamental importance. It means that the effects of lighting work through something more general than improvement in the surveillability of potential
MBA Dissertation
CW Parfitt - 201509456 Page 15
offenders at night. The most plausible reasons for this pattern concerns changes in street use, enhanced community pride and sense of area ownership. Re- analysis of data from these studies suggests that lighting effects are greater in chronically victimised areas, which is of particular importance for integration of street lighting in other schemes devised under the provisions of the Crime and Disorder Act 1998;"
Unfortunately in South Africa street lighting itself is subject to vandalism and theft. The theft of cables and conductors, which is prevalent in South Africa, can leave entire areas without lighting. In many areas streetlight poles have been cut down and networks stripped leaving some areas unsafe to pass through at night.
2.2.3 Provision of lighting by Local Authorities
The SABS Recommended Practice ARP 035:2002 was drawn up by a committee that included representatives from the AMEU (The Association of Municipal Electricity Undertakings of Southern Africa which represents the electrical interests of over 300 Local Authorities in South Africa) SANCI (South African National Committee on Illumination and ILESA (Institute of Lighting
Engineers of Southern Africa). This document represents the voice of the Local Authorities and professional lighting bodies in South Africa, the following extract details the stance of these stakeholders in street lighting.
"Street lighting is also a major contributory factor to community character and vitality.
Public street lighting is one of our most important and least expensive amenities and should be provided by all public authorities. They owe it to their ratepayers, business owners and all residents."
1 (SABS ARP 035:2002) .
The question is! Why is street lighting generally in such a poor state, is it due to lack of funds and/or resources or is it being poorly managed due to its non- core status?
The problem does however not appear to be local to SA and is apparent in the UK as well. The UK government however appears to be taking action. The
MBA Dissertation
C W Parfitt - 201509456 Page 16
following text is taken from the ILE (Institute of Lighting Engineers - UK) website.
"UK street lighting has been deteriorating for some time and the ILE continues to campaign for more funding. A survey commissioned by the ILE in 1998 revealed that almost 11% of all UK lighting columns were considered as dangerous and in need of urgent replacement. This equated to some 677,000 columns and would cost over£500 million to replace."
"MINISTER ANNOUNCES FUNDING BOOST TO MODERNISE ENGLANDS STREET LIGHTS- The Government is making £300 million available in 2003-04 to help Local Authorities modernise their street lighting, with the promise of more money to follow, the Minister for Transport, John Spellar has announced. The Government estimates that across England there is a £lbn backlog in the maintenance of street lighting, a problem that it is
determined to tackle. A survey by the Institution of Lighting Engineers estimated that 27% of street light columns were now over 30 years old." Left unchecked, that situation could lead to danger for all road users. Announcing the new funding, John Spellar said:
Our £180 billion Ten Year Plan for Transport gives the commitment to eliminate the maintenance backlog in street lighting. The new funding that I have announced today will lead to a better and safer road network for everyone." (http://www.ile.org.uk - Minister announces funding boost to modernise England's Streetlights)"1 2.3 Street lighting Design Considerations
2.3.1 Components of a streetlight installation
A basic street lighting installation consists primarily of the luminaire (or light fitting), which is normally mounted on a pole (or column). The electrical supply to the pole can be by means of underground cables, suspended overhead cable (ABC) or open overhead conductors. The electrical supply to the poles can be controlled in a variety of ways to switch the lights on at sunset and off at sunrise. Streetlights can be switched singularly or in groups by means of either a time switch or photosensitive daylight switch.
MBA Dissertation
CW Parfitt- 201509456 Page 17
The Supply network can often be dedicated to street lighting but in many instances it is an integral part of the electricity network, this is especially true in residential areas.
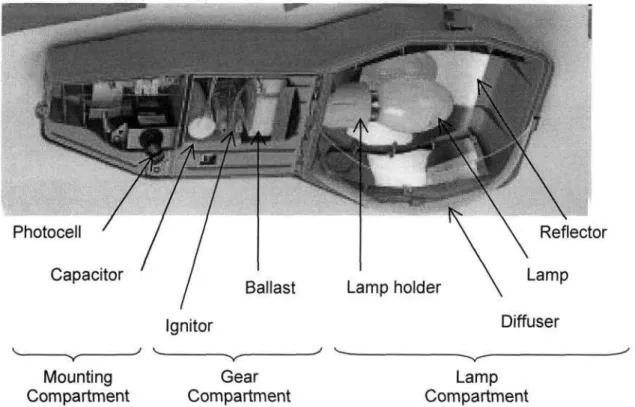
Figure 2-1: Luminaire Components
The following figure shows the main components of a Streetlight luminaire
Mounting Compartment
Gear Compartment
Lamp Compartment
• Luminaire body - usually this consists of two main compartments one to hold the control gear and one housing the lamp.
• Diffuser - A transparent outer cover, which allows light through but protects the lamp from the elements.
• Lamp - the lamp converts electrical energy into light.
• Lamp Holder.
• Ignitor - the ignitor helps to 'start' the lamp. Some lamps have an internal ignitor built into the lamp. Other lamps require a separate external ignitor.
• Ballast - the ballast is primarily there to protect the lamp from self- destruction by limiting the current (electrical energy) to the lamp.
MBA Dissertation
CWParfitt- 201509456 Page 18
• Capacitor - the capacitor 'corrects' the current used by the lamp and ballast to a more efficient form. The capacitor is not essential to the operation of the lamp but without it the installation would use excessive current resulting in additional consumption charges.
• Reflector - Used to reflect the lamp light onto the target area.
2.3.1.1 Types of Faults associated with Street lighting
A Streetlight installation can be subject to a number of different types of faults predominantly these are:
• Supply or Network faults
• System faults i.e. faults higher up in the supply system.
• Overloading - where the power drawn by the network is more than the protection system will allow which causes the protective device to operate.
• Short circuit - where a fault has occurred in the insulating material (in the case of cables or ABC), which has allowed the conductors (wires) to come into contact with each other.
• Open circuit - where one of the conductors has broken and the electrical circuit is no longer continuous.
• Lightning - A lightning strike directly to the network or in the vicinity of the network can cause any one of the above types of faults to occur and can also cause damage to the luminaire and control systems.
• Theft - This is becoming increasingly prevalent in South Africa, conductors and cables are stolen and the copper or aluminium sold as scrap.
Cable / conductor faults.
Vehicle Accidents, where poles are damaged by vehicles.
Vandalism
Switching or Control faults Luminaire faults
In terms of faults it is thought that the bare overhead conductor system is the most prone to developing faults. However, analysis of data from Benoni where
MBA Dissertation
CW Parfitt- 201509456 Page 19
approximately 30% of the streetlight network consists of bare conductor indicates that there is no clear evidence to substantiate this.
Faults on the bare conductor network are mostly visible (i.e. twisted or broken conductors can usually be seen when patrolling a line). Cable and ABC installations often require specialised fault finding equipment to locate a problem, as the fault may not be immediately visible.
The age of any network also has an influence on the number of failures one can expect. In SA some networks are in excess of 60 years old and in many cases the original luminaires are still operational.
2.3.2 Ideal Design and Practical Reality
There are many excellent technical handbooks and standards on Street lighting design available from a variety of sources. The reader can consult any of the references provided for further technical information.
Design of a street lighting installation must take into consideration many varying factors such as the "applicable speed limit, the road cross section and the maximum traffic volume during darkness" (SABS ARP 035:2002) the consideration of these factors eventually gives rise to an ideal design, with parameters such as the mounting height (pole length), luminaire spacing and arrangement, overhang and the type of luminaire (including lamp technology).
The design of a streetlight installation in South Africa is normally done in accordance with the SABS code of Practice 098:1990
• 098-1 Public Lighting Part 1 - The lighting of public thoroughfares
• 098-2 Public Lighting Part 2 - The lighting of certain specific areas of streets and highways. There are also numerous international standards, which deal with lighting design.
Considering that worldwide there are estimated to be over 1 billion streetlights installed (IAEEL 2000), it is understandable that much research and development is conducted on improving all aspects of street lighting. There is also an abundance of information available on streetlight design, luminaire design and different lamp technologies. There are many local and international
MBA Dissertation
CW Parfitt - 201509456 Page 20
bodies involved in lighting such as SANCI (South African Committee on illumination),ILESA (Institute of Lighting Engineers of Southern Africa), SALA (South African Lighting Association), LIF (Lighting Industries Federation - UK), IESNA (The Illuminating Engineering Society of North America) to name a few.
Lighting is big business and is driven by aggressive marketing amongst the major players.
In an ideal world a number of alternative designs would be considered and priced. In South Africa very often the cheapest design which meets the minimum requirements is considered, without due consideration of life cycle costs including maintenance and operation costs.
"Notwithstanding the use of some excellent specifications, it seems that the adjudication and award of tenders are still based upon initial purchase price per unit More than 80% of councils, other than metros in South Africa, buy their street lighting requirements on an ad hoc basis The successful supplier is often the one that does the best relationship marketing or the one that visits the responsible decision maker, buyer or store man on the most regular basis. Often ad hoc procurement is also done through local wholesalers." (G Kritzinger, Energy Service Companies - The solution to Tomorrow's Street Lighting Networks, paper presented to the AMEU annual congress Upington October 2002)V 1 1 1.
Very often street lighting is treated as an add-on to the electrical network and must 'fit' into the electrical network infrastructure. A large proportion of the electrical networks in our towns and cities consist of overhead installations i.e.
poles with conductors strung between them. These poles are positioned in the most convenient location to allow supplies to consumers to be tapped off, these locations are usually not ideal for street lighting, resulting in many street lighting installations being either over or under designed. In most cases poles are either too far apart or too close to each other, in some cases they are planted too far from the roads edge. Street lighting can only be optimised where it is separated from the rest of the network this usually has a substantial cost implications, which this country cannot afford.
MBA Dissertation
CW Parfitt - 201509456 Page 21
A further problem is that much of the street lighting in urban areas was installed when electrification was first provided to these areas and in many cases the street lighting has not been upgraded or refurbished in some cases for 60 years.
w The result is that most street lighting networks in South Africa can boast a range of products spanning an age from brand new to more than 30 years, and are made up of various models of products, supplied by a host of different suppliers. Many of these suppliers do not exist anymore, and the random installation of products has resulted in poor photometric performance and maintenance being an expensive nightmare. There are no considerations for life cycle costing or consequential guarantees, due to the higher perceived initial capital cost."
(G Kritzinger, Energy Service Companies - The solution to Tomorrow's Street Lighting Networks, paper presented to the AMEU annual congress Upington October 2002)i x.
With the national electrification drive much research has gone into the provision of cost effective electrical infrastructure, however little consideration has been given to how street lighting fits into this infrastructure and in many cases public lighting was excluded from the electrification process. This resulted in many cases in the installation of high-mast lighting in many urban townships. In other situations lighting has been retrofitted onto the existing network infrastructure, which as mentioned is not always ideal.
High-mast lighting is an inexpensive means to providing general low-level area lighting and in some communities is preferred to conventional lighting, as individuals don't need to provide their own security lighting. Despite its benefits high mast lighting has two major drawbacks; it cannot replace street lighting from a traffic safety point of view especially where vehicle and pedestrian densities are high and secondly it can be intrusive (high levels of light pollution).
High-mast lighting plays a large part in the public lighting provided by authorities and therefore must be properly incorporated in any maintenance strategy.
Considering that on average the capital cost of a luminaire represents only about 10% of the life cycle cost over 20 years with energy costs (45%) and maintenance and operation costs (45%) making up the bulk of the costs,
MBA Dissertation
CW Parfitt - 201509456 Page 22
surprisingly little literature is devoted to operating and maintenance. The major cost driver in streetlight maintenance is lamp replacement and lamp efficiency is the major cost driver in streetlight operating costs. With the global movement to sustainable development and environmentally friendly processes much attention is now being placed on improving the efficiency and extending the life span of lamps and luminaires. This will obviously drive the cost of maintenance and consumption down in the long term. Much of the discussion on maintenance revolves around the issue of lamp replacement cycles; however we first look at the issues surrounding efficiency.
2.3.3 The Issue of Efficiency and the Environment
A vast amount of research and development is currently being done in the area of efficiency, the major driving forces for this are;
• Cost of providing additional generation capacity
• Environmental protection.
• In SA the provision of affordable lighting.
2.3.3.1 Efficiency an International Perspective
The best available source of information on the worlds lighting power consumption is the IAEEL (The International Association for Energy Efficient Lighting) they estimate the following.*
"Globally, electric lighting accounts for more than 2000 TWh electricity and 2900 million metric tons of carbon dioxide emissions (C02) per year. The global lighting energy bill electric and fuel-based lighting combined amounts to some US$230 billion per year"
(http://195.178.164.205/IAEEL/iaeel/newsl/2000/etttva2 000/NatGlob a 1-2 00.html IAEEL newsletter 1-2/00 - Global Lighting: 1000 Power Plants)51
This is equivalent to the output of 1000 power plants according to the IAEEL who make the following estimates, predictions and statements in their newsletter 1-2/00
* The IAEEL website is no longer maintained as the project has been disbanded (due to lack of funds) however they are looking for more practical ways to revive the function provided by the IAEEL.
MBA Dissertation
C W Partitt - 201509456 Page 23
"For the industrialized countries with available data, national lighting electricity use ranges from 5%
(Belgium, Luxembourg) to 19% (Israel) of total electricity use, while in developing countries the value is as high as 86% (Tanzania).
Global lighting electricity use is distributed approximately 28% to the residential sector, 48% to the service sector, 16% to the industrial sector, and 8% to street and other lighting sectors.
...We have used a number of prior studies showing a conservative commercial sector lighting savings potential in the range of 25% to 40%. This represents a hypothetical policy pathway that includes a combination of modest standards and aggressive voluntary programs promoting cost-effective lighting efficiency improvements with today's technologies. In practice, savings will vary by country, depending on existing baseline conditions, etc.
Two billion people light their homes each day with fuel-based light sources, and in some regions this number is rising as population growth outpaces electrification.
Combining fuel and electricity used to provide lighting raises the global total to 23500PJ, or about
$232 billion per year, in lighting energy costs. Due to low lamp efficiencies, per-household fuel-based lighting expenditures in poor households shockingly rival those seen by affluent households who enjoy the vastly higher levels of quality, safety, and services provided by electric light. Electrified households enjoy 300 times higher energy-service levels (measured in lumen-hours per capita) than households dependent on fuel-based lighting. Moreover, the cost per useful lighting energy services ($/lumen-hour of light) for kerosene lighting is 300 times higher than
"inefficient" incandescent lighting and 1500 times higher than compact-fluorescent lighting. If the people currently using fuel-based lighting were to shift to electric lighting, with consumption levels equal to those in electrified households today, global household electric lighting energy use would triple.
Given the large known potential for lighting energy savings, it is remarkable how little effort has been expended by most nations to quantify the electricity used for lighting. While the collection of end-use energy data is arguably not a high national priority
MBA Dissertation
C.W Parfitt- 201509456 Page 24
in most countries, this lack of attention is particularly problematic in this instance given that lighting is usually an early and high-visibility target for energy savings campaigns and policies.
It is equally remarkable how little data have been collected in the public domain on the lighting markets themselves (e.g., shares, performance, and utilization of specific types of lighting components in the stock and in new sales) . The absence of such information severely limits our ability to formulate precise scenarios of future lighting electricity demand and to identify the savings that could be captured by new policies." (IAEEL News Letter 1-2/00)
The contention is that it is cheaper to invest in energy efficient lighting technology than to provide additional power generation plant and equipment. It is this argument I believe that has prompted many countries to introduce tax or other incentives to companies/ Local Authorities to implement changes to energy efficient technology. Using the above figures a total annual savings of 40% of $232 Billion could be achieved i.e. $92 Billion/ annum.
It has also become increasingly difficult to develop new power generation plants due to the ever-increasing awareness of the environment