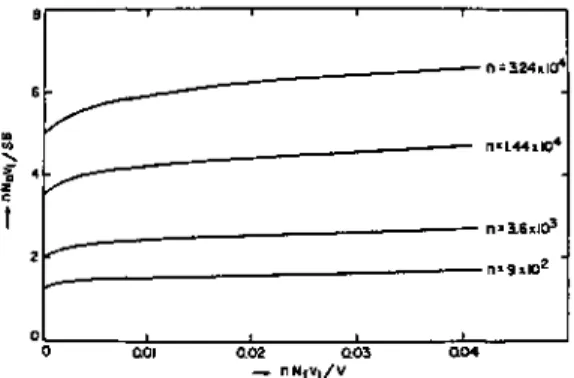
Silberberg's theory 11 B.3.3 Scheutjens and Fleer's theory 16 B.3.4 Root-mean-square thicknesses of loops and tails 25. After adsorbed and Nf non-adsorbed polymers, the distribution function Q is given by. B-13) where S is the area of the adsorbent surface, 5 is the thickness of the first layer, i.e. the train layer, and V is the volume of the bulk solution. With the restriction of Eq. B-17) and using the Lagrangian multiplication method we obtain ΔF2 for the free energy of adsorption. B-18) where qa is the distribution function for the adsorbed polymer and both λ and η are multi. The total free energy of adsorption, ΔF, is the sum of ΔFt and ΔF2, i.e. B-20).
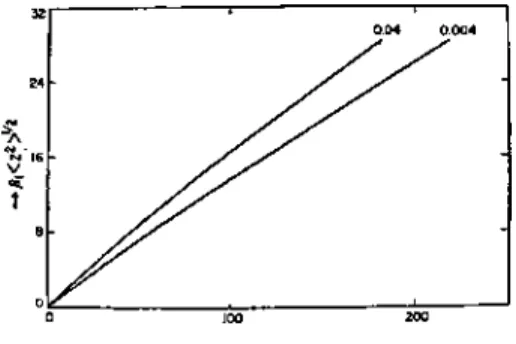
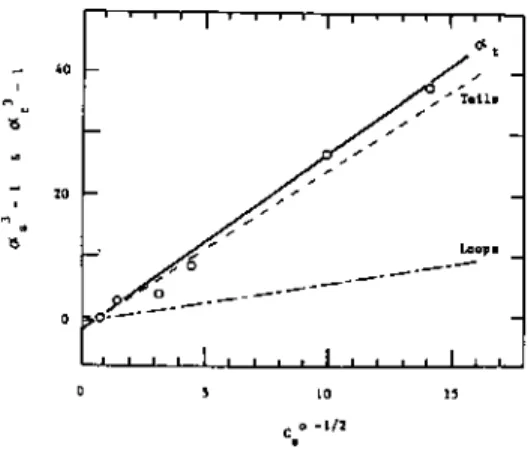
The root-mean-square distance ( z2)1 / 2 of segments from the interface is calculated from. which gives by substitution of Eq. B-30) Since -λn changes little with n for small |λ|, the root-mean-square thickness of seg. The calculated curves are almost linear. He solved the diffusion equation for a polymer adsorbed on a wall; this equation is subject to the boundary condition that the wall is completely reflective, i.e. the gradient of polymer concentration is equal to zero at the wall. In the plateau region, many polymer chains are adsorbed and give rise to an adsorbed layer of thickness D. The chemical potential pi in this region is expressed by.
Summary
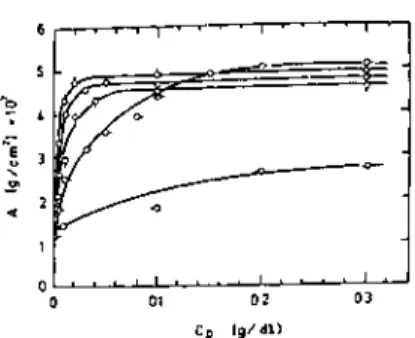
The refractive index gives the average segment density in the adsorbed layer, and its product with the average thickness of the adsorbed layer gives the adsorbance. These coefficients allow the thickness of the adsorbed layer and the polymer concentration in it to be determined. The fraction of the surface sites occupied by adsorbed polymer segments can also det.
This difference allows an estimate of the fraction of adsorbed segments if the signals from the adsorbed and non-adsorbed labeled segments can be separated.
Experimental Results
The structure of macromolecules adsorbed on interfaces 37 C.4 Heat of adsorption. Calorimetry65) is the only direct method regarding the energy in the adsorption process. The heat of adsorption should be generated from the difference between surface-segment and surface-solvent interactions, i.e.
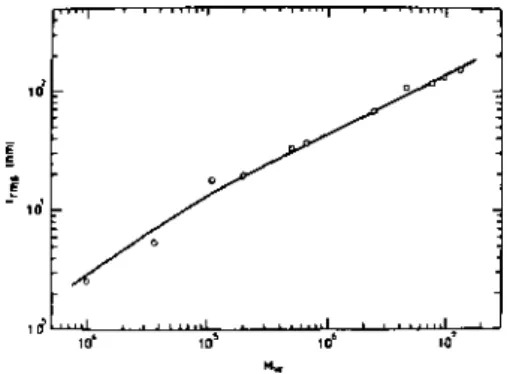
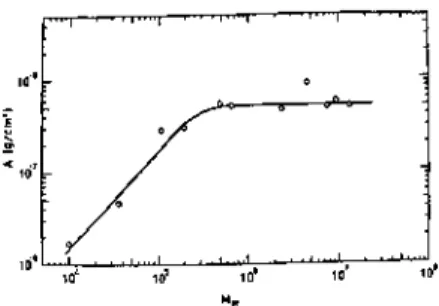
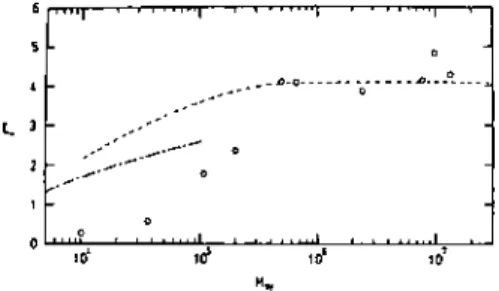
Both the adsorbance and the thickness of the adsorbed layer changed reversibly with the cyclic temperature change. The thickness of the adsorbed layer and the adsorbance increased linearly with the square root of the molecular weight. The absorbance and the thickness of the adsorbed layer for different ITIs at the air-water interface were measured by ellipsometry.
The thickness of the adsorbed layer was almost equal to the contour length of the ionene blocks.
Conclusions
The structure of macromolecules adsorbed at interfaces 61 by Eirich and Chao37, 128) using the hydrodynamic method. For a polypeptide that exists in a helical conformation and that can be considered as a rigid rod, both the adsorbance and thickness measurements revealed either a very thin or a very thick adsorbed layer. Moreover, the area occupied by one polypeptide chain in the very thick adsorbed layer was almost identical to that of its monomer unit.
Kawaguchi Many studies have revealed that the adsorption behavior of macromolecules is very specific for individual polymer-solvent-substrate systems. Nevertheless, we believe that more experimental studies with well-characterized polymers and surfaces are essential to overcome this difficulty. Professor Fujita's invitation to prepare this review and his linguistic comments are gratefully acknowledged.
Thies, C, Peyser, P., Ullman, R.: The Determination of Polymer Structures at a Liquid-Solid Interface by Infrared Analysis, in: Proceedings of the 4th International Congress on Surface Active Substrates Vol.
Polymer Elasticity
Discrete and Continuum Models
Some Solutions of Equations of Elasticity .1 Uniform Bar Under Uniaxial Tension
2.1) must be modified so that it is the applied torque and I is the second moment of area of the cross-section with respect to the axis of rotation. In the above consideration of the elastic response of materials it was assumed that the stress is only a linear function of the strain. In general, it is possible to find some of the relaxed and unrelaxed elastic constants and to estimate the distribution of relaxation times.
The system should be carefully calibrated using a standard (eg steel wire) of known stiffness similar to that of the sample. The tangent modulus is the slope of the tangent to the stress-strain curve at a given strain and strain rate. The secant modulus is the slope of the line from the origin to the stress-strain curve at a given strain.
When deriving the equations for determining the moduli, it is assumed that the relationship between stress and strain is the same everywhere, which is no longer the case for a non-linear material. These are the final effect due to the grip of the sample, the alignment of the sample in the test equipment and the shape of the sample itself. This means that the symmetry axis of the sample (ie the axis through the center of the cross-section) is co-linear with the axis along which the force acts.
If this is not the case, shear and bending of the specimen will occur. In the previous chapters it was assumed that the elastic properties of the material do not depend on the position.
Ordered Heterogeneous Materials with Phases Considered as Continua. The Unit Cell Approach
Barham The properties of RVE can be deduced from below, so to speak, in terms of these molecular quantities. Polymer elasticity 99 The elasticity constants derived by Van Fo Fy and Savin are as follows. axis is 3, c is the concentration of the circular reinforcing phase in the hexagonal array. They are derived from a model consisting of a random assembly of composite cylinders (Hashin and Rosen56)) and expressed in terms of axial Young's modulus Ea*, Poisson's ratio for uniaxial stress in the direction of the fibers va*, strain in the transverse plane modulus kt*, axial shear modulus Ga * and transverse shear modulus Gt*.
In these expressions, Ei, Gj, vi are Young's and shear moduli and Poisson's ratio for phase i, ai = 3-4 vi and. 4.4) These formulas and some others were compared with measurements of the elastic moduli of the SBS copolymer, which show hexagonal symmetry12).
Bounds on Elastic Constants
This method is based on the exact solution of the elasticity problem to include a known geometry (an ellipsoid) surrounded by an infinite matrix. We must consider the size of the representative volume element (RVE) for polymers, taking into account the requirements of its definition. Phaseless Copolymers Half the RMS end-to-end distance of the copolymer chain, separation.
In block copolymers, phase separation leads to partially ordered structures of one phase in a matrix of the other (Hendus68, Matsuo69)). Although it is known that the elastic moduli of copolymers increase as the proportion of the glassy component increases (Dawkins70), Allport and Mohajer71)), few calculations appear to have been made of the overall moduli in terms of the constituent moduli. If these phases are regular spheres or cylinders, calculations of the overall elastic properties are possible using the theories described in Chapter 1.
In the field of semi-crystalline polymers, several workers have used composite theories to explain their elastic properties in terms of the properties of the crystalline and amorphous phases. In view of the unreality of the authors' assumptions about real structural elements in the polymer, more sophisticated analysis was not warranted. However, the value of the elastic modulus in the chain direction is of great interest, especially in light of recent experimental studies of highly oriented polymers prepared by various techniques92–98).
This method (later also used by Wobser and Blasenbrey110) requires the knowledge of the lattice constants and the set angle of the chains in the lattice and the assumption of a perfect and infinite crystal. The potential energy Ф consists of intramolecular energy (energy along the chain) and intermolecular energy (between chains), each time summed for all atoms in the unit cell.
7 Conclusion
8 References
Local Main-Chain Motions
In accordance with the last result, the activation energy of the elastin relaxation process decreases. Temperature dependence of the shear loss modulus of poly(methyl methacrylate) (1), poly(n-propyl methacrylate) (2), poly(2-hydroxyethyl methacrylate) (3), poly(5-hydroxy-3-oxapentyl methacrylate) ) (4), and poly(8-hydroxy-3,6-dioxaoctyl methacrylate) (5). Temperature dependence of the shear loss modulus of poly(pivaloyl-2-oxyethyl methacrylate): atactic (-), isotactic.
Temperature dependence of the shear loss modulus of poly(ethyl methacrylate) (1), poly(2,2,2-trichloroethyl methacrylate) (2), poly(2,2,2-trichloro-l-methoxyethyl methacrylate) (3) , and poly(2, 2,2-trichloroethoxyethyl methacrylate) (4). Effect of the volume fraction of methyl methacrylate (upper figure) and of acrylamide (lower figure) in copolymers with 2-hydroxyethyl methacrylate on the temperature dependence of the shear loss modulus. Effect of the volume fraction of methacrylic acid on the temperature dependence of the shear loss modulus of copolymers with 2-hydroxyethyl methacrylate.
Effect of the volume fraction of water on the temperature dependence of the displacement 1<. Effect of the volume fraction of water on tem. perature dependence of the shear loss modulus of poly¬. Secondary relaxations in glassy polymers. Density (in Mg/m3) of the poly(2-hydroxyethyl methacrylate) urea of the system as a function of the weight fraction wu of urea.
Thus, the interaction of the solvent molecules with the hydroxy groups (but in other cases also with the ester or amide groups) of the side chains leads to the transformation of the relaxation processes. Diluting molecules, the movement of which is set simultaneously with that of the side chains, contribute significantly to the βd relaxation process.
Author Index Volumes 1-46
Szwarc, M.: The kinetics and mechanism of N-carboxy-a-amino acid anhydride (NCA) polymerization to polyamino acids. Tuzar, Z., Kratochvil, P., and Bohdaneckf, M.: Dilute solution properties of aliphatic polyamides. and Sartori, G.: Current status of the multicomponent copolymerization theory.
Interactions Between Macro- molecules in Solution and Inter-
Kortum
Reflectance Spectroscopy