In shallow waters, most of the recirculation is likely to be driven by the interaction of wave-driven oscillatory flows with the bottom topography, which can cause pressure fluctuations at the sediment–water interface on very short timescales. Despite the importance of pore water exchange in coastal biogeochemical cycles, it is still not easy to quantify the advective flux of water and solutes in permeable sediments (Boudreau et al., 2001; Rocha, 2008). Radon is produced in sediments by the radioactive decay of 226Ra, which is part of
In addition to sediment porosity and radon concentrations at different depths, this approach requires knowledge of the sediment production rate (γ), which can either be calculated from slurry equilibrium experiments (Colbert and Hammond, 2008) or derived from deep pore water. radon concentrations, which are assumed to be unaffected by pore water exchange (Cable and Martin, 2008). Separation mixing cell models have been shown to produce results similar to advective-dispersive models provided that advection is the dominant transport process and that the mixing cell size is chosen appropriately (Xu et al., 2007). Dispersion is not explicitly simulated, but is implicitly simulated based on the cell size of the mixture.
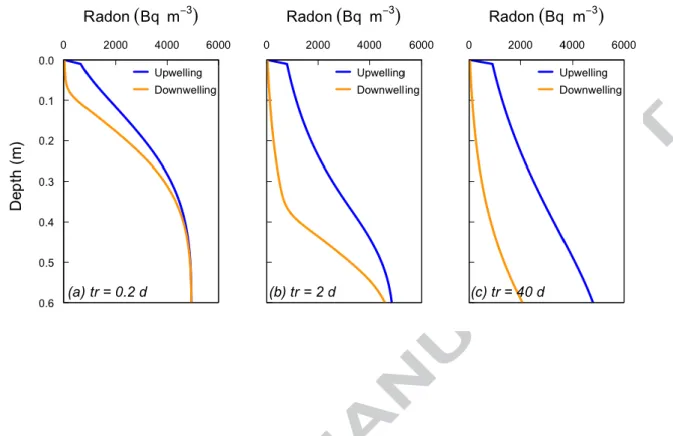
The key parameters in the model are surface water concentration (c0), sediment characteristics (, . ) and recirculation characteristics, which include the time to complete the cycle (tr) and the velocity profile qv(i). It is connected to the Mediterranean Sea through a small opening in the coastal sand spit and receives a continuous input of fresh groundwater mainly from the regional karst aquifer (Stieglitz et al., 2013). A recent study by Stieglitz et al. 2013) revealed that a wind-driven horizontal pressure gradient at the sediment-water interface results in the recirculation of large volumes of lagoonal water through surface sediments.
The latter corresponds to a flow length of approximately 0.5 m (Gelhar et al., 1992). This is the approximate depth of radon depletion visible in the measured profiles, and therefore also the apparent depth of recirculation.
RESULTS
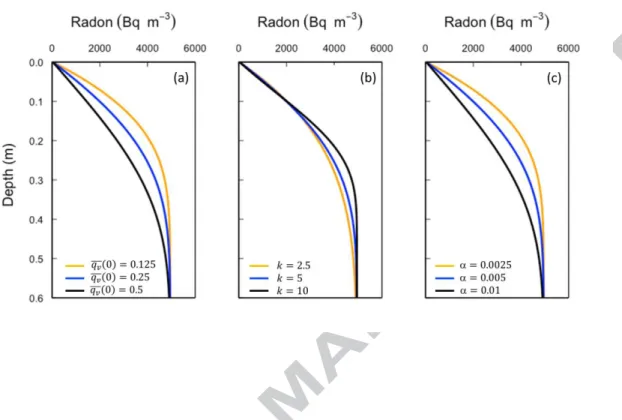
This essentially introduces differences that will be observed depending on the timing of sampling relative to the cycling phase. However, lower values of k are only possible if the two shallow radon values (< 0.15 m depth) are towards the upper limit of the analytical uncertainty range and the four deeper values m) are towards the lower limit . Values of k are more sensitive to radon concentrations at the depth of 0.2 – 0.4 m (Figure 5), and increasing the accuracy of these measurements would significantly improve the accuracy of estimating the rate of flux attenuation.
The advection circulation and dispersion model results are a function of the selected longitudinal dispersivity (expressed as cell size for the advection circulation model). Because dispersion is a scale-dependent parameter, longitudinal dispersion () has often been related to field-scale flow path length (Gelhar et al., 1992; Neuman, 1990). Since the sediment at the study site consists mainly of coarse-grained particles, the average
Model-derived water fluxes in the upper sediment layers are relatively insensitive to the selected production rate (), but exerts an important control on the water fluxes simulated for deeper layers, where radon resides. A limitation of the model is that it neglects the horizontal travel times between upwelling and downwelling profiles. Given that it is extremely difficult to collect pore water samples for radon analysis in the top centimeters of the sediment, the pore water samples closest to the surface are usually collected at a depth of 0.05-0.1 m.
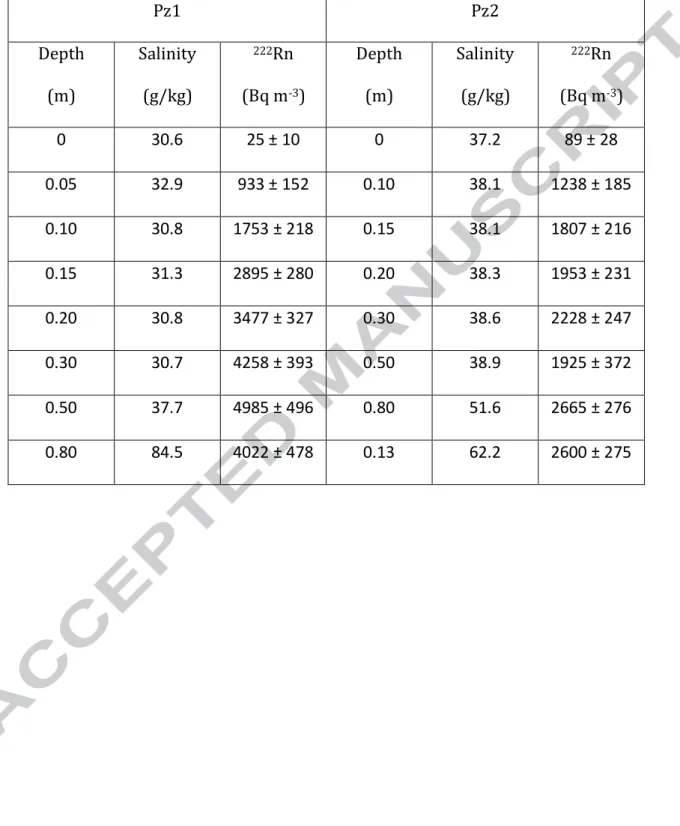
In the case of the profiles collected in La Palme Lagoon, the radon concentration in the highest pore water sample in PZ1, which was collected at a depth of 0.05 m, is 930 Bq m-3. One of the advantages of the radon method described here is that it allows estimation of water fluxes as a function of depth. While most studies of pore water exchange have focused on fluxes across the sediment-water interface, defining.
Collection of different radon pore water profiles in the same area should provide additional information on the temporal and spatial scales of the driving forces, identifying the persistence of uplift and subsidence zones. In situ flowmeters can vary fluxes above and below the sediment interface due to the presence of the instrument. However, mass balances in the upper waters will have additional uncertainty due to the need to determine other components of the mass balance.
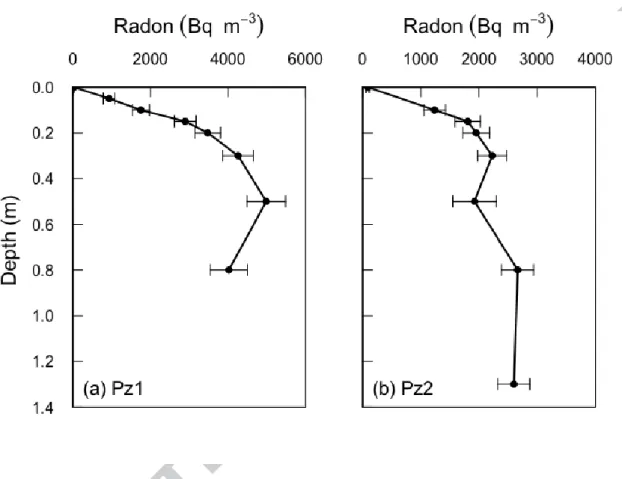
The shape of the radon pore water profiles collected in the La Palme lagoon (Figure 2) suggests that the pore water exchange at the sites sampled is driven by pressure gradients that reverse at short temporal scales (up to hours). The advection cycle model presented in this paper is less amenable to situations where molecular diffusion is a significant component of the tracer flux.
CONCLUSIONS
Finally, it should be noted that partitioning into the solid phase means that the depletion of 224Ra in the pore water will be much shallower than for 222Rn (since the depleted 224Ra in the pore water will be replaced by the released 224Ra from the sorbed phase), and thus this requires much finer resolution sampling. Recent studies using the 224Ra/228Th method have been mostly in finer-grained sediments than those using the 222Rn method, and in these environments diffusion often forms a significant component of the tracer flux. The model allows estimation of water fluxes at different depths, which can provide some general insights.
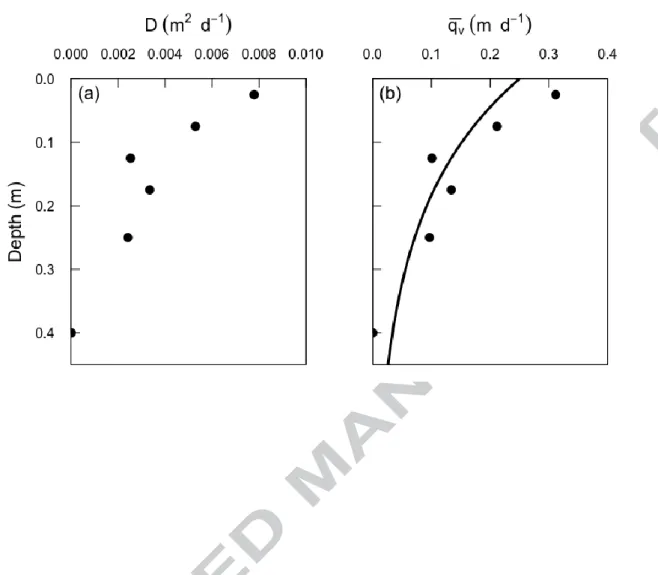
A simpler approach, based on estimating dispersion coefficients from the radon concentration gradient with depth, can also provide reasonable estimates of advective water flux. Other methods commonly used to quantify benthic fluxes (eg tracer mass balance in headwaters, seepage gauges) are not suitable for estimating fluxes on such short time scales. Radon-222 as a tracer for water column mixing and benthic exchange in southern California.
In situ evaluation of marine and fresh pore water transport along the coast to Flamengo Bay, Brazil. Temporal and spatial variability of radium in the coastal ocean and its impact on the calculation of near-shore mixing rates. Use of radon-222 and calcium as tracers in a three-endmember mixing model for streamflow generation on the West Fork of Walker Branch Watershed.
Comparison of transient storage modeling and residence time distribution (RTD) analysis in geomorphically varied areas in the Lookout Creek Basin, Oregon, USA. mixture approach for the quantitative assessment of groundwater dynamics in the Otway Basin, South Australia. Organic matter remineralization and pore water exchange rates in permeable South Atlantic Bight continental shelf sediments. Benthic flux of biogenic elements on the Southeastern US continental shelf: influence of pore water advective transport and benthic microalgae.
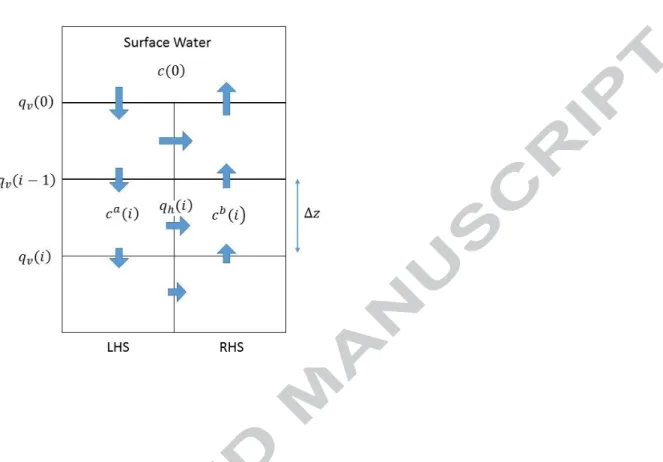
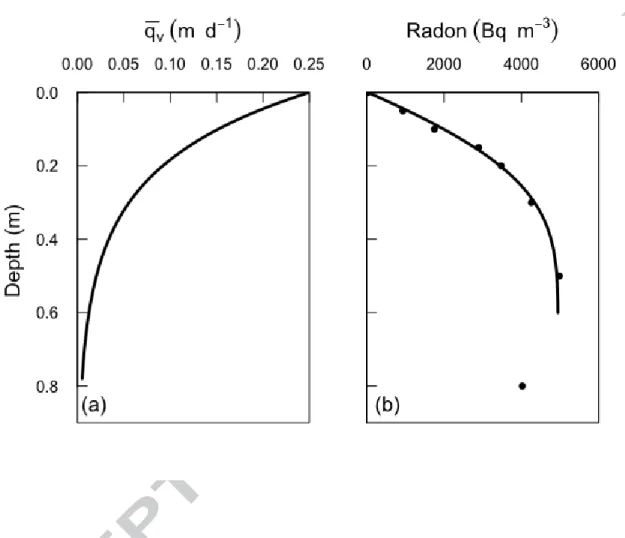
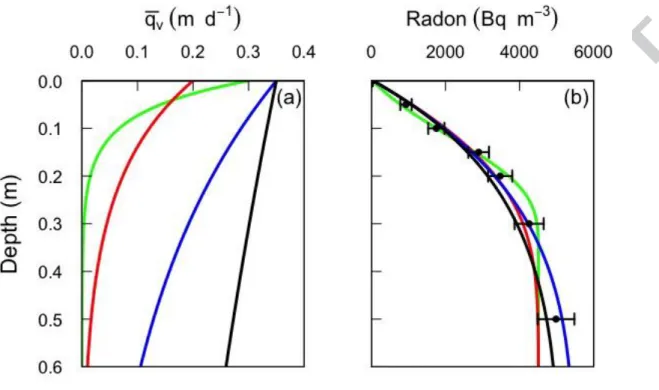
Arrows indicate the flow directions during the first phase of the recirculation cycle, in which the flows are downward on the left side and upward on the right side. Vertical water flows into and out of cell i are qv(i-1) and qv(i), where i = 1,…n, where n+1 is the number of cells in the vertical dimension. The error bars represent the analytical uncertainties (1) for radon (liquid scintillation count). a) Average vertical water velocity (up or down), as a function of depth, and the resulting radon concentration profile for = 10-5 d (0.86 s) for Pz1.
Note also that the inflection point in the well profile is similar to the rated water flow (qv(0)) multiplied by the drawdown period (tr/2).