p 664.1220973 1
P R O C E E D I N G S
American Society of Sugar Cane Technologists
Volume 9 - Papers for 1962
February, 1963
P R O C E E D I N G S
American Society of Sugar Cane Technologists
Volume 9 - Papers tor 7962
February, 1963
F O R E W O R D
This is the ninth volume of proceedings of the Society which have been published since its founding in 1938.
The first volume published in 1941 included papers presented during 1938, 1939 and 1940. Mr. Walter Godchaux, Jr., the then Secretary-Treasurer, edited that edition.
The second volume published in 1946 included papers presented during 1941-1945 inclusive. Dr. E. V. Abbott, Secretary-Treasurer, edited that edition.
The third volume published in 1953 included papers presented during 1946-1950 inclusive. A fourth volume was published in 1955 and presented papers for the years of 1950 through 1953. Volume five contains papers for the years of 1954 and 1955. The sixth volume included papers presented during 1956. The third through sixth volumes were edited by Dr. Arthur G.
Keller.
This ninth volume includes papers for the year 1962 and has been compiled by the writer.
Denver T. Loupe Secretary-Treasurer
February, 1963
I N D E X
Agricultural Section - February 1962 PAGE Operations of the Division of Agricultural Chemistry.
E. A. Epps, Jr. . . . 1 Soils and Fertilizers and How They Behave. Ivan E. Miles 5 The Farm and Home Development Program and Its Effect on
Some Iberia Sugarcane Farms. Charles A. Miller 14 A Study of Methods of Cane Quality Determination for Cane Payment
John J. Seip 24 Agricultural Section - June 1962
The Effect of Shaving Sugarcane on Income. E. J. Lousteau . . . 34
Problems Created by Insecticide Use. W. H. Long 38 Course Outline - Sugarcane Production. Russ Miller. . . . 57
Manufacturing Section - February 1962
Bagasse Burning in Multi-Cells, Irving Legendre, Jr 62 Burning Bagasse in Stoker Furnace. Patrick Cancienne 66 Continuous Diffusion Process for Sugarcane Juice Extraction.
Harold Silver. (No paper submitted)
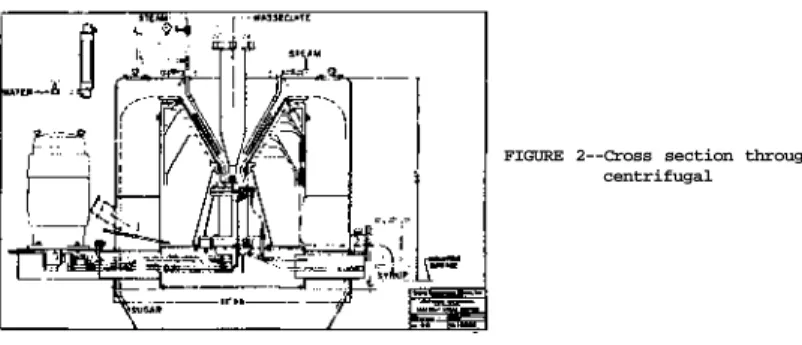
Present Day Milling Practice at Glenwood. Luis Suarez 68 Silver Continuous Centrifugal. Clarence R. Steele 71
Manufacturing Section - June 1962 Experiences with Continuous Centrifugals at Valentine. Hector
Elizondo. . . . 8 2 The Bach Poly-Cell Subsider. Wilmer M. Grayson. 88
A Sugarcane Carrier Control System. Sidney J. Levet, III 93 A New Method for Economic Utilization of Bagasse. John R. Shattuck. 98
OPERATIONS OF THE DIVISION OF AGRICULTURAL CHEMISTRY E. A. Epps, Jr., Chief Chemist Division of Agricultural Chemistry
Box 589, Baton Rouge 1, Louisiana
The farmer is often at a disadvantage because he must buy and sell on the other parties' terms. As the farmer began to use feeds, fertilizers, and pesticides, items that had to be purchased from others, it became apparent that protection was needed. Some means of assuring the farmer that he got what he paid for had to be found. The Louisiana feed, fertilizer and pesticide laws were enacted for this purpose. There is strong evidence that sugar planters were moving forces in this cause. Louisiana was one of the first states to provide consumer protection of this kind. The fertilizer law was enacted in 1886, the feed law in 1904, and the pesticide law in 1890. With the passage of time these laws have been revised but the basic intent remains: feeds, fertilizers and pesticides must be labeled to show their content and they must meet label claims.
As this is one of the oldest functions of your Department of Agriculture, it may be sometimes overshadowed by more recent developments. It may be worthwhile to review here the operation of these laws.
The Commissioner of Agriculture and Immigration is responsible for enforce- ment of the laws. The Director of Louisiana Agricultural Experiment Station is designated as the State Chemist with responsibility for analyzing samples submitted by the Commissioner's inspectors. The overall enforcement program is a joint effort with the two agencies working closely together to provide protection for the farmer. The Division of Agricultural Chemistry has been assigned the specific function of enforcing these laws.
Before any feed, fertilizer or pesticide can be sold in Louisiana it must be registered with the Commissioner. In most cases, registration is granted but
1
applications are carefully examined and products which are not effective for the purpose claimed are denied registration.
Eight inspectors are assigned to specific districts in the state. These men check for registration and proper labeling and take samples of the products offered for sale. The samples are sent to L.S.U. for analysis. When completed the analyses are reported to the purchaser and the manufacturer. If the analysis meets or exceeds legal requirements no figures are shown on the report. If there is a deficiency the actual analysis is shown on the report. There has been some discussion as to the matter of tolerances on these reports. Tolerances for feeds and fertilizers are established by law. Because of the complex nature of pesticides and the constant addition of new materials it is not feasible to write tolerances for them into the law. Tolerances for pesticides are established as an administrative procedure based upon past experience, Studies in Louisiana, as well as in other states, have shown that there are certain unavoidable varia- tions in sampling and analysis that must be taken into account in law enforcement.
Very seldom will two chemists obtain the same results from analysis of the same sample. If, for example, a sample of 2% endrin granules was analyzed, the results might show 1.9% endrin. A second sample from the same lot might show 2.1% endrin. It would not be fair to accuse a manufacturer of misrepresentation under these circumstances. Slight deviations within practically established limits of analytical precision are not considered evidence of wrong doing.
Tolerances are for the laboratory, not the manufacturer.
When deficiencies are found a number of possible courses of action are available. For feeds and fertilizers definite penalty scales are established by law. Approximately $7,000.00 in penalties were assessed and collected in 1960-1961.
Sometimes it is possible to stop sale of off-quality products. In other cases the seller is requested to make replacement with good material or to make adjust- ment with the purchaser. Less often, applied remedies are court action and can- cellation of registration.
2
The enforcement of these laws is financed by a twenty-five cent per ton inspection fee on feeds and fertilizers and a ten dollar per brand annual regis- tration fee for pesticides.
Because of seasonal demands the facilities of the laboratory are not always used to full capacity for official work so considerable time is given to service work. Analytical work is done in connection with research projects of other departments of the Experiment Station. For example, we are currently analyzing feeds and forage for a beef production study at Jeanerette. The services of the laboratory are also available to any resident of Louisiana so long as the sample is concerned with agriculture. If any of you wish analysis of hay, silage, lime, water, etc. just send the sample to the laboratory with an explanation of the kind of analysis you wish.
When samples are for information only, the individual may send them in him- self. However, such samples have little legal status. If you have a problem with feed, fertilizer, insecticide, pesticide, etc. contact your district in- spector if you know him or nitify the Baton Rouge office. An inspector will take the necessary samples as promptly as possible and if necessary a "rush" analysis can be arranged for. There is, of course, no charge for any work of this kind.
In addition to the feed, fertilizer and pesticide work, this Division enforces the Dangerous Herbicide Law and represents the Commissioner on the Stream Control Commission.
In closing, Louisiana has adequate laws for protecting the consumer of feeds, fertilizers, and pesticides. An alert inspection force and excellent laboratory facilities are actively employed for enforcement of the laws. But one must look out for himself. No law can protect a careless man. Two ways in which one can help himself are: First, deal only with reputable suppliers. When one buys on price alone he is looking for trouble. Second, read the label and be sure it is understood. A very great amount of effort is expended by state, federal, and
industrial agencies to see that informative labels are used. Know what you are buying. Don't buy unlabeled goods.
The facilities and personnel of the Division are at your service. Call on us when you need us.
4
SOILS AND FERTILIZERS AND HOW THEY BEHAVE by
Ivan E. Miles
Were you ever really hungry in your life? I thought I had been until I saw the teaming thousands of Asia. It is said, and I am inclined to believe it, that one-half of the people on earth go to bed hungry every night, and that one- third of them have never had enough of the right kind of food to eat in their entire lives. Their crops and often their animals were in much the same situation.
Of course, the hungry animal can break loose and go elsewhere to find food, but, the poor crop has to stay where it's put even though if may starve to death.
Everything including man, animal, and crops has to eat and eat properly if it is to live and fully perform the function for which it was created. At this time, we are thinking of crops. We, who depend upon these crops for a living, should recognize the fact that according to research here in the state, our crops are only half living or at least, only half performing. Over and over again and under many different circumstances, through proper fertilization and management, yields have doubled or tripled the state average and the cost per unit has been materially reduced.
Fertilizers or plant foods are only one part of a total efficient production program called good management. In this paper it will be assumed that all other essential practices will be carried out and, therefore, only soils and plant foods will be discussed.
What Are Plant Foods?
Many elements have been found in crops and at least fifteen are known to be essential. Most of these are present in ample quantities in most Louisiana soils to support good crops, but at least four are needed quite broadly over the state.
This includes nitrogen, phosphorus, potash, and calcium or lime. Each of these 5
will be discussed briefly as to their source, function, and behavior.
Nitrogen
The air that we breathe has about 80% nitrogen but this nitrogen, as such, is of no value to general crops. Legume plants with the aid of certain bacteria in the soil can take this nitrogen from the air and use it, but other plants cannot. The natural or unapplied nitrogen in the soil is derived primarily from the organic matter in the soil.
The microscopic, or very tiny, soil organisms in the soil eat and destroy the organic matter in the soil, and in so doing, release the nitrogen which was contained in it. The amount of nitrogen in the organic matter may vary from almost nothing at all up to eight to ten thousand pounds per acre. The figure 2000 pounds per acre used in Figure No, 1 was for illustration purposes.
Golden* has shown that a sugarcane crop ate, or took up, 111 pounds of nitrogen and made about 21 tons of cane. These data suggest that the crop has to actually take up that much nitrogen in order to grow the 21 tons of cane.
How is this nitrogen used in the crop? There are several functions performed by nitrogen, namely:
1. It is the growth element, It stimulates stem and leaf growth.
2. It increases the protein content of the crop.
3. It gives a deep green color to the plant.
4. It increases the water content, thus making salad greens more tender and crisp, and making small grains and rice lodge or fall down worse when excessive amounts are used.
There are several good sources of nitrogen including anhydrous ammonia (82-0-0), urea (45-0-0), ammonium nitrate (33-0-0), ammonium sulfate (21-0-0), and nitrate of soda (16-0-0).
The major portion of the nitrogen is used by most crops in the nitrate form, but some ammonia is used too. This is especially true of the rice crop through- out its life and the cotton crop when it is young. For general crops, the form
*L. E. Golden, "Nutrient Availability and Uptake for Sugarcane" memo, Agronomy Department, Louisiana State University, Baton Rouge, Louisiana
6
in which the nitrogen is applied after the soil has warmed up in the spring, is not of very great consequence, however, since the soil organisms soon convert most sources of ammonia to nitrates anyway.
Ammonia ties itself to the soil particles and normally does not move a great deal. However, when it is once in the nitrate form of nitrogen it does not tie itself to the soil very firmly and thus moves quite freely with the water. If the soil type is such that the water moves down freely, then the nitrate nitrogen also moves freely and may move out of reach of the plant roots and thus be lost.
On the average, the crop probably does not actually take up more than 50%
of the applied nitrogen.
Nitrogen is the most expensive of these plant food elements, but it performs such important functions that it must be used. It pays very handsome dividends when properly used.
Phorphorus
Like nitrogen, the amount of phosphorus as well as the other plant food elements contained in the soil, varies from one extreme to the other. The native or unapplied phosphorus in the soil is contained both on the surface and inside the soil particles as shown in Figure No. 2.
Again Golden's data showed that a 21-ton crop of cane took up 52 pounds of phosphorus. What are the functions of phosphorus in the crop? They are listed below:
1. It is the fruiting plant food element.
2. It is the plant food that stimulates earliness. It stimulates early root formation, early growth, early fruiting, and early maturity.
3. It is part of every living cell; therefore, it has to do with repro- duction.
There are also several sources of phosphorus. These include fused tri- calcium phosphate(0-27-0), calcium metaphosphate (0-62-0), rock phosphate (0-32-0), super-phosphate (0-20-0 and 0-45-0), ammonium phosphate (11-48-0) which is relatively new and is water soluble, ammoniated phosphate (the regular or
conventional type of mixed fertilizer like (8-8-8) , and phosphoric acid or liquid
The efficiency with which applied phosphorus is used varies a great deal with the type of pH of the soil, the source, the crop, and the method of application. The greatest efficiency for row crops is normally realized when a highly soluble (ammonium phosphate) phosphate material is banded in the row on a sandy to sandy loam soil that has a pH of 6.0 to 7.5. Under very acid conditions, some of the other sources would be just as efficient, if not more so.
The efficiency of the most soluble forms and under ideal conditions would normally not exceed about 30 to 35% of the applied phosphates. Not over 15 to 20% efficiency is realized on much of the phosphorus applied in Louisiana.
When phosphorus is applied to the soil it ties itself to the minerals in the soil and tends to become rather firmly fixed as to both compound formed and position in the soil. It then becomes less soluble, less active, and moves little or none in the soil. More acid conditions accelerate this action as shown in Figure No. 3. This reaction condition is more pronounced in clay soils than in sandy soils. In the case of the more soluble phosphates and particularly for row crops, banding the material is considerably more efficient than broad- casting. A minimum of contact between the soil particles and the phosphorus material retards this tying up or fixation process. On the other hand, broad- cast application would give maximum contact between soil particles and phosphorus material and would accelerate fixation of soluble phosphates.
Phosphorus is an extremely important plant food. There is a great deal of difference in different sources and this should be recognized and the phos- phorus selected and used in such a manner to realize the greatest profit.
Potash
This plant food element is contained in the soil particle in relatively larger amounts than phosphorus. It becomes available to the crop whether it is
8 phosphorus
derived from the soil or applied fertilizer, as it dissolves in the film of water around the soil particles.
In the case of potash, Golden's results showed that a 21-ton crop of cane used 212 pounds. Potash performs a number of very important functions in the plant, namely:
1. It is the general health and vigor element. It tends to make the crop strong and vigorous, enabling it to stand more cold weather, to have a strong, stiff stalk and thus not blow down easily, and to resist certain types of diseases.
2. It is an important quality element. For example, vegetables with ample potash tend to be more firm and thus reach the market in better condition.
3. Stimulates root formation.
There are several sources of potash including muriate of potash (0-0-60), sulfate of potash (0-0-48), and sulfate of potash - magnesia (0-0-25),
When potash is added to the soil it tends to tie itself to the soil complex, but it is not fixed as firmly as phosphates. In very sandy soil where the soil water can move down rapidly, the potash can go into solution and be leached out and lost. In loams and clays where the movement of water is restricted, not much potash is normally lost by leaching.
The efficiency with which applied potash is used by the crop is somewhat in the same category as nitrogen. Under ideal conditions, recovery of applied potash may run as high as 80 to 85%, but on the average, probably not over 50 to 60% is utilized by the crop.
Calcium
The native or unapplied calcium is contained in the soil particle. The amount of calcium contained in the soil may vary from nothing to many tons in the top soil on each acre.
The end product of applied calcium in the soil is calcium carbonate or lime. Therefore, whether it is applied to the soil as calcium oxide (burned
lime), calcium hydroxide (hydrated lime), or as calcium carbonate (lime), the end product is calcium carbonate.
Calcium serves several very important functions, namely:
1. It is an important plant food. Its exact functions are not fully understood. It is believed that calcium aids in:
A. Translocation of carbohydrates within the plant.
B. Construction of healthy cell walls,
C. Assists potassium and magnesium in neutralizing organic acids within the plant.
2. It is the predominant element that control pH in soils that are used for cropping purposes. A favorable pH increases efficiency in usage of other plant foods.
3. It makes a favorable media in the soil for soil organisms to work.
A good supply of calcium is needed in all cultivated soils in order to realize the greatest efficiency from the other plant foods and to produce food and feed of high quality.
Soil Testing
As already pointed out, nitrogen, phosphorus, potash, and calcium are all very important plant food elements. Each one performs a separate and distinct function. Neither one of them will do the work of any of the others. All must be present and available in sufficient quantities if the crops are to grow and produce efficiently.
The amount of nitrogen, phosphorus, and potash that is utilized in growing various crops is pretty well established and some of them are shown below:
PLANT FOOD REMOVAL BY CROPS CROP
Cotton Corn Sweet Potatoes Tomatoes Alfalfa & Grass Soybeans
YIELD 1-1/2 bales 100 bushels 300 bushels
20 tons 4.5 tons 4.0 bushels
NITROGEN
105#/A.
160 75 200 170 180
PHOSPHORUS p2o5
45#/A.
60 20 80 45 45
POTASH K20 64#/A.
120 115 400 200 80
10
How is the farmer to know whether his soil has enough available plant food to produce the type, kind and amount of production that he wishes? There are a number of aids in arriving at the answer to this question. A crop which is hungry for nitrogen gives certain symptoms, phosphorus others, and potash still others. Studying these hunger signs in crops can be very helpful in determining plant food needs. Fertilizer experiments and demonstrations can also be very helpful. Plant tissue tests properly run and interpreted can supply some very helpful information too.
For most farmers though, a soil test based upon a good sample and accompanied by the basic historical data on that soil and on the crops grown on it, is perhaps the best tool available. The results of the tests can best be inter- preted by someone trained in soil chemistry and plant nutrition and with a knowledge of local conditions.
A new soil test should be made every three or four years, A systematic program of testing soils should be practiced by all farmers.
Figure 1
Soil Profile
12
Figure 3
The pH Scale
13
THE FARM AND HOME DEVELOPMENT PROGRAM AND ITS EFFECT ON SOME IBERIA SUGARCANE FARMERS
Charles A. Miller
The rapid technological advancement and economic growth which our country has experienced during the past two decades has, in general, resulted in chronic economic pressure for the farmers of our nation. One of the major problems which developed during this period was the "cost-price squeeze" in which farmers found themselves as a result of the inflationary creep in the cost of production and a decline in prices received. Faced with this economic situation farmers and farm organizations throughout the country began to seek and demand assistance with their management problems. Many farmers began to recognize the fact that the rapid changes in Agriculture made it imperative that they do more and better planning.
Approximately 7 or 8 years ago as a result of these requests from interested and concerned people, the Agricultural Extension Service inaugerated a new educational method of working with farm families. In Louisiana and most states, the program is called "Farm and Home Development." It is known as "Balanced Farming" in Missouri and other names in some states. The objectives of Farm and Home Development are to teach farm families to understand and develop skills in use of principles and procedures of management that will enable them to analyze their situations, explore opportunities, make decisions, develop plans and carry the plans to a successful conclusion -- with the ultimate goal in most cases being increased net income for improved family living. Families participating on the program counsel individually with Extension Agents and emphasis is given to studying the problems existing on that particular farm.
All over the United States, County and Associate County Agents have the major responsibility for the production phase of Farm and Home Development in their counties or parishes. In most cases, this is a full-time job. The Home
14
Demonstration Agents are responsible for the home management phase of the pro- gram in the counties or parishes where this program is in effect.
In 1954 the program was first started in a few parishes in Louisiana and presently is in operation in 22 Louisiana parishes. While Farm and Home Develop- ment is concerned with the farm from both the home and business viewpoint, my discussion today will be concerned only with the farm business or farm manage- ment aspect.
Income on many Louisiana farms is often lower than it could be. This situa- tion is also typical of many farms throughout the country. Agricultural research, education, policy and major efforts of various agricultural agencies, have been directed toward improving farm income for many years. This relatively new national educational program is another method aimed at assisting farm families adjust to the problems of a rapidly changing technological age.
There are two main reasons why incomes on many farms are often lower than they should be: First, unprofitable practices, and, second inefficient organiza- tion of the farm business or farm resources. In many cases either or both may need improving. PRACTICES have to do with such things as land preparation, seeding, fertilization, weed control, insect control, etc. ORGANIZATION has to do with the way in which the farmers' resources and products are combined. Some farmers often follow costly or unproductive ways of doing things on the farm when less costly or more efficient means are available. The organization of inputs may be poor. There may be over capitalization (in the form of too much equipment), or too much labor, or imbalance in the form of capital being used -- such as too much equipment, but not enough fertilizer.
An inefficient combination of enterprises may be causing competition between resources such as labor and machinery at critical periods. Other times these same resources are lying idle when they could be put to use on something else.
These and similar kinds of problems are MANAGEMENT PROBLEMS on individual farms.
Often they can be improved by studying the farm from a business stand-
point, making sound corrective decisions, and then putting these decisions into action.
Agents assigned to Farm and Home Development Program work with as many families as effectively possible, which will usually be 60 to 80 families.
Participating families are selected from various parts of a parish or county so that practices which they adopt can be disseminated to as many people as possible. Only those showing interest in the program and a desire to cooperate are selected. Farm and Home Development is designed for all types and sizes of farms. The size of the farm is not a determining factor, however, each family selected should have the potential to develop an economically sound farm business.
Since the objective of the program is to increase net farm income by improving management this usually means changing practices or organization of the farm, or both. Potential cooperators who have indicated an interest in the program either by contacting the county agent or whose names was submitted by a member of the Extension Advisory Committee or a neighboring farmer is paid an initial visit by the agent to explain the aims and objectives of the program.
The farmer is told about the type of assistance he can expect -- including visits from the agent periodically to follow-up on recommendations made to him -- not so much to check and see if he carried out the recommendations, but to see if recommended practices were effective. The farmer is also told that he will be given assistance with records and will be expected to keep an adequate record of his operations.
Once it has been mutually agreed that a farmer wants to participate on the program, the farmer and agent will get together to make an inventory of the kinds and amounts of resources he has to work with, including land, labor and capital. This includes a map of his farm layout, showing slopes, drainage, etc.
Then the various production practices which he has been following such as seeding 16
and fertilization rates, disease control, insect control, etc. are carefully examined. The current organization of resources and the combination of products are also studies for flaws. There may be too little or possibly too much machinery. Labor or land may be under utilized. Crops may be competing with one another for labor or machinery at a critical period so that production suffers. In some cases more land may be needed to make better use of equipment and available labor. Various other evidences of poor management may show up which may often be improved.
Having done this the next step is to do the "budgeting" which is nothing more than planning, on paper and in advance, how the farm's resources will be used and what the alternative production possibilities are open to the farm.
This budgeting technique makes it possible to test various alternative farm plans and practices on paper with a fair degree of accuracy. The plans or
"budgets" as they are called are based on the best data available at any given time -- such as experiment stations, specialist, farm records, surveys other farmers -- in short, many sources.
This process provides an excellent opportunity for the farmer to sit down and take a good look at his business -- to evaluate his present operation, look into the possibility of making constructive changes and plan a definite course of action.
At the end of each year the records of the farm operations are examined and analyzed. In many instances an analysis of the records will reveal weak- nesses in the previous year's operation which can sometimes be corrected the following year. One of the values of this program, I believe, is that the paper work involved, such as the farm inventory, budgeting, records, etc., develops a more businesslike attitude among the participants -- a factor which is becoming increasingly important in modern day farming.
In 1957, after 8 years of doing 4-H Club work in Iberia Parish I was
assigned to the Farm and Home Development Program. Mr. Williams, the County Agent, had been working with 5 families for approximately 3 years prior to this time, however, it was not until September of 1957, when I was given the responsibility, that a full-time agent had been assigned to this program in Iberia. Twenty-two families were enrolled the first year and each year, there- after, additional families were added to bring the present total to 70. Among these are 45 sugarcane growers, 15 dairymen and several rice, cotton and live- stock farmers.
Following are a series of charts showing the changes in inventory income, and yields which occurred on the sugarcane farms during the five year period 1957-1961. These figures were taken from actual records kept by the farmers participating on the program.
(Table 1)
INVENTORY PER FARM (Excluding land)
AVERAGE 1957 1958 1959 1960 1961 (All sugarcane $17,637.99 $19,026.38 $19,194.40 $20,986.59 $23,024.61
farms on program)
The average investment (excluding land) per farm for all farmers enrolled on the Farm and Home Development program increased from $17,637.99 in 1957 to
$23,024.61 in 1961, reflecting an average increase in investment per farm of
$6,240.92 or 30 per cent.
18
(Table 2)
AVERAGE GROSS INCOME (5 Year Period) 1957
$ 5,338.52 7,993.55 20,087.49 37,001.23
$17,605.19
1958
$ 6,579.79 14,706.36 25,821.30 49,095.32
$24,050.69
1959
$ 7,122.08 11,859.06 29,015.06 56,865.17
$26,215.34
1960
$ 7,380.44 12,703.77 30,976.70 71,675.34
$30,684.06
1961
$ 8,601.83 17,135.81 42,003.93 87,113.05
$38,713.65 Group I (20-50 Acres)
Group II (50-100 Acres) Group III (100-200 Acres) Group IV (Over 200 Acres)
AVERAGE
In an effort to group the farms as closely as possible according to size of operation they were divided into four categories. Group I represents farms growing between 20-50 acres of sugarcane;
Group II 50-100 acres; Group III 100-200 acres and Group IV over 200 acres.
Over the five year period 1957-1961 the average gross income per farm (all groups) increased from
$17,605.19 in 1957 to $38,713.65 in 1961 or 120 per cent. The category showing the least increase in gross income during this period was Group I which had an increase of 61 per cent. The largest increase in gross income per farm was shown by Group IV which had an average increase of 135 per cent.
During this period there was a 35 per cent increase in acreage for all farms participating on the program.
(Table 3)
FARM INCOME
(Cash Income Over Cash Expenses) (Average Per Farm)
Group I (20-50 Acres) Group II (50-100 Acres) Group III (100-200 Acres) Group IV (Over 200 Acres)
AVERAGE FARM INCOME AVERAGE NET INCOME
During the five year period 1957-1961 average farm income (figured by substracting cash expenses from gross income) increased from $2,438.82 to $15,201.42, representing an increase of approximately 500 per cent. Group I with an increase of 86 per cent showed the smallest increase of all groups.
Group IV which progressed from a loss of $955.54 per farm in 1957 to an average farm income of $31,037.55 in 1961 showed the largest percentage of increase.
NET INCOME (after depreciation) - Using a straight line 10 per cent depreciation average net income of all groups increased during the same period from $675.03 in 1957 to $12,898.96 in 1961.
1957
$ 2 , 5 0 8 . 7 1 2 , 3 5 6 . 9 5 5 , 8 4 5 . 1 7 9 5 5 . 5 4
6 2 , 4 3 8 . 8 2 675.03
1958
$ 3 , 4 2 6 . 6 5 6 , 4 3 2 . 2 7 8 , 1 6 6 . 1 7 1 2 , 2 6 1 . 4 4
$ 7 , 5 7 1 . 6 3 5 , 6 6 9 . 0 0
1959
$ 3 , 4 2 7 . 0 8 5 , 2 8 9 . 0 2 8 , 7 2 5 . 3 8 1 4 , 8 8 8 . 8 3
$ 8 , 0 8 2 . 5 7 6 , 1 6 3 . 1 3
1960 S 3 , 8 0 8 . 5 8
5 , 4 1 0 . 6 5 1 1 , 9 2 6 . 6 8 2 2 , 8 1 2 . 7 2
$ 1 0?9 8 9 . 6 5 8 , 8 9 1 . 0 0
1961
$ 4 , 6 6 4 . 2 6 8 , 7 2 5 . 4 9 1 6 , 3 7 8 . 3 8 3 1 , 0 3 7 . 5 5
$ 1 5 , 2 0 1 . 4 2 1 2 , 8 9 8 . 9 6
(Table 4)
AVERAGE YIELD PER ACRE (5 Year Period)
1957 21.1 19.1 18.6 18,7
19.4 18.1
1958 26.8 25.9 26,6 25.1
26.1 23.7
1959 22.7 21.6 2.4.7 24,0
23.2 20.9
1960 21.8 22.1 22.7 27.2
23.4 20.1
1961 27.4 29.1 29.1 32.3
29.4 26.4 Group I (20-50 Acres)
Group II (50-100 Acres) Group III (100-200 Acres) Group IV (Over 200 Acres)
GROUP AVERAGE PARISH AVERAGE
In 195 7 the average yield of all farmers enrolled on the program was 19.4 standard tons per acre.
In 1961 the average yield per acre was 29.4 standard tons, an increase of 10 tons per acre of 52 per cent over the five year period. Not all categories, however, experienced the same rate of increase.
The average per acre increase for Group I was 6.3 tons; Group II 10 tons; Group III 10.5 tons and Group IV 13.6 tons.
In comparing the above yields with the parish average, ASC records show that in 1957 the average yield per acre in Iberia Parish was 18.1 standard tons. In 1961 the parish average was 26.4 standard tons or an average increase of 46 per cent over 1957.
Each year Farm and Home Development cooperators produced an average of from 1.3 to 3.4 more
AVERAGE FARM INCOME PER ACRE (Cash Income Over Cash Expenses)
1957 1958 1959 1960 1961
$33.69 $85.59 $69.71 $88.44 $107.51 AVERAGE NET INCOME PER ACRE
1957 1958 1959 1960 1961
$21.09 $56.64 $50.99 $66.63 $81.85 SUMMARY AND CONCLUSION
Over the five year period as average yields increased, average net income per farm also increased. Group IV (farmers growing over 200 acres of sugarcane) showed the largest percentage of increase in farm income. This same group also had the largest average yield per acre increase during this period. Within this period of time comparing 1958 with 1959 there was an actual decrease in yield of 2.9 tons per acre, however, average net income increased by approximately
$500.00 per farm.
Average net income in 1960 increased $2,737.87 over 1959 although the increase in yield was only .2 of a ton per acre.
The purpose of this presentation was certainly not an attempt to convince you that the Extension Service (Farm & Home Development Program) was entirely responsible for all the improvement shown by the farmers enrolled in this program.
I sincerely hope that I haven't left you with this impression. Many of these farmers were progressive minded and would undoubtedly have increased their efficiency regardless of whether they were participating on this program or not.
Weather conditions certainly also played an important part in determining yields.
I do believe, however, that this type of educational approach effected a significant influence on the progress shown by these farmers over this five year
22
period. It is reasonable to believe that each individual taking time out to study the problems peculiar to his particular farm and outlining a specific plan of action would improve his chances of making profitable decisions.
Record keeping and analyzing results at the end of each year's operation certainly added a businesslike approach which is becoming increasingly important in modern day farming.
23
A STUDY OF METHODS OF CANE QUALITY DETERMINATION FOR
CANE PAYMENT John J. Seip Chemical Engineering Department
Louisiana State University
Increasingly, cane payment based on the quality of the cane entering the factory is becoming general throughout the sugar cane growing areas of the world. Among the factors responsible for this is the growing volume of cane supplied to the factories by the independent cane farmers - and their greater participation in the affairs of the industry. One result of this has been emphasis on cane payment systems which relate the quality of the cane to the price paid for the cane.
In recent years - on a world wide scale - the sugar industry has engaged in extensive research to establish workable methods of cane quality deter- mination to serve as bases for cane payment. In Louisiana - for the past fifteen years - the LSU Chemical Engineering Department in cooperation with the industry has conducted studies at the Audubon Sugar Factory on methods of sampling, testing and evaluating sugar cane.
Concurrently with the pilot and plant scale studies, the LSU investi- gations have included rather comprehensive literature surveys and correspondence with representatives of the industry on methods of cane quality determination in the various cane growing areas of the world. The philosophy behind this phase of the research has been that in understanding the overall problems and experiences of others, we are better able to assess the problems in cane quality determination which may be peculiar to Louisiana.
I would like to review this phase of the LSU studies today - that is- some of the methods of cane quality determination for cane payment which are
24
used in other cane growing areas of the world.
In the subject of cane quality determination, we are including the whole aspect of (1) sampling or withdrawing the sample, (2) testing to include analyzing the sample, and (3) evaluating the results in terms of the quality of the cane.
The factors of sampling, testing, and evaluation are all inter-related.
A detailed test procedure is of questionable value if the sample is not representative of the complete shipment. By the same token, effort is wasted in careful sampling if the test procedure is not reproducible. Finally, the measure of cane quality as evaluated must bear some relation to the actual commercial value of the shipment.
In reviewing the different methods of cane quality determination it is well to recognize that they are all conditioned by circumstances peculiar to the area. Some areas have a high incidence of very small farming operations while other areas represent essentially large factory cane growing enterprises.
While most areas still hand harvest the cane, increasingly mechanical loading and to a lesser extent mechanical harvesting are practiced.
Finally, although some form of government regulation of the industry is fairly universal, such control is of varying degree, extending at one extreme in some areas to government supervisors in each of the factories to oversee the cane quality determination, to the other extreme of self-regulation by agreements among the farmers and the factory owners - with a minimum of govern- ment control.
In discussing specific methods of cane quality determination, they all seem to break down into two main categories. We are all familiar with the system of crusher samples - a system in which cane is sampled in the carrier.
Such determinations may be extended to include fiber determinations from the shredded cane in the carrier or from stalks of cane removed from the carrier.
We shall refer to this as indirect cane quality determination.
More recently, extensive studies have been directed toward determining the quality of the cane from a sample removed before the cane enters the carrier. Such studies had their natural origin in agronomic research, which was directed to determining the yield of the cane in the field. However, the growing incidence of mechanical harvesting and loading - with the resultant trash and soil accompanying the cane - has resulted in an increased frequency of cane washing installations throughout the industry. The resultant dilution of the crusher juice has made subsequent crusher juice inspections of doubtful value. The logical recourse has been to analyze the cane before it enters the carrier. By general usage, cane quality studies directed towards evaluating the cane before it enters the carrier or the milling process have been classified as direct cane quality determination.
In reviewing the cane quality determination systems we shall refer to the standard of cane quality. This is the unit which is used to define the quality of the cane. In Louisiana we use Normal Juice Sucrose and Purity.
We shall also refer to the cane quality formula. This is the formula to evaluate the cane in terms of the standard of cane quality. Generally, the formula equates some readily measureable quantity as the crusher juice inspections and possibly fiber - to the standards of cane quality.
South Africa
The use of the Java Ratio to evaluate cane is probably the oldest and simplest method of indirect cane quality determination. The Java Ratio is defined as:
Java Ratio = Sucrose % Cane Sucrose % Crusher Juice
The Java Ratio is used in South Africa where the standard of cane quality is sucrose % cane. Samples of crusher juice from the consignments of cane are
26
tested for apparent sucrose, and the results are applied to the cane quality formula.
Sucrose %
Sucrose % Cane = Crusher x Java Ratio Juice
The Java Ratio is determined weekly from the factory control data. The crusher juice inspections for each grower are averaged for the corresponding week.
Jamaica
In Jamaica, the purity of the crusher juice is incorporated into the formula - along with the Java Ratio and the crusher juice sucrose - to obtain cane quality in terms of recoverable sugar. The standard of cane quality is Tons of Cane per Ton of 96° Sugar, TC/TS. The cane quality formula is:
The factory TC/TS is based on actual factory performance.
Factory and
where: Y is the yield of 96° sugar per ton of cane.
S is the sucrose % crusher juice.
JR is the Java Ratio, Sucrose % Cane Sucrose % Crusher Juice E is the mill sucrose extration.
RTheo is the Winter-Carp theoretical retention.
BHE is the boiling house efficiency.
K is the factor for conversion of sucrose in sugar - at the actual purity of sugar - to 96° test sugar.
From these formulas, it is evident that the farmer's payment is factored to the efficiency of the factory. In other words, his cane quality in terms of recoverable sugar is dependent on the factory recovery of sugar.
Philippines
The system in the Philippines is similar to that of Jamaica in that the Java Ratio is used along with the purity of the crusher juice to determine cane quality in terms of recoverable sugar. However, some of the factories use specific standards of factory extraction and retention. In this manner, the farmer's payment is independent of the factory efficiency.
The standard of cane quality is Piculs of Sugar per Ton of Cane.
(A picul is about 133-1/2 pounds.) The cane quality formula is:
Sucrose %
Piculs of Sugar = Crusher Juice x Factor Ton of Cane
Where Factor = Piculs of Sugar
Ton Cane, Unit Sucrose % Crusher Juice The factor is expressed as follows:
W h e r e : JR is the Java R a t i o , Sucrose % Cane Sucrose % Crusher Juice E is the sucrose extraction.
J is the purity of the mixed juice.
M is the gravity purity of the molasses.
S is the gravity purity of the sugar.
BHE is the boiling house efficiency.
PS is the polarization of the sugar.
Tables of factors are worked out to express the yield for corresponding crusher juice purities.
28
Reunion
The Reunion method of Indirect Cane Quality Evaluation is of interest because it has been recently developed and is based on a thorough and rigorous treatment of the conventyional extraction and retention formulas.
This method is based on absolute juice in the cane (cane minus fiber) and thus requires fiber determinations in addition to the crusher juice analyses.
The standard of cane quality in Reunion is SE, which is defined as the commercial raw sugar of 97° titre % cane that should be obtained from a cane delivery, by a factory of 95% reduced extraction and 100% boiling house efficiency, and with a standard or ideal molasses purity (Titre = sucrose -2 x glucose -4 x ash). The cane quality formula, which was developed by E Hugot, is expressed as follows: (1)
SE = K x B1 (P1 - 30) (1-1.4f) ( 100 )
Where: SE is the commercial sugar of 97° titre % cane.
B1 is the Brix of the first expressed juice.
P1 is the purity of the first expressed juice.
f is the parts of fiber per 100 parts of cane.
K is the Factory Efficiency Coefficient,
The absolute juice quality is inferred from the crusher juice inspections and the fiber content of the cane. Fairly fixed ratios of the first expressed juice and absolute juice Brix and purities are assumed. These ratios are incorporated in K, the Factory Efficiency Coefficient. The stand extraction is a 95% reduced extraction at 12.5% fiber. The standard retention is developed through the use of the SJM formula and a boiling house efficiency of 100.
Final molasses purity is about 29.
In applying the formula, the Factory Efficiency Coefficient, K, is determined at the end of the crop by dividing the average factory SE by the
average growers' "theoretical" SE (SE from the formula without the factor K ) . Limits are set on the Factory Efficiency Coefficient to protect the grower from the inefficient factory, and to permit the efficient factory to rapidly recover its investment in equipment to improve its efficiency.
Queensland
Queensland too incorporates fiber in its determination.
Among the cane growing areas which early recognized that the determination of cane quality is a necessary adjunct to an equitable cane payment system, Queensland is probably best known for the indirect CCS system. CCS (Commercial Cane Sugar) is the standard of cane quality, and is defined as that percentage by weight of a shipment of cane which would be recovered as pure sucrose if milling and boiling house operations were conducted at a prescribed level of efficiency. The CCS formula, devised in 1888 and incorporated in the original 1915 industry control regulations, states in its simplest form that the sucrose recoverable from a given quantity of cane (CCS) is less than the sucrose present in the cane by an amount equal to one half of the soluble impurities in the juice in the cane.
Sucrose Dissolved Impurities CCS = in Cane - in cane
2
The cane quality formula as developed from this basic assumption is:
Where: P is the apparent sucrose (pol) % first expressed juice.
B is the Brix % first expressed juice.
F is the fiber % cane.
For many years the CCS formula was applied directly to determine the quality of the planters' cane. Fiber values were those which had been deter- mined previously by variety, whether plant or ratoon cane, and whether burned or "green." This was known as the Front Roller Juice - Stick Fiber CCS.
30
With the advent of juice scales and the subsequent more precise chemical control, inadequacies began to appear in this method. Particularly evident were discrepancies between undetermined losses by the juice scales and those based on the CCS method currently in use. This trend was aggravated by mechanization of harvesting operations in some areas and delay between burning and milling of cane.(2)
Several factories subsequently used an amended CCS system which incorporated revisions in the method of determining fiber, and permitted the juice scales to be used as control to determine a corrected CCS. Under the amended system - known as the Individual Fiber and Juice Weight CCS - weekly fiber determinations are made for the individual planters and a weekly factory CCS is determined which is based on the measurement of the cane, maceration water, and mixed
juice. A weekly correction factor is determined relating the factory CCS to the average planters' CCS as determined from the CCS formula. This factor is then applied to the individual planter's CCS to get a corrected CCS for each planter.
Direct Cane Quality Determination Methods
The discussion so far has dealt with indirect methods of cane quality determination - that is, determination of the quality of the cane in the carrier.
These methods all require crusher juice samples. The expedient of washing the cane in the carrier in response to mechanization of the harvesting operations has made crusher juice inspections of doubtful value. The recourse has been to methods of sampling the. cane before it enters the carrier, i.e., direct cane quality determination.
Two methods of testing are of interest. In the cold water extraction pro- cess, the cane sample is disintegrated and sub-sampled. Weighed portions of the sub-sample and tap water are vigorously agitated in a container which is
equipped with rapidly rotating blades. The residue and extract are then analyzed to determine the sucrose, Brix, and fiber percent cane.
Among the cold water extraction methods of interest are the Wet Dis- integrator method in Queensland,(3) the South African Cold Extraction process,(4)
and the Hawaiian Pol Ratio method.(5)
The other method of direct cane quality determination is the use of the three-roll sample mill, with which we are all familiar in Louisiana, and which forms the basis for the cane payment systems in most of the Louisiana factories.
For many years the three-roll sample mill has been used in agronomic research at the Houma Experiment Station of the United States Department of Agriculture. Through these studies the Sx-By cane quality formula was developed,
Y = Sx - By
Where: Y is the yield of 96° sugar per ton of cane, S is the sucrose % first expressed juice.
B is the Brix % first expressed juice, x and y are factors which incorporate reduction
factors - relating the quality of the first expressed juice to that of the normal juice, the normal juice extraction, and an assumed boiling house efficiency.
Arcenaux and Hebert have extensively reviewed this system in the techni- cal literature, and Dr. Arcenaux discussed its possible application to cane payment systems before the February 1960 meeting of the American Society of Sugar Cane Technologists.(6)
32
References
(1)Hugot, E. "Cane Payment on a Quality Basis." The International Sugar Journal, LVII (1955), 187-190.
(2)Anderson, G. A, "The Juice Scale - Individual Fiber System for the Determination of Cane Quality." Proceedings of the Tenth Congress of the International Society of Sugar Cane Technologists-Hawaii- 1959, pp. 181-187.
(3)Diecke, R. "Investigations with the Wet Disintegrator for the Direct Analysis of Cane," Proceedings of the Tenth Congress of the International Society of Sugar Cane Technologists - Hawaii - 1959, pp. 169-173.
(4)Douwes Dekker, K. "A Survey of the Work Done in S.A. on the Direct Analysis of Cane Consignments." Sugar Milling Research Institute, Quarterly Bulletin No. 7, (August, 1958), pp. 23-25.
(5)Darroch, J. G., Dennis on, F. C, and Rhodes, L. J. "The application of the Pol Ratio Method of Cane Analysis." Proceedings of the Tenth Congress of the International Society of Sugar Cane Technolo- gists - Hawaii - 1959. pp. 199-205.
(6)Arceneaux, George, "Standards of Cane Quality in Relation to Agronomic Research and Commercial Evaluation of Mill Cane." Paper delivered before the American Society of Sugar Cane Technologists, February, 1960.
THE EFFECT OF SHAVING SUGARCANE ON INCOME by
E. J. Lousteau, County Agent Assumption Parish
As County Agent it is my duty to provide farm people with useful and practical information and to encourage the use of that information for better farming and a better life on the farm.
In the fulfillment of this responsibility it was my duty to bring the research information available on shaving sugarcane to the growers I am working for and to encourage the use of this information.
Shaving sugarcane consists of cutting back in the late winter or early spring the above-ground growth with a horizontally revolving disc cutter.
The reasons for shaving are: (1) removing growth of winter cover crop on plant cane, (2) to remove stubble with poorly cut high stumpage and (3) to clean the top of the row. The practice of shaving sugarcane has been for generations in Assumption Parish and Louisiana.
The County Agent's main source of providing farm people with information is from research findings. In following this procedure, Dr. Leo Hebert, Research Agronomist Division of Sugar Plant Investigation, United States Department of Agriculture, has found the following on the Effect of Shaving on Sugarcane Yields,
RESULTS OF SHAVING EXPERIMENTS ON SUMMER PLANT CANE DURING 1950 BY DR. HEBERT Average yield decrease due to Shaving - Summer Plant Cane
Time of Shaving Average of Feb. 10 Feb. 20 Mar. 10 all dates Cane per acre (tons) 6.42 6.35 6.84 6.53 Sugar per ton of cane (pounds) 3.50 4.60 3.90 4.00 Sugar per acre (pounds) 1292 1313 1380 1328
Average yield decrease due to shaving 34
Plant Cane First Stubble Second Stubble Cane per acre (tons) 6.11 11.75 8.53 Sugar per ton cane (pounds) 16.6 9.00 10.8 Sugar per ton (pounds) 1898 2670 2078 Summary by Dr. Hebert
Results of shaving tests on sugarcane in Louisiana during the period 1947- 50, inclusive, show that:
1. Shaving of plant cane constantly depressed yields of plant cane, and was especially harmful in the case of late shaving with August planted
cane.
2. Residual effect of shaving plant cane on first stubble yields cannot be established on the basis of present information but results indicate a probably harmful effect in the case of summer plant cane.
3. Shaving had no measurable effect on indicated yields of sugar per ton of cane in tests conducted prior to the unusually mild winter of 1949-1950.
4. Shaving is much more injurious in some years than in others, and especially as following unusually mild winters.
The above information was presented to approximately 75 per cent or 175 of the sugarcane growers of Assumption Parish at a parish-wide meeting in the spring of 1954 by Dr. Hebert. The information presented on shaving caused a considerable amount of discussion but very little action. Only two growers in the spring of 1955 left some cane unshaved. The two growers were pleased with the unshaved svigarcane, therefore, the following season they and a few other growers left some sugarcane unshaved. More than 60 per cent of the 1961 sugarcane crop was not shaved.
To get some local information on the effect of shaving on sugarcane yield, four sugarcane growers agreed to work with the County Agent in 1961.
The four growers selected did most of the work themselves required in the cultivation and in the harvesting. Johnson grass nor any other grass were a problem on these farms.
Four rows were shaved and the next four rows were used as checks. There were two replications in each experiment.
The sugarcane was cut with a cane cutting machine,, Following the cutting a representative sample was taken by the County Agent, The samples were analyzed by the factory buying the sugarcane.
The sugarcane was weighed at the farm hoist equipped with a scale.
The local ASC office was used in figuring acreage in each plot and evaluating the sugarcane.
The results obtained by the Assumption growers were as follows:
Jim Templet -- 47-193 Plant Cane Shaved March 10th
Tons Per Acre Sucrose Purity Value Per Acre Not Shaved 29.5 12.36 78.88 $245.32 Shaved 24.4 13.09 79.87 204.65 Difference +5.1 -.73 - .99 +40.67 Paul Landry, Sr. & Sons -- 44-101 Plant Cane
Shaved March 1st
Tons Per Acre Sucrose Purity Value Per Acre Shaved 39.8 14.18 83.86 $403.57 Not Shaved 39.3 14.52 85.21 411.08 Difference -.5 +.34 +1.35 +7.51 Estate Eenry Landry -- 48-103 Plant Cane
Shaved March 7th
Tons Per Acre Sucrose Purity Value Per Acre Not Shaved 34.6 12.98 80.60 $317.03 Shaved 33.3 13.02 81.03 304.81 Difference +1.3 -.04 -.43 +12.22
36
The average income was $30.01 more per acre for the not shaved plots than the shaved plots. These same rows will be shaved as stubble and results obtained.
Remarks; Other benefits from not shaving (1) Cost of Shaving - actual cost for shaving is not available, but we all know that it cost to shave; (2) Stunting disease - our Plant Pathologist reports that stunting disease is spread through the cane juice and shaving is one means of spreading the disease;
(3) Covering plant cane - our research people report that too much dirt in covering plant cane effects stands. The grower who does not plan to shave plant cane definitely does not put as much dirt in covering plant cane; (4) Grass control - where Johnson grass is not a problem it seems like summer grass is not as much of a problem when the cane is left unshaved because the cane shades the row earlier.
Growers: The growers are outstanding farmers whose yields are considered above average and who do their own work. What would the difference be for farmers whose shaving is done by hired labor and whose yield is not as high?
Tons Per Acre Sucrose Purity Not Shaved 37.2 13.72 82.50 Shaved 35.7 12.37 79.14 Difference +1.5 +1.35 +3.36
Value Per Acre
$363.49 308.07 +55.42
Tons Per Acre Sucrose Purity Not Shaved 35.1 11.77 77.74 Shaved 31.1 11.70 77.69 Difference +4.0 +.07 +.05
Value Per Acre
$284.43 250.20 +34.23 Andre Thibodeaux -- 52-68 Plane Cane
Shaved March 7th.
Andre Thibodeaux -- 36-103 1ST; Stubble Shaved March 7th
The four growers selected did most of the work themselves required in the cultivation and in the harvesting. Johnson grass nor any other grass were a problem on these farms.
Four rows were shaved and the next four rows were used as checks. There were two replications in each experiment.
The sugarcane was cut with a cane cutting machine. Following the cutting a representative sample was taken by the County Agent. The samples were analyzed by the factory buying the sugarcane.
The sugarcane was weighed at the farm hoist equipped with a scale.
The local ASC office was used in figuring acreage in each plot and evaluating the sugarcane.
The results obtained by the Assumption growers were as follows:
Jim Templet -- 47-193 Plant Cane Shaved March 10th
Paul Landry, Sr. & Sons -- 44-101 Plant Cane Shaved March 1st
Estate Henry Landry -- 48-103 Plant Cane Shaved March 7th
Tons Per Acre Sucrose Purity Value Per Acre Not Shaved 29.5 12.36 78.88 $245.32 Shaved 24.4 13.09 79.87 204.65 Difference +5.1 -.73 - .99 +40.67
Tons Per Acre Sucrose Purity Value Per Acre Shaved 39.8 14.18 83.86 $403.57 Not Shaved 39.3 14.52 85.21 411.08 Difference -.5 +.34 +1.35 +7.51
Tons Per Acre Sucrose Purity Value Per Acre Not Shaved 34.5 12.98 80.60 $317.03 Shaved 33.3 13.02 81.03 304.81 Difference +1.3 -.04 -.43 +12.22
36
The average income was $31.01 more per acre for the not shaved plots than the shaved plots. These e&me rows will be shaved as stubble and results obtained.
Remarks: Other benefits from, not shaving (1) Cost of Shaving - actual cost for shaving is not available-) but we. all know that it cost to shave; (2) Stunting disease - our Plant Pathologist reports that stunting disease is spread through the cane juice and shaving is one means of spreading the disease;
(3) Covering plant cane - our research people report that too much dirt in covering plant cane effects stands. The grower who does not plan to shave plant cane definitely does cot rut as much dirt in covering plant cane; (4) Grass control - where Johnson grass is not a problem it seems like summer grass is not as much of a problem when the cane is left unshaved because the cane shades the row earlier.
Growers: The growers are outstanding farmers whose yields are considered above average and who do their own work. What would the difference be for farmers whose shaving is done by hired labor and whose yield is not as high?
Andre Thibodeaux -- 52-68 Plant Cane Shaved March 7th
Not Shaved Shaved Difference
Tons Per Acre 37.2 35.7 +1.5
Sucrose 13.72 12.37 +1.35
Purity 82.50 79.14 +3.36
Value Per Acre
$363.49 308.07 +55.42 Andre Thibodeaux -- 36-103 1ST; Stubble
Shaved March 7th
Not Shaved Shaved Difference
Tons Per Acre 35.1 31.1 +4.0
Sucrose 11.77 11.70 +.07
Purity 77.74 77.69 +.05
Value Per Acre
$284.43 250.20 +34.23
The four growers selected did most of the work themselves required in the cultivation and in the harvesting. Johnson grass nor any other grass were a problem on these farms.
Four rows were shaved and the next four rows were used as checks. There were two replications in each experiment.
The sugarcane was cut with a cane cutting machine. Following the cutting a representative sample was taken by the County Agent, The samples were analyzed by the factory buying the sugarcane.
The sugarcane was weighed at the farm hoist equipped with a scale.
The local ASC office was used in figuring acreage in each plot and evaluating the sugarcane.
The results obtained by the Assumption growers were as follows:
Jim Templet -- 47-193 Plant Cane Shaved March 10th
36 Not Shaved
Shaved Difference
Tons Per Acre 29.5 24.4 +5.1
Sucrose 12.36 13.09 -.73
Purity 78.88 79.87 - .99
Value Per Acre
$245.32 204.65 +40.67 Paul Landry, Sr. & Sons -- 44-101 Plant Cane
Shaved March 1st
Shaved Not Shaved Difference
Tons Per Acre 39.3 39.3 -.5
Sucrose 14.18 14.52 + .34
Purity 83.86 85.21 +1.35
Value Per Acre
$403.57 411.08 +7.51 Estate Henry Landry -- 43-103 Plant Cane
Shaved March 7th
Not Shaved Shaved Difference
Tons Per Acre 34.6 33.3 +1.3
Sucrose 12.98 13.02 -.04
Purity 80.60 81.03 -.43
Value Per Acre
$317.03 304.81 +12.22
Not Shaved Shaved Difference
Tons Per Acre 37.2 35.7 +1.5
Sucrose 13.72 12.37 +1.35
Purity 82.50 79.14 +3.36
Value Per Acre
$363.49 308.07 +55.42 Andre Thibodeaux -- 36-105 1ST Stubble
Shaved March 7th
The average income was S3C.0I more per acre, tor the not shaved plots than the shaved plots. These came rows will be shaved as stubble and results obtained.
Remarks: Other benefits from not shaving (1) Cost of Shaving - actual cost for shaving is not available, but we all know that it cost to shave; (2) Stunting disease - our Plant Pathologist reports that stunting disease is spread through the cane juice and shaving is one means of spreading the disease;
(3) Covering plant cane - our research people report that too much dirt in covering plant cane effects stands. The grower who does not plan to shave plant cane definitely does not put as much dirt in covering plant cane; (4) Grass control - where Johnson grass is not a problem it seems like summer grass is not as much of a problem when the cane is left unshaved because the cane shades the row earlier.
Growers: The growers are outstanding farmers whose yields are considered above average and who do their own work. What would the difference be for farmers whose shaving is done by hired labor and whose yield is not as high?
Andre Thibodeaux -- 52-68 Plant Cane Shaved March 7th
Not Shaved Shaved Difference
Tons Per Acre 35.1 31.1 +4.0
Sucrose 11,77 11,70 +.07
Purity 77.74 77.69 +.05
Value Per Acre
$284.43 250.20 +34.23
PROBLEMS CREATED BY INSECTICIDE USE by
W, H, Long, Department of Entomology
Research, Louisiana, State University
The use of insecticides for insect control on agricultural crops has greatly increased the quantity and quality of farm produce particularly during the last two decades. Many fruit and vegetable crops would no longer be acceptable to the average American shopper if insecticides were not used to protect them from insect damage. The wormy apple once on display at the supermarket is now a thing of the past. Because of endrin, Louisiana sugar cane farmers are now better able to control the sugarcane borer than ever before.
Since the toxicity of most of the insecticides currently available is not limited to the pests against, which they are used, pesticide use frequently has created new problems while solving old ones. Besides the problems which must concern us arising from the toxicity of these chemicals, they may not. provide effective pest control indefinitely due to the proven capacity of many pest species for developing resistance to the chemicals used against them.
We w i l l here consider various problems created by insecticide use under the headings of crop residues soil residues, balance of nature, and resistance to insecticides. Since you are interested primarily in sugar cane production, we will be most concerned with those problems associated with the use of insecticides currently recommended for the use on sugar cane in Louisiana, i.e.
endrin and chlordane,
Crop Residues
Many of our most effective insecticides tend to remain active, under some conditions, when they are no longer needed. This residual nature is
38
characteristic of both chlordane and endrin and is partially responsible for their efficiency as pesticides. However, this same characteristic neces- sitates care to insure the residues of these chemicals do not remain in food for human consumption.
The American people are well protected from this danger by the Federal Food, Drug and Cosmetic Act of 1938 and by the so called Miller Amendment to this Act which was passed in 1954. This Act of 1938 prohibits the contamination of food by foreign substances, and the 1954 Amendment requires the establishment of residue tolerance levels together with legal machinery for dealing with foods contaminated with excessive residues. There have been no cases of illness in this country from insecticide residues on food when
formulations have been used according to directions (Hayes, 1960).
In the case of chlordane and endrin the law requires that these insect- icides be used in such manner that no resulting residues will remain in food for human consumption. The Federal Insecticide, Fungicide and Rodenticide Act of 1947, which might be called the labeling law, requires that research be carried out and data presented to show that, if used according to directions, the presticide will produce the biological result claimed and will be safe. Dangers are cited and precautions are clearly stated in the label before it is approved. Labels are not accepted for use on crops until residues have been determined, proper intervals from treatment to harvest set, and tolerance limits established (Hayes, 1960).
It has been generally assumed that compounds having very low solubility in water, such as chlordane and endrin, would not be translocated in plants to an appreciable degree (Westlake and Antonio, 1960). While exceptions to this are know, particularly when some root crops are grown in insecticide treated soil, the assumption generally has been substantiated by research data. There is no reason to believe that the current use of chlordane in