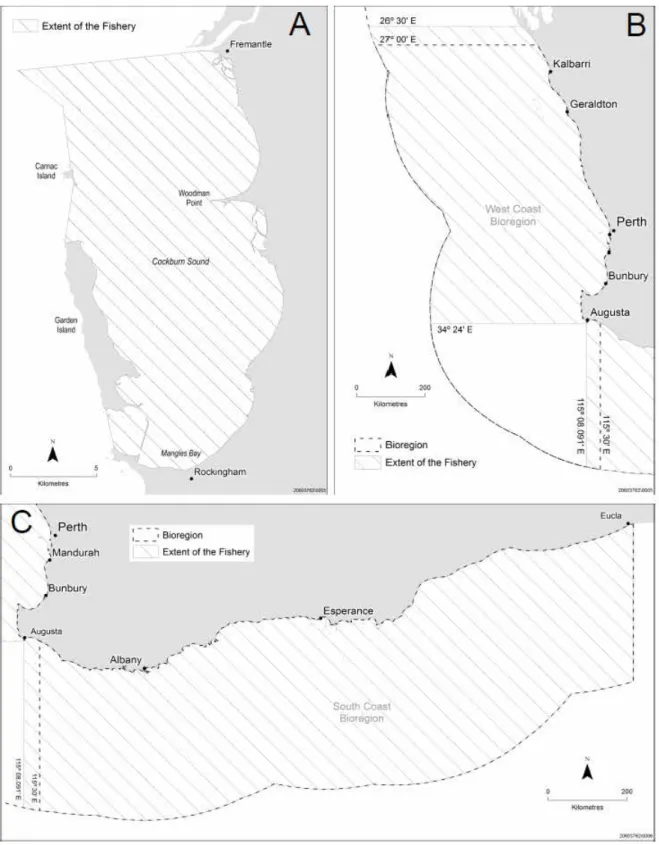
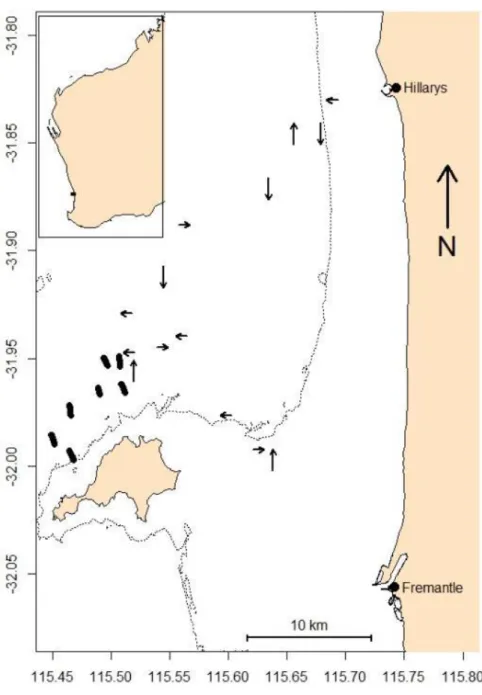
The dotted line represents the delineation of the net northward (arrow up) and net southward (arrow down) migration of the humpback whale population on the Western Australian coast. The results of the gear trial of this project provided guidance for the chosen gear modifications.
Introduction
Western Rock Lobster Fishery
These included changes to season length, pot use, and other constraints that appeared to affect entanglement rates with migrating humpback whales (Table 1). Maximum pot use is defined as a percentage of the initial fixed pot use number (68,961) Seasonal system Seasonal closure Maximum Pot Use Other restrictions / Notes 1965/66 Attempt 16 Aug – 14 Nov Fixed pot numbers1.
Developmental Octopus Fishery
Humpback Whales
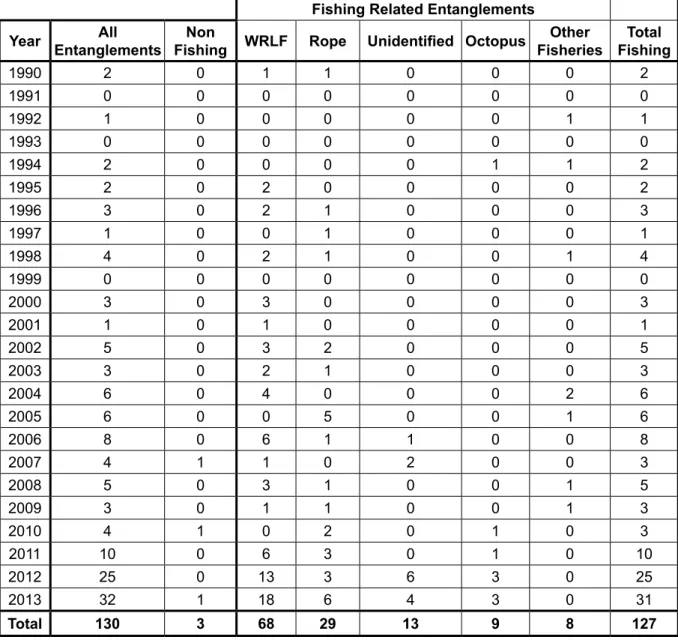
Whale Entanglements
There is also a significant financial impact on fishermen due to loss or damage to fishing gear and lost income from lost catch. Even if all reported entanglements in the WRLF and DOF eventually led to mortality, the current number of interactions was judged to be so negligible that it would not affect the viability of this population (Stoklosa 2013).
Objectives
Methods
Spatial and temporal overlap of migrating whales and fishing gear
- Existing information
- Additional data collection
- Commercial Fishing Data
- Preliminary spatial analysis
The width/length for each block was defined as the midpoint of the 0.1o x 0.1o block. The 'likely' entanglement location (latitude/longitude) and mean depth was determined through a weighted average based on the number of pots for each fishing record.

Fishing gear modifications
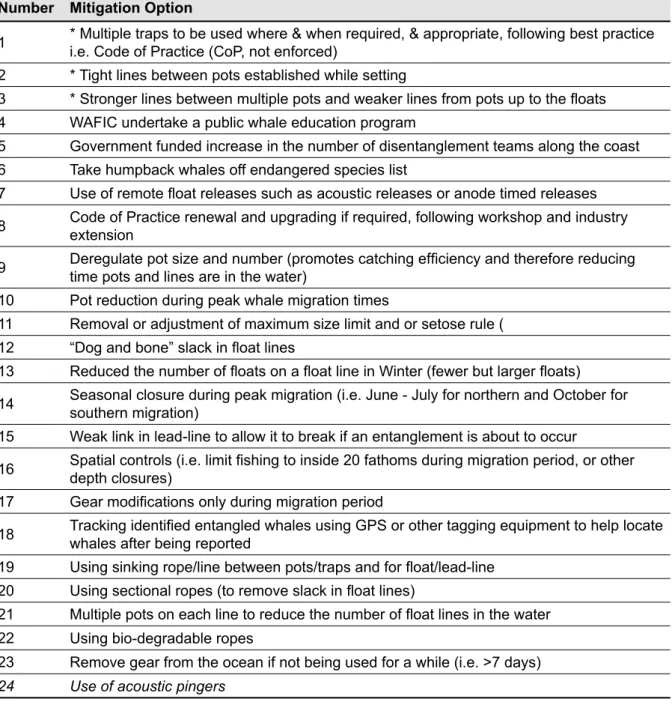
- Mitigation options identified in industry workshop
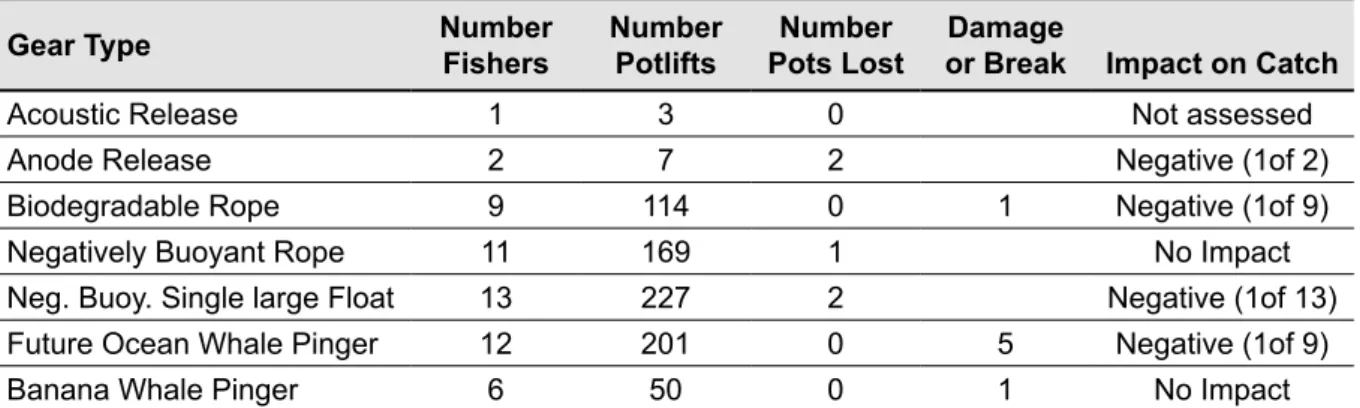
- Pilot trials of gear modifications
- Preliminary assessment of acoustic pingers
- Examination of retrieved ropes from dis-entangled whales
Comparisons of cetacean responses to the pinger array were performed using two components of the data set. Initially recovered gear was returned to the fisherman when the owner of the gear could be identified.
Results
Spatial and temporal overlap of migrating whales and fishing gear
Existing information
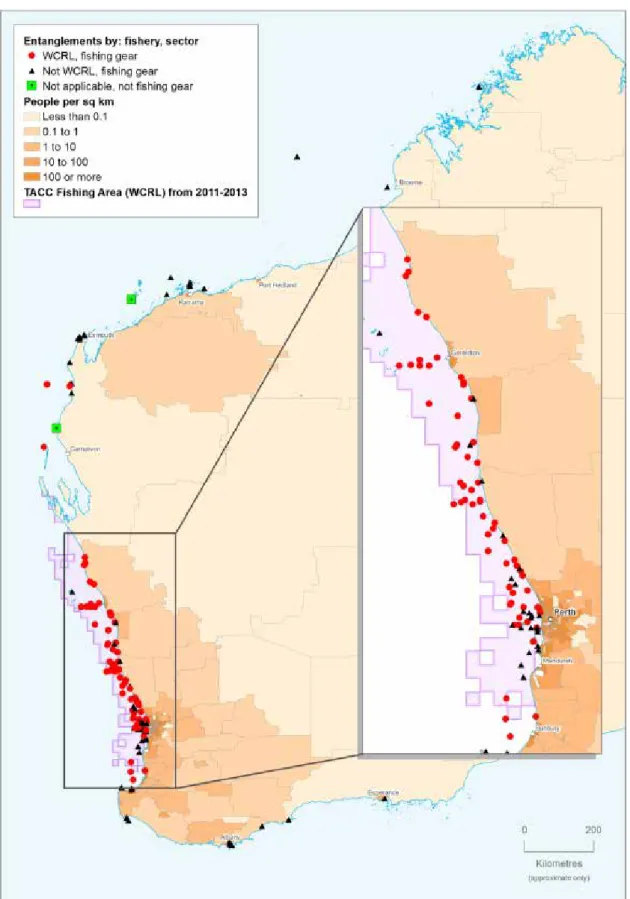
During the first half of the migration season (May to August), the net movement of the population is in a northerly direction (Chittleborough. During this period, 17 entangled whales were reported moving north; however, there were 11 entangled whales moving south in contrary to the net movement of the population during this period (Figure 13). In the first half of the migration period, when the entire population is heading north, only three entangled whales moved north.
During the second half of the migration period, which is a generally southward migration, three whale movements were investigated. At times the whale was recorded 200 km west of the Australian coast in waters where the depth was 5000 meters. In the southern part of the state (Albany, Augusta, Cape Naturaliste and 'Metro') there was a clear separation in whale sightings representing the northern and southern migration.
Initiate collection of additional spatial and temporal information through
Commercial Fishing Data
With the introduction of ITQ, there was a marked change in the average pot soaking time during the whale migration period (Figure 21b). The time pots were left soaking in water almost doubled with the introduction of ITQ (Figure 21b). This decline continued in 2010 with the competitive quota resulting in the closure of the fishery early that season (Figure 23).
In deeper water (31-40 and >40 det) there was a steady increase in rope days for additional months from 2011 to 2013 (Figure 24). Figure 21 Timeline of a) effort (pot tows) b) soak time (days between pot tows) and c) longline days for the western lobster fishery during the whale migration period (including May–November). Despite the increased effort, there has been little change in the soaking period during the development of the fishery (Figure 27b), averaging about 12 days between hauls since 2008. Through the longline, the number of vertical lines is about 43 million rope days compared to 89 million line days if no line was used in the fishery (Figure 27c).

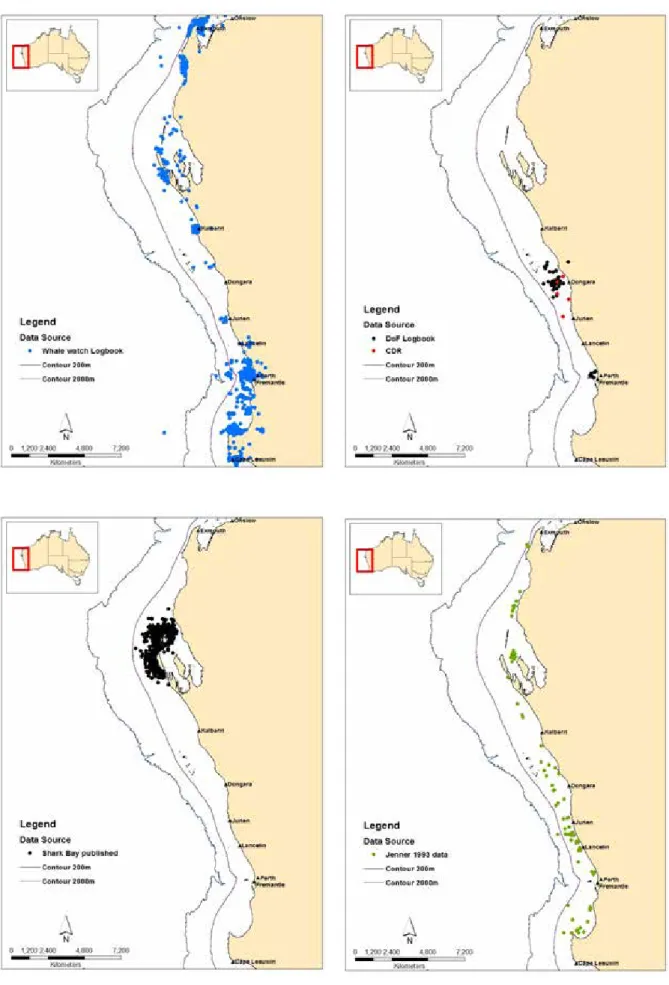
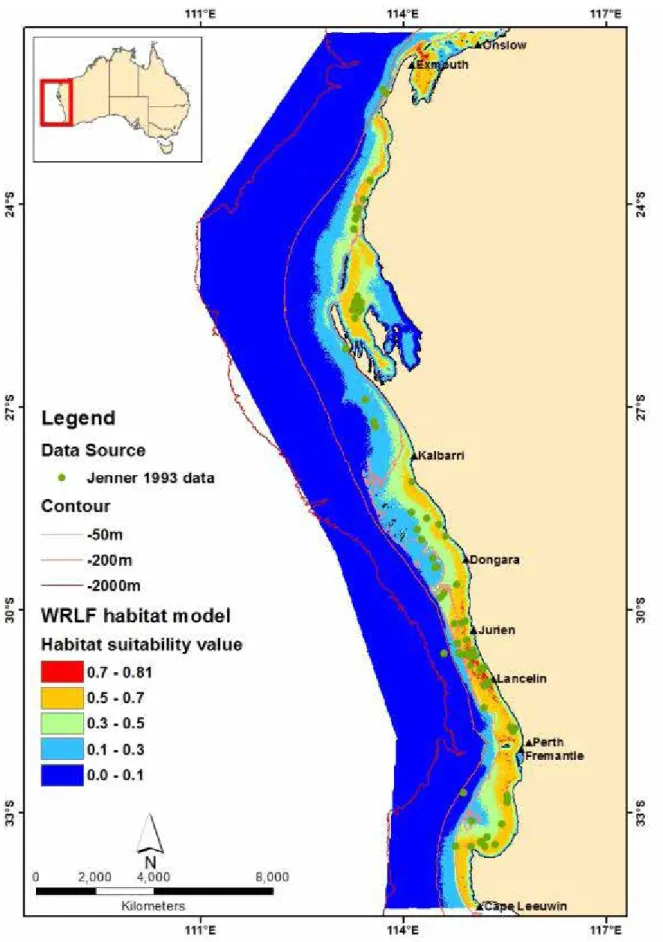
Preliminary spatial analysis of all available data
In particular, water depth has the highest gain when used in isolation and thus appears to have the most useful factor. Water depth also reduces the gain the most when omitted, suggesting that it has the most information not present in the other variables. Response curves characterizing the relationship between probability of occurrence and environmental variables indicate a preference (habitat suitability values > 0.5) for water depths between 4 and 40 m (highest probability between 16 and 28 m; Figure 30a), distances between 5.3 and 21 km from the coast (highest probability at 10 km; Figure 30b) and distances between 17 and 63 km from the 200 m contour line (highest probability at 27 km; Figure 30c).
However, there was also a large range from 17 to 106 km from the reef with a habitat suitability value of 0.48, indicating that this predictor is not extremely reliable in identifying the distribution of humpback whales in isolation.
Examine the effectiveness of potential gear modifications to the float rigs of
Mitigation options identified during an industry run workshop
However, it may happen that fishermen will shift more effort to the whale migration season to take advantage of this increased efficiency. Allowing the conservation of cetose lobsters that occur mainly during the whale migration period will make this period, which is otherwise not a peak fishing period, more viable due to the increase in catch. Similarly, deregulation of pot numbers may increase the number of pots that can be caught by fishermen and, in turn, increase the overall number of vertical lines in the water during the whale migration period.
Most successful disentanglements are achieved when the whale is anchored in such a way that it can be relocated and detonated without free swimming (D. Coughran pers. comm.). They are not designed to act as a deterrent as the signal strength is not of a sufficient level to deter interactions (Werner et al. 2006), but they are designed to transmit a signal that the whale will warn about the presence of fishing gear in the water. The indication from the Department of Fisheries is that gear modifications will only currently be necessary during the whale migration period, with this project focusing on identifying possible gear modifications.
Pilot trials of gear modifications that may mitigate entanglements with whales . 59
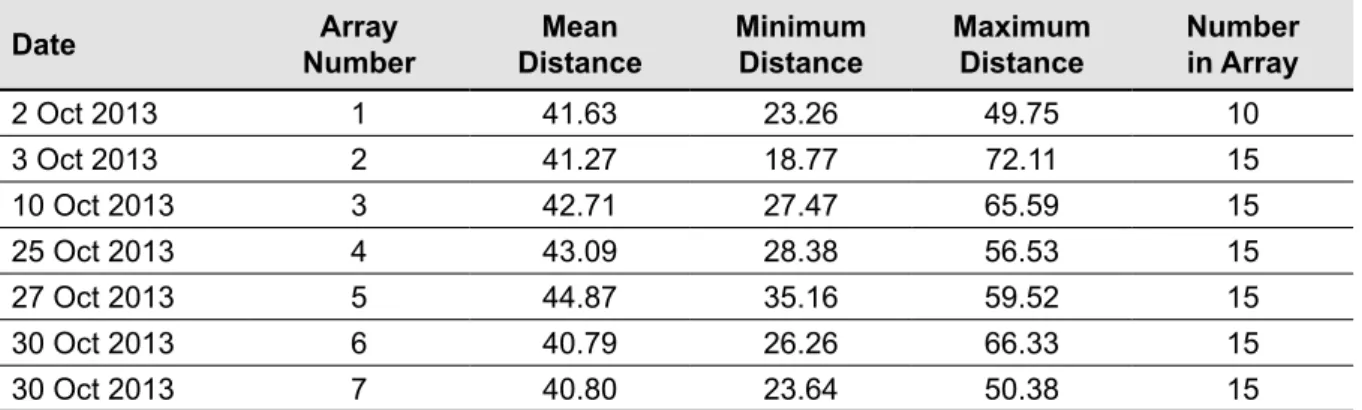
Similarly, using Fisher's exact test, he found no significant difference in the proportions of pods showing no change in direction between active and inactive pingers (p=1), with six 2x2 contingency table probabilities calculated using hypergeometric probabilities all less than the probability of the observed table. Finally, 95% credible intervals for the proportion of pods of whales changing direction for the entire dataset obtained via MCMC were for inactive and for active pingers, indicating no difference in proportions. The analysis was also performed on those whale pods that showed a clear interaction with the array.
Fisher's exact test also yielded no significant difference in the proportion of pods showing no clear change in direction between active and inactive ping arrays (p=0.584). The 95% credible intervals obtained via MCMC for the proportion of pods that changed direction for the reduced data set were for inactive pingers and for active pingers, indicating no difference in proportions. Overall, all three methods of comparing the proportion of whale pods showing no direction change (for the full or reduced data sets) suggest that there is no statistical difference due to pinger activity.
Detailed examination of retrieved ropes from dis-entangled whales
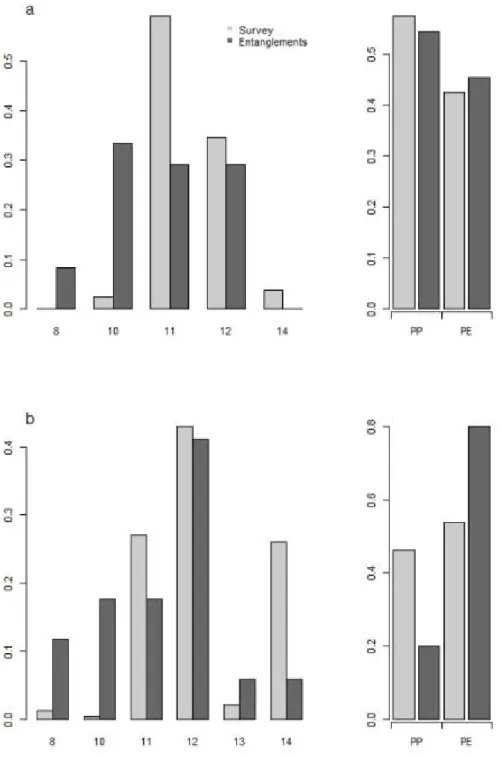
The most commonly used mainline color in the fishery is yellow (>40%), with red, orange, green, pink and blue also contributing between 8-13% (Figure 36a). Yellow was again the predominant color in the ropes of face drill rigs, while red and black ropes were also used in about 20% of the drill rigs (Figure 36b). Orange head ropes were significantly more involved in entanglements than their use in fisheries would suggest, while red was not involved in entanglement despite being used in 19% of the head ropes in the fishery (Figure 37b).
There was no significant difference (p=0.892) between the distribution of the numbers of float used in head farmers in the fishery and those involved in entanglement (Figure 38). However, it is worth noting that the proportion of gear with 3 - 5 rafts was higher in entanglement than that used in the fishery (Figure 38). Due to the large number of possible raft configurations, a statistically robust examination between those used in the fishery and those involved in entanglements was not possible.
Discussion
Humpback Whale Migration
Increase in whale entanglements
First, whale entanglement reports have increased in recent seasons during the traditional (May-June) part of the WRLF season. Historically, the average number of complications reported during this part of the season was two (range, zero to five). Most of the gear that could be inspected based on entanglement reports was main lines, floats and head attachments.
Variations on the attachment method have been suggested by anglers and may lead to lower pinger failure rates. One suggested reason for the slow population recovery is due to interactions and entanglements with the commercial fishing gear of the US Northeast. Since the fishery is located in the foraging areas of the NARW, there are often baleen in the mouth when entangled.

Conclusion
Implications
Recommendations
Further development
The changes in the arrival of peak humpback whale abundances in Augusta, identified by commercial whale watching logs, provide a means by which to identify humpback whale migration signals. This project and FRDC 2014-004 explore the possibility of using one of the whale's primary senses, hearing, to aid in entanglement reduction through acoustic pingers. If humpback whales have similar visual sensitivity to the North Atlantic right whales (Kraus et al. 2014), the over-representation of yellow and orange ropes may indicate humpback whales actively targeting ropes.
This could therefore highlight rope colours, which may be more visually detectable to humpback whales and thus reduce whale entanglements. Vital information such as the first point of contact (where in the water column) the interaction takes place, the function of the slack line or floating rig in the entanglement is not able to be adequately understood. The fishing gear is modeled so that the breaking gear, rope diameter and density can be copied in the model.
Extension and Adoption
Project coverage
Project materials developed
Mortality and serious injury to northern right whales (Eubalaena glacialis) in the western North Atlantic Ocean. Kraus SD, Brown MW, Caswell H, Clark CW, Fujiwara M, Hamilton PK, Kenney RD, Knowlton AR, Landry S, Mayo CA, Mclellan WA, Moore MJ, Nowacek DP, Pabst DA, Read AJ, Rolland RM. State of Western Australia Fisheries and Aquatic Resources Reports 2013/14: State of Fisheries Perth: Department of Fisheries, Western Australia.
Effects of adding sounds to cod traps on the probability of humpback whale collisions. Underwater topography determines critical breeding habitat for humpback whales near Osa Peninsula, Costa Rica: implications for marine protected areas. Southern Hemisphere humpback whales winter off Central America: insights from water temperature in longest mammal migration.
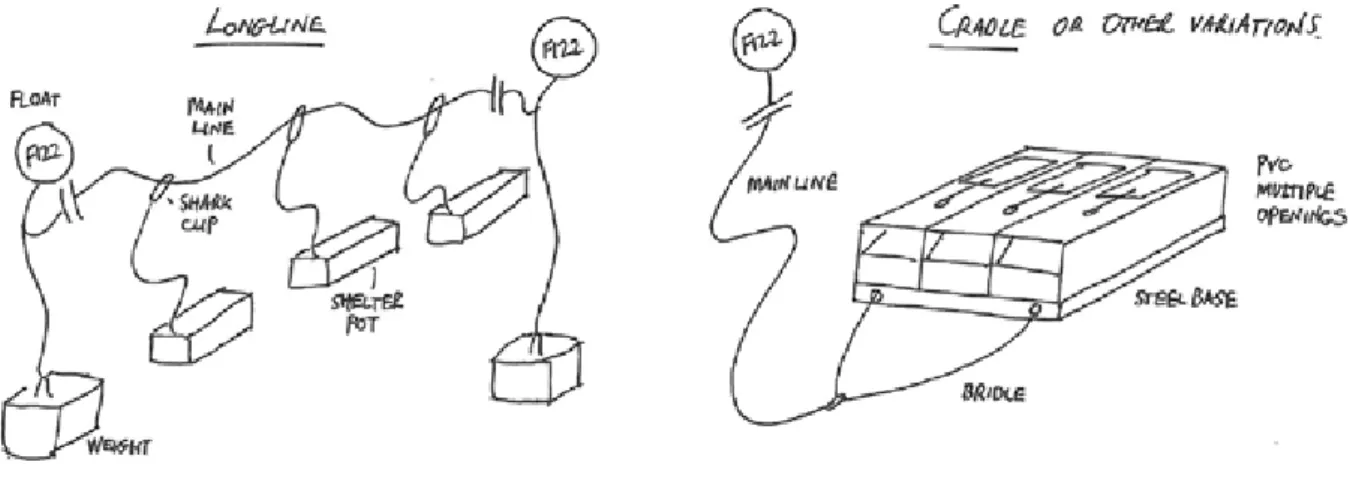
Possible method of attachment for whale pingers to the main line Lay the cord through the main line of the trap line up to.
Number of fish caught in winter from May to November (number in . water, not entitlement). Eyed Standard Knot A double sheet bend using an eyed end through an eyed joint. Another form of knot is used to tie the floating line into the headline.